2026-07-27
Home
Japanese

Omega Investment Co., Ltd.
Kidswell Bio (Company note – 2Q update)

| Share price (11/13) | ¥132 | Dividend Yield (24/3 CE) | – % |
| 52weeks high/low | ¥352/126 | ROE(TTM) | -100.5 % |
| Avg Vol (3 month) | 775.8 thou shrs | Operating margin (TTM) | -57.2 % |
| Market Cap | ¥4.7 bn | Beta (5Y Monthly) | N/A |
| Enterprise Value | ¥5.8 bn | Shares Outstanding | 35.837 mn shrs |
| PER (24/3 CE) | – X | Listed market | TSE Growth |
| PBR (23/3 act) | 5.30 X |
| Click here for the PDF version of this page |
| PDF Version |
Received approval for the fourth BS product (GBS-010).
2Q FY2023 financial results were in line with the plan.
◇ Summary of 2Q FY2023 Financial Results
Kidswell Bio’s 2Q FY2023 financial results came out in line with the initial forecasts. Sales were 580 million yen (-47.9% YoY), operating loss was 720 million yen (vs. an operating income of 11 million yen in the same quarter of FY2022), and net loss was 780 million yen (vs. a net loss of 0.04 billion yen last year). The company believes it can meet its full-year forecasts because sales contributions from biosimilar (BS) products, including GBS-007, will be concentrated in the second half. As for the company’s other BS products, GBS-010 (Pegfilgrastim BS), the fourth BS product, received approval in September and is expected to be launched this year. In the cell therapy business (regenerative medicine), the company completed enrollment of the first patient in a Nagoya University-led clinical research for children with cerebral palsy. Progress is also being made in the clinical development of SHED (Stem cells from Human Exfoliated Deciduous teeth).
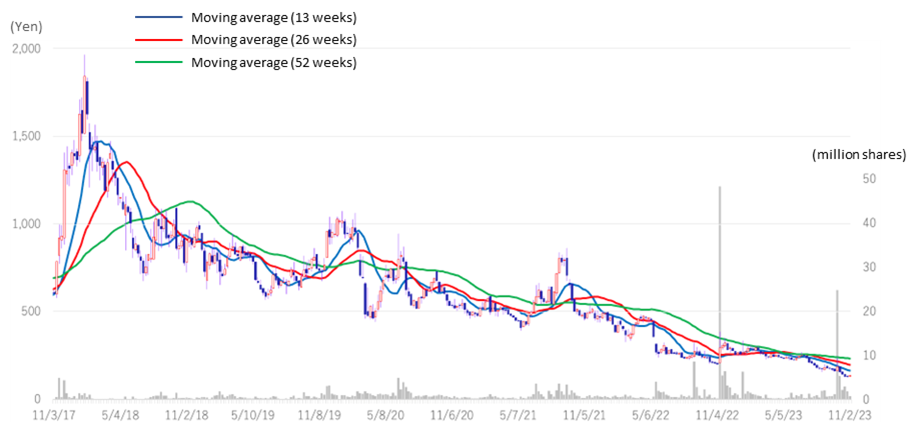
◇ Stock Price Trends:
The company’s stock price positively reacted to the announcement of the approval of the fourth BS product on September 26, rising 30% from the previous day, but has since returned to its recent downtrend. Although the BS business is expanding, as described below, the profitability of BS is below the forecast due to the weaker yen and higher import costs due to inflation overseas and because the company expects further investment related to SHED. The stock price is at an extremely low level, and we would like to keep an eye on the earnings trend, particularly for BS, progress in the pipeline for regenerative medicine and other products, as well as where related up-front payments and milestone revenues could go.
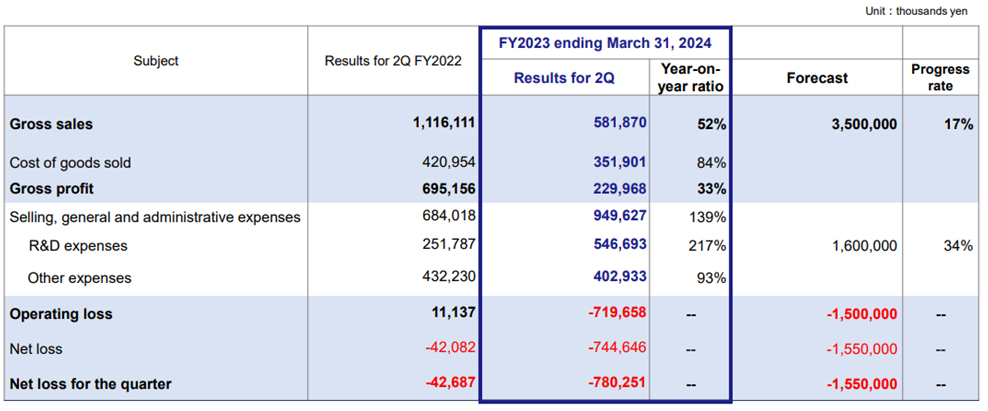
◇ 2Q FY2023 Results: Sales down due to a bias toward the second half of the fiscal year
In 2Q FY2023, the company posted sales of 581 million yen, down 47.9% YoY, an operating loss of 719 million yen (vs. operating income of 11 million yen in 2Q FY2022), and a net loss of 780 million yen (vs. net loss of 42 million yen last year).
YoY sales declined due to the absence of the one-time revenue from the completion of the master cell bank in the same period of the previous year, and, as noted in the last report, the timing of the BS shipments in this 1Q led to a decline in sales. In addition, the company’s 2Q gross profit declined 66.9% YoY due to higher import costs by the weak yen and inflation overseas (the company’s bulk pharmaceuticals for BS are procured from overseas).
The company continued to invest in R&D for regenerative medicine, centering on SHED and posted 546 million yen in R&D expenses in 2Q, which doubled YoY, and a 38.8% YoY increase in SG&A expenses. As a result, the company registered an operating loss of 719 million yen, down from a profit of 11 million yen in 2Q FY2022. Non-operating expenses included 8 million yen in interest paid on a bank loan. The company posted a net loss of 780 million yen, compared with a net loss of 42 million yen in 1Q FY2022 (see next page, top chart).
| JPY, mn, % | Net sales | YoY % |
Oper. profit |
YoY % |
Ord. profit |
YoY % |
Profit ATOP |
YoY % |
EPS (¥) |
| 2020/3 | 1,077 | – | -1,161 | – | -1,187 | – | -7,316 | – | -264.65 |
| 2021/3 | 996 | -7.5 | -969 | – | -991 | – | -1,001 | – | -34.79 |
| 2022/3 | 1,569 | 62.3 | -651 | – | -968 | – | -535 | – | -17.86 |
| 2023/3* | 2,776 | 76.9 | -550 | – | -624 | – | -657 | – | -20.77 |
| 2024/3 (CE) | 3,500 | 26.1 | -1,500 | – | -1,550 | – | -1,550 | – | -45.23 |
| 2023/3 2Q* | 1,116 | – | 11 | – | -42 | – | -42 | – | -1.36 |
| 2024/3 2Q | 581 | -47.9 | -719 | – | -744 | – | -780 | – | -24.10 |
* FY2019 – FY2021 on a consolidated basis; FY2022 onwards on a non-consolidated basis.
2Q FY2023 Results (PL)
Source: Company materials
On the balance sheet, cash and deposits were virtually unchanged from the end of 1Q, but accounts receivable increased by 407 million yen due to an increase in biosimilar sales. In addition, the equity finance announced in July 2023 enabled the manufacturing of biosimilars business to proceed as planned and improved shareholders’ equity, increasing total net assets by 306 million yen to 1,075 million yen. As a result, total assets at the end of September 2023 amounted to 3,193 million yen, up 149 million yen from the end of June 2023. The company expects to improve its capital efficiency in the future, mainly by shortening the time to recover manufacturing funds through cooperation and support from its partners.
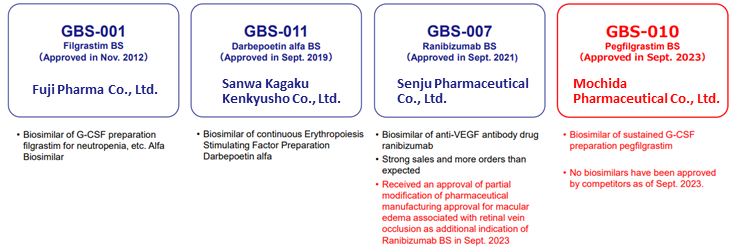
❖ Biosimilars Business: The fourth product (GBS-010) received approval in September
Pegfilgrastim BS (GBS-010), which the company has been developing with Mochida Pharmaceutical as a development partner, received manufacturing and marketing approval in September 2023 and is expected to go on sale by the end of this year after listing on the NHI drug price list in November. GBS-010 effectively prevents the onset of febrile neutropenic symptoms caused by cancer chemotherapy and was approved as the first BS to be used against the prior product G-LASTA (Kyowa Kirin). Sales of G-LASTA are expected to be around 30 billion yen in 2022 and grow further on a volume basis.
Currently, there are 18 BS products approved in Japan. Of these, 4 products are from the company. For Filgrastim BS (GBS-001), approved in November 2012, and darbepoetin alfa BS (GBS-011), approved in September 2019, the switch in use from the prior product to BS is over 80%. Ranibizumab BS (GBS-007), approved in September 2021, has no BS competitors. Pegfilgrastim BS (GBS-010) also has no competition, and biosame has not yet been launched. Both products are expected to expand their market shares.
This spring, the Ministry of Health, Labor and Welfare (MHLW) set a target of increasing the percentage of the ingredients of BSs that have replaced at least 80% of the predecessor products (by volume) to at least 60% by the end of FY2029 to promote the widespread use of BSs. Of the current 18 components, three have achieved 80% or more, and the company has launched BS for two of them with its partners. Although it will initially take time to spread, as seen in the case of small molecule generics, it is expected to become more widespread in the future, partly due to policy support. The company is exploring partnerships with mid-sized pharmaceutical companies and is considering developing a fifth product and beyond.
BS business line-up
Source: Company materials
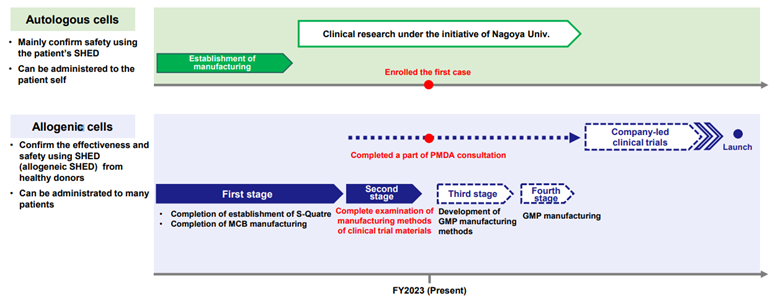
❖ Cell Therapy Business (Regenerative Medicine): Enrollment of the first patients for Nagoya University-led clinical research completed
The company’s cell therapy business has a pipeline of nearly 10 products. The one making the most progress is the clinical research for cerebral palsy conducted with Nagoya University. On October 16, the company announced that the first case in Nagoya University’s clinical research for children with cerebral palsy had been enrolled (https://jrct.niph.go.jp/latest-detail/jRCTb040230042). The cells to be administered in this clinical study are autologous cells derived from the patient’s own deciduous teeth, and a clinical trial to investigate the safety and tolerability of a single dose will be conducted under the leadership of Nagoya University.
In addition, a portion of the PMDA’s consultation on SHED derived from allogenic cells has been completed to enter into a corporate clinical trial for children with cerebral palsy. The company will develop manufacturing methods in GMP facilities for the production of investigational drugs.
Progress in SHED Clinical Development
Source: Company materials
◇FY2023 full-year forecasts: unchanged from the beginning of the fiscal year
As of the end of 2Q FY2023, the company has not changed its forecasts for net sales, operating loss, and net loss for FY2023, which are 3.5 billion yen, 1.5 billion yen, and 1.55 billion yen, respectively. As of 2Q, the sales progress ratio against the full-year estimate was 17%, which is a concern. However, as mentioned above, in addition to the strong sales of Ranibizumab BS (GBS-007), the newly approved Pegfilgrastim BS (GBS-010) will contribute to sales from December, and with BS sales biased toward the second half, the company expects to achieve its full-year forecasts.
◇Equity financing, IR, etc…..: Investor Concerns
Since July 2023, the company has been raising funds (equivalent to about 3 billion yen) for working capital for its biosimilar business. The company could have borrowed from banks to raise working capital, which is highly certain to generate sales. Still, it has chosen equity financing this time, considering the need to strengthen its equity capital. Since the company will need to raise R&D expenses continuously, further dilution through equity financing concerns investors. However, when explaining the current financing, President Kurebayashi stated that the company has no immediate plans for equity financing. In addition, if the BS business continues to grow (KWB 2.0, the company’s medium-term strategic plan, calls for sales of 3.0 billion yen in FY2025, but the company already expects 3.5 billion yen in FY2024), cash flow from this business will support investment in R&D, including SHED, as previously planned.
As noted in our previous report, President Kurebayashi also assumed the position of CCO (Chief Communications Officer) in conjunction with his appointment as CEO. He has extensive experience in the financial sector, including foreign firms, and fully understands the concerns of investors. Since assuming the position of CEO/CCO, President Kurebayashi has also been taking a more active role in investor relations, holding frequent seminars for individual investors, updating IR materials, and making other changes in IR activities. Hopefully, the company will continue to provide detailed explanations to wipe off investors’ concerns.
◇Thoughts on stock price: Although having positively reacted to the approval of the fourth BS product, the stock price continues to trend downward. Dissolving investors’ concerns is the key to share price recovery.
The company’s stock price rose sharply by +30% on September 26 following the announcement of the approval of the fourth BS product but has since returned to its recent downtrend. This is presumably due to investors’ concerns that although the biosimilar business is expanding, its profitability is lower than initially planned, affected by the yen depreciation and higher import costs caused by inflationary economies overseas and that the company expects further investment for research and development, including that for SHED. The company plans to continue reducing manufacturing costs, as the yen’s near-term depreciation also weighs on profits.
Drug discovery ventures require funds in the billions of yen or more each year for R&D. Although the company expects to generate cash flow from BS, there are concerns that further financing may be required if drug discovery and development accelerates. In addition, investors may also be concerned about how the company’s major shareholders could do with their shareholdings. Drug discovery ventures are inherently risky and require a long investment period, so investors must be able to bear such risks. On the other hand, the company’s stock price is at a historic low since its IPO and looks demanding. We expect the share price to turn around as the management team addresses these concerns of investors one by one.
Stock price transition (last 6 years)
Financial data
| FY (¥mn) | 2021/3 | 2022/3 | 2023/3 | 2024/3 | ||||||||||
| 1Q | 2Q | 3Q | 4Q | 1Q | 2Q | 3Q | 4Q | 1Q* | 2Q | 3Q | 4Q | 1Q | 2Q | |
| [Statements of income] | ||||||||||||||
| Net sales | 121 | 53 | 547 | 276 | 303 | 438 | 642 | 186 | 610 | 505 | 610 | 1,049 | 45 | 535 |
| Cost of sales | 5 | 35 | 46 | 34 | 122 | 154 | 183 | 91 | 292 | 128 | 233 | 597 | 0 | 351 |
| Gross profit | 116 | 19 | 500 | 242 | 182 | 283 | 460 | 94 | 318 | 377 | 377 | 453 | 45 | 184 |
| SG&A expenses | 354 | 463 | 465 | 565 | 491 | 425 | 442 | 580 | 356 | 328 | 524 | 869 | 500 | 449 |
| R&D expenses | 138 | 265 | 198 | 363 | 297 | 236 | 237 | 380 | 105 | 146 | 327 | 637 | 312 | 234 |
| Operating profit (loss) | -238 | -445 | 36 | -323 | -309 | -142 | 18 | -486 | -37 | 49 | -146 | -415 | -455 | -264 |
| Non-operating income | 0 | 1 | 1 | 1 | 2 | 0 | 0 | 1 | 0 | 2 | 0 | 1 | 2 | 0 |
| Non-operating expenses | 7 | 5 | 4 | 8 | 6 | 8 | 15 | 7 | 43 | 13 | 5 | 17 | 17 | 10 |
| Ordinary profit (loss) | -244 | -450 | 33 | -330 | -314 | -150 | 4 | -493 | -80 | 39 | -151 | -431 | -470 | -274 |
| Extraordinary income | 418 | 0 | – | – | – | – | – | – | ||||||
| Extraordinary expenses | 0 | 1 | 8 | 0 | – | – | – | – | – | 35 | ||||
| Profit (loss) before income taxes | -244 | -451 | 26 | -331 | -314 | -148 | 421 | -493 | -80 | 39 | -151 | -462 | -470 | -309 |
| Total income taxes | 1 | 0 | 0 | 1 | 0 | 1 | 52 | -51 | 0 | 1 | 0 | 0 | 302 | 303 |
| Net profit (loss) | -245 | -451 | 25 | -330 | -314 | -149 | 369 | -441 | -80 | 38 | -152 | -462 | –470 | -310 |
| [Balance Sheets] | ||||||||||||||
| Current assets | 3,573 | 3,218 | 3,329 | 3,346 | 2,794 | 3,203 | 3,722 | 3,326 | 4,079 | 4,035 | 3,948 | 3,697 | 2,847 | 3,031 |
| Cash equivalents and short-term securities |
2,658 | 2,502 | 1,830 | 1,461 | 874 | 974 | 1,253 | 1,187 | 1,532 | 1,874 | 1,499 | 1,067 | 624 | 622 |
| Non-current assets | 379 | 393 | 340 | 588 | 728 | 656 | 178 | 177 | 225 | 224 | 224 | 197 | 197 | 161 |
| Tangible assets | 2 | 2 | 2 | 3 | 3 | 2 | 2 | 2 | 1 | 1 | 1 | 1 | 1 | 1 |
| Investments and other assets | 374 | 389 | 336 | 582 | 722 | 651 | 173 | 173 | 220 | 220 | 220 | 193 | 193 | 158 |
| Total assets | 3,952 | 3,611 | 3,670 | 3,934 | 3,522 | 3,859 | 3,901 | 3,503 | 4,304 | 4,259 | 4,173 | 3,894 | 3,044 | 3,193 |
| Current liabilities | 772 | 858 | 925 | 1,114 | 823 | 1,034 | 1,045 | 1,129 | 1,175 | 651 | 780 | 1,055 | 767 | 731 |
| Short-term borrowings | 25 | |||||||||||||
| Long-term debts to be repaid within one year | 75 | 250 | 300 | 400 | 375 | 375 | 425 | |||||||
| Non-current liabilities | 1,384 | 1,287 | 1,231 | 1,209 | 1,051 | 826 | 718 | 656 | 1,485 | 1,908 | 1,704 | 1,605 | 1,508 | 1,387 |
| Long-term debt | 1,340 | 1,240 | 1,200 | 1,100 | 900 | 700 | 700 | 625 | 1,450 | 1,875 | 2,275 | 1,575 | 1,475 | 1,350 |
| Long-term borrowing | 600 | 600 | 600 | 600 | 600 | 600 | 600 | 525 | 1,350 | 1,275 | 1,175 | 1,075 | 975 | 850 |
| Convertible bonds | 740 | 640 | 600 | 500 | 300 | 100 | 100 | 100 | 100 | 500 | 500 | 500 | ||
| Total liabilities | 2,156 | 2,145 | 2,156 | 2,324 | 1,873 | 1,860 | 1,763 | 1,785 | 2,661 | 2,560 | 2,485 | 2,661 | 2,275 | 2,118 |
| Total net assets | 1,796 | 1,466 | 1,514 | 1,610 | 1,648 | 1,999 | 2,138 | 1,719 | 1,643 | 1,699 | 1,688 | 1,233 | 768 | 1,075 |
| Total shareholders’ equity | 1,796 | 1,466 | 1,514 | 1,610 | 1,648 | 1,999 | 2,138 | 1,719 | 1,444 | 1,500 | 1,490 | 1,037 | 571 | 892 |
| Capital | 842 | 892 | 912 | 1,032 | 1,150 | 1,420 | 1,420 | 1,421 | 1,424 | 1,433 | 1,504 | 1,509 | 1,511 | 1,827 |
| Legal capital reserve | 10,147 | 10,197 | 10,217 | 10,338 | 10,456 | 10,725 | 10,726 | 10,727 | 10,730 | 10,739 | 10,810 | 10,815 | 10,817 | 11,132 |
| Retained earnings | -9,322 | -9,773 | -9,748 | -10,079 | -10,393 | -10,542 | -10,173 | -10,614 | -10,710 | -10,672 | -1,0824 | -11,287 | -11,757 | -12,067 |
| Stock acquisition right | 70 | 82 | 101 | 116 | 134 | 145 | 165 | 185 | 199 | 199 | 197 | 195 | 197 | 182 |
| Total liabilities and net assets | 3,952 | 3,611 | 3,670 | 3,934 | 3,522 | 3,859 | 3,901 | 3,503 | 4,304 | 4,259 | 4,173 | 3.894 | 3,044 | 3,193 |
| [Statements of cash flows] | ||||||||||||||
| Cash flow from operating activities | -104 | -1,267 | -857 | -1,169 | -709 | -1,421 | -877 | |||||||
| Loss before income taxes | -695 | -999 | -462 | -533 | -42 | |||||||||
| Cash flow from investing activities | -5 | -22 | – | 526 | -23 | -28 | – | |||||||
| Expenditure on acquisition of intangiblefixed assets |
-3 | -3 | – | -1 | – | – | ||||||||
| Purchase of investment securities | – | – | – | – | -50 | -50 | – | |||||||
| Sales of investment securities | – | – | – | 526 | – | – | – | |||||||
| Cash flow from financing activities | 579 | 718 | 370 | 369 | 1,446 | 1,356 | 432 | |||||||
| Income from the issuance of convertible bond-type bonds with stock acquisition rights |
970 | 970 | – | |||||||||||
| Income from issuance of shares by exercising stock acquisition rights |
599 | 599 | – | – | 499 | 499 | – | |||||||
| Income from issuance of stock acquisition rights |
– | 138 | 370 | 369 | – | 34 | 584 | |||||||
| Proceeds from issuance of new shares | 4 | 4 | – | – | – | 1 | 22 | |||||||
| Net increase in cash and cash equiv. | 468 | -571 | -486 | -273 | 713 | -93 | -444 | |||||||
| Cash and cash equiv. at beginning of period | 2,032 | 2,032 | 1,461 | 1,462 | 1,160 | 1,160 | 1,067 | |||||||
| Cash and cash equiv. at end of period | 2,501 | 1,461 | 974 | 1,187 | 1,874 | 1,067 | 622 |
Note: Consolidated basis until FY2021; non-consolidated basis from 1Q FY2022. For the statement of cash flows, the figures for 2Q are the cumulative figures for the period from 1Q to 2Q, and the figures for 4Q are the cumulative figures for the period from 1Q to 4Q. Therefore, the opening balance is also the balance at the beginning of each quarter.
Source: Omega Investment from company materials
| FY (¥mn) | 2013/3 | 2014/3 | 2015/3 | 2016/3 | 2017/3 | 2018/3 | 2019/3 | 2020/3 | 2021/3 | 2022/3 | 2023/3* |
| [Statements of income] | |||||||||||
| Net sales | 60 | 301 | 321 | 1,160 | 1,089 | 1,059 | 1,021 | 1,077 | 996 | 1,569 | 2,776 |
| Cost of sales | 15 | 141 | 147 | 500 | 397 | 422 | 412 | 653 | 119 | 550 | 1,250 |
| Gross profit | 45 | 159 | 174 | 660 | 692 | 637 | 609 | 424 | 876 | 1,018 | 1,525 |
| SG&A expenses | 403 | 671 | 998 | 1,480 | 1,876 | 1,550 | 1,414 | 1,585 | 1,846 | 1,937 | 2,076 |
| R&D expenses | 206 | 412 | 689 | 1,075 | 1,433 | 1,107 | 945 | 898 | 963 | 1,150 | 1,216 |
| Operating loss | -358 | -512 | -824 | -820 | -1,184 | -913 | -806 | -1,161 | -969 | -919 | -550 |
| Non-operating income | 0 | 0 | 34 | 50 | 35 | 11 | 3 | 1 | 2 | 2 | 3 |
| Non-operating expenses | 16 | 5 | 0 | 15 | 27 | 0 | 14 | 27 | 24 | 36 | 77 |
| Ordinary loss | -373 | -516 | -790 | -785 | -1,176 | -903 | -816 | -1,187 | -991 | -952 | -624 |
| Extraordinary income | 0 | 7 | 5 | 418 | – | ||||||
| Extraordinary expenses | 0 | 45 | 45 | 6,132 | 8 | 31 | |||||
| Loss before income taxes | -373 | -517 | -790 | -785 | -1,222 | -902 | -854 | -7,314 | -999 | -533 | -656 |
| Total income taxes | 3 | 2 | 1 | 1 | 2 | 1 | 1 | 2 | 1 | 1 | 1 |
| Net loss | -377 | -519 | -792 | -787 | -1,224 | -904 | -856 | -7,316 | -1,001 | -535 | -657 |
| [Balance Sheets] | |||||||||||
| Current assets | 919 | 1,881 | 1,092 | 1,520 | 3,421 | 2,692 | 2,821 | 3,322 | 3,346 | 3,325 | 3,697 |
| Cash and cash equivalents | 887 | 1,610 | 599 | 817 | 2,379 | 1,891 | 2,009 | 2,032 | 1,461 | 1,187 | 1,067 |
| Non-current assets | 3 | 4 | 54 | 173 | 284 | 332 | 329 | 269 | 587 | 177 | 197 |
| Tangible assets | 1 | 0 | 0 | 2 | 1 | 1 | 1 | 1 | 3 | 1 | 1 |
| Investments and other assets | 2 | 3 | 53 | 171 | 282 | 330 | 328 | 267 | 581 | 172 | 193 |
| Total assets | 922 | 1,886 | 1,146 | 1,694 | 3,706 | 3,025 | 3,151 | 3,592 | 3,933 | 3,503 | 3,894 |
| Current liabilities | 24 | 50 | 92 | 1,279 | 189 | 404 | 400 | 880 | 1,114 | 1,128 | 1,055 |
| Short-term borrowings | 810 | 25 | 75 | 375 | |||||||
| Non-current liabilities | 9 | 783 | 783 | 11 | 16 | 16 | 19 | 1,223 | 1,209 | 656 | 1,605 |
| Total liabilities | 34 | 833 | 876 | 1,290 | 205 | 421 | 420 | 2,104 | 2,323 | 1,784 | 2,661 |
| Total net assets | 888 | 1,052 | 270 | 403 | 3,500 | 2,604 | 2,731 | 1,487 | 1,610 | 1,718 | 1,233 |
| Total shareholders’ equity | 888 | 1,031 | 249 | 383 | 3,472 | 2,568 | 2,695 | 1,451 | 1,291 | 1,533 | 1,037 |
| Capital stock | 1,239 | 1,571 | 1,576 | 2,037 | 4,194 | 100 | 591 | 611 | 1,032 | 1,421 | 1,509 |
| Legal capital reserve | 1,143 | 1,474 | 1,479 | 1,940 | 4,097 | 3,372 | 3,864 | 9,917 | 10,337 | 10,726 | 10,815 |
| Retained earnings | -1,495 | -2,014 | -2,806 | -3,594 | -4,818 | -904 | -1,760 | -9,077 | -10,078 | -10,613 | -11,287 |
| Evaluation/conversion difference | -0 | 3 | 2 | 1 | -21 | 202 | |||||
| Subscription rights to shares | 21 | 21 | 21 | 23 | 32 | 34 | 57 | 116 | 184 | 195 | |
| Total liabilities and net assets | 922 | 1,886 | 1,146 | 1,694 | 3,706 | 3,025 | 3,151 | 3,592 | 3,933 | 3,503 | 3,894 |
| [Statements of cash flows] | |||||||||||
| Cash flow from operating activities | -304 | -729 | -970 | -607 | -1,759 | -438 | -860 | -1,325 | -1,267 | -1,169 | -1,421 |
| Loss before income taxes | -373 | -517 | -790 | -785 | -1,222 | -902 | -854 | -7,314 | -999 | -533 | -656 |
| Cash flow from investing activities | -0 | -1 | -49 | -121 | -149 | -50 | -0 | -137 | -22 | 526 | -28 |
| Purchase of investment securities | -49 | -116 | -149 | -100 | -50 | ||||||
| Cash flow from financing activities | 907 | 1,454 | 9 | 946 | 3,471 | 978 | 1,221 | 718 | 369 | 1,356 | |
| Proceeds from issuance of common shares | 917 | 234 | 9 | 486 | 3,932 | 973 | 40 | 138 | 369 | 34 | |
| Net increase in cash and cash equiv. | 601 | 722 | -1,010 | 217 | 1,562 | -488 | 118 | -240 | -571 | -273 | -93 |
| Cash and cash equiv. at beginning of period | 285 | 887 | 1,610 | 599 | 817 | 2,379 | 1,891 | 2,009 | 2,032 | 1,461 | 1,160 |
| Cash and cash equiv. at end of period | 887 | 1,610 | 599 | 817 | 2,379 | 1,891 | 2,009 | 2,032 | 1,461 | 1,187 | 1,067 |
| FCF | -305 | -732 | -1,021 | -729 | -1,909 | -488 | -860 | -1,462 | -1,289 | -643 | -1,450 |
Note: Consolidated basis until FY2021; non-consolidated basis from 1Q FY2022. For the statement of cash flows, the figures for 2Q are the cumulative figures for the period from 1Q to 2Q, and the figures for 4Q are the cumulative figures for the period from 1Q to 4Q. Therefore, the opening balance is also the balance at the beginning of each quarter.
Source: Omega Investment from company materials