2026-07-15
Home
Japanese

Omega Investment Co., Ltd.
Itoki (Company note – 3Q update)

| Share price (11/28) | ¥1,317 | Dividend Yield (23/12 CE) | 2.43 % |
| 52weeks high/low | ¥1,587/450 | ROE(TTM) | 13.39 % |
| Avg Vol (3 month) | 255.9 thou shrs | Operating margin (TTM) | 5.90 % |
| Market Cap | ¥60.14 bn | Beta (5Y Monthly) | 0.89 |
| Enterprise Value | ¥53.81 bn | Shares Outstanding | 45.664 mn shrs |
| PER (23/12 CE) | 12.41 X | Listed market | TSE Prime |
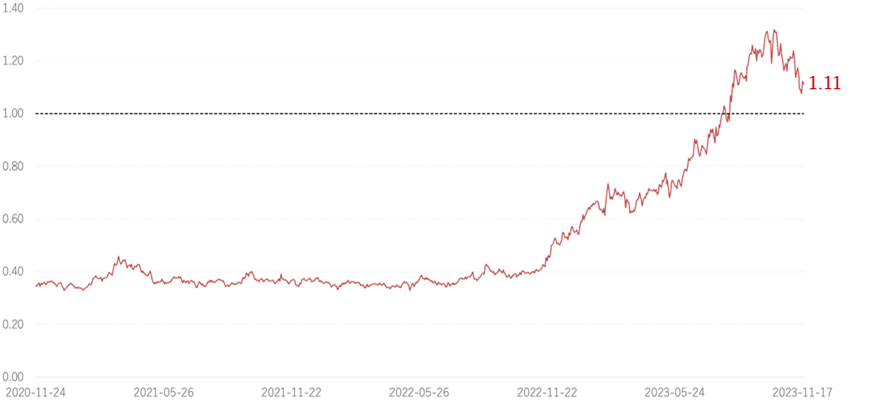
| PBR (22/12 act) | 1.11 X |
| Click here for the PDF version of this page |
| PDF Version |
Steady acquisition of renewal, office relocation, and other projects led to an 8% increase in sales and an 80% rise in operating profit
◇ Summary of 3Q results for FY12/2023: Sales up 8% and operating profit up 80% on the back of solid office furniture demand
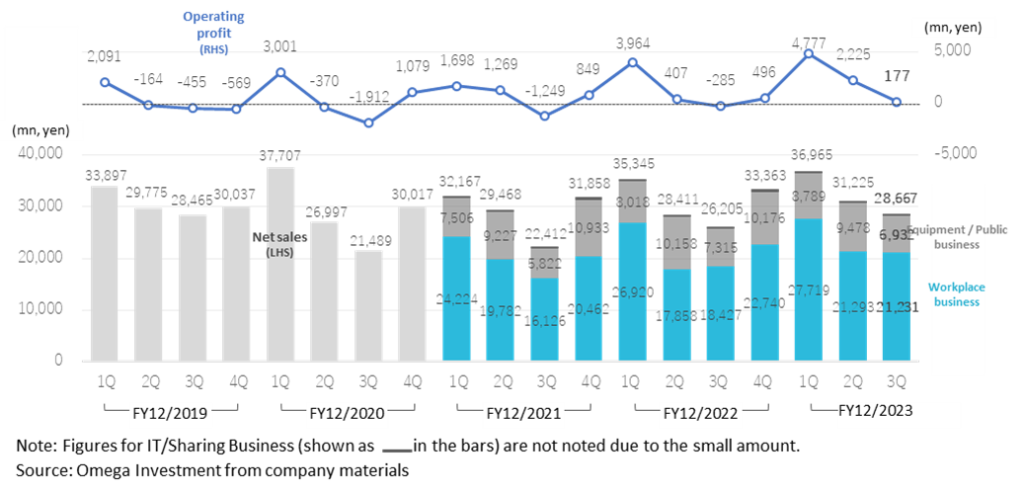
Itoki’s FY12/2023 3Q results (cumulative nine months) were an 8% increase in sales and an 80% rise in operating profit, with both sales and operating profit achieving record highs for the 3Q cumulative period. Sales in 3Q were strong, mainly due to renewal projects and office relocations, as in 2Q. In addition to the benefit of increased sales, the company overachieved its earnings target thanks to the improved profit margin due to enhanced customer value, despite an increase in SG&A expenses due to strategic spending.
In 3Q (July-September), sales usually decline due to the summer slump and the execution of expense budgets, resulting in an operating loss. However, in this 3Q, the company booked sales of 28.6 billion yen (+9.4% YoY) and delivered an operating profit of 170 million yen (vs. an operating loss of 280 million yen in 3Q FY2022).
As of the end of the 3Q, sales, operating profit, and net profit attributable to owner of parent were 74%, 96%, and 102% of the revised forecasts revealed at the time of the 2Q results announcement, respectively. Although costs are expected to increase in 4Q due to the ongoing DX investment and capital expenditures, further upward revisions are expected.
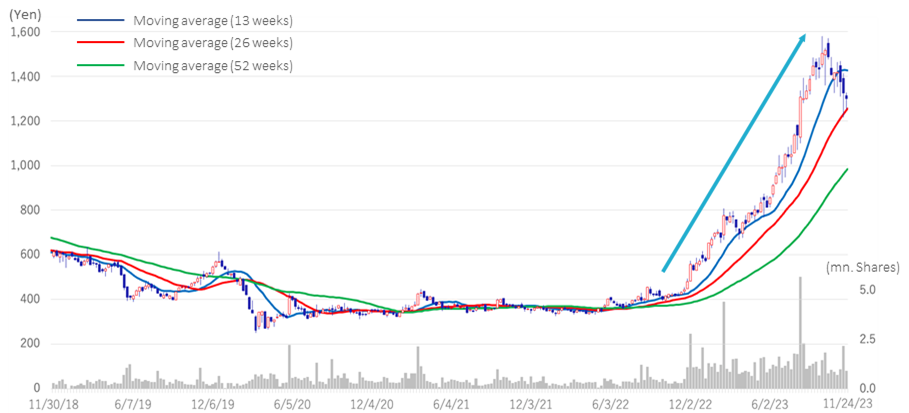
◇ Stock price: The stock price has shot up by 124% since the beginning of the year, although pausing at the moment.
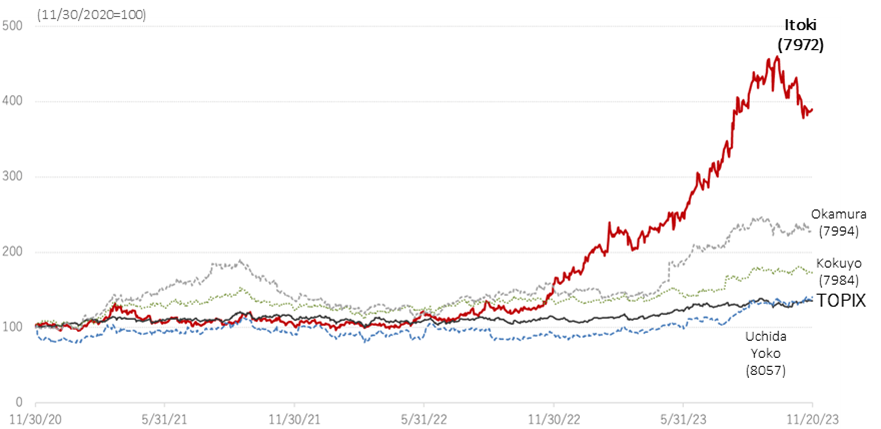
Over the past month, the company’s stock price declined by 7.4%, coming to a halt after a consistent rise since the summer of 2022. Nevertheless, the stock has advanced 124% YTD. The performance stands out, far outshining the 25%-54% increase in the peers’ stock prices and the 26% rise in TOPIX during the same period.
Going forward, we will closely monitor the company’s final financial results for the current fiscal year, its earnings forecast for the next fiscal year, and the new medium-term management plan forthcoming in 2H, which we will discuss below.
◇ Positive expectations for the forthcoming new medium-term management plan
FY12/2023 is the final year of the company’s medium-term management plan (2021-2023). The company is on track to achieve its initial targets of 133 billion yen in sales and 6 billion yen in operating profit. It designated the period from 2021 to 2023 as the “Structural Improvements Phase,” which will improve the earnings structure, and achieved significant improvements in operating profit margin etc. In its long-term vision, the company has defined 2024 to 2026 as the “High Monetization Phase”, enhancing its ability to achieve sustainable growth. The company plans to announce a new medium-term management plan with the FY12/2023 financial results announcement. We look forward to the next growth story under the leadership of President Minato and his management team.
| JPY, mn, % | Net sales |
YoY % |
Oper. profit |
YoY % |
Ord. profit |
YoY % |
Profit ATOP |
YoY % |
EPS (¥) |
DPS (¥) |
| 2020/12 | 116,210 | -4.9 | 1,798 | 99.1 | 1,881 | 99.0 | -235 | – | -5.18 | 13.00 |
| 2021/12 | 115,839 | -0.3 | 2,536 | 41.0 | 2,437 | 29.5 | 1,166 | – | 25.82 | 15.00 |
| 2022/12 | 123,324 | 6.4 | 4,582 | 79.0 | 4,177 | 71.4 | 5,294 | 353.9 | 116.99 | 37.00 |
| 2023/12 (CE) | 130,000 | 5.4 | 7,500 | 63.7 | 7,500 | 79.5 | 4,800 | -9.3 | 105.84 | 32.00 |
| 2022/12 3Q | 89,961 | 7.0 | 4,086 | 136.0 | 4,125 | 149.8 | 3,517 | 313.8 | 77.73 | – |
| 2023/12 3Q | 96,857 | 7.7 | 7,179 | 75.7 | 7,360 | 78.4 | 4,909 | 39.6 | 108.32 | – |
Sales/Operating profit(Quarterly)
◇ Results for 3Q FY12/2023: 8% increase in sales, record highs in both sales and operating profit
The company’s 3Q results for FY12/2023 (cumulative total) show sales of 96,857 million yen (+7.7% YoY), operating profit of 7,179 million yen (+75.7%) and net profit attributable to owner of parent 4,909 million yen (+39.6%). Both net sales and operating profit reached record highs on a cumulative 3Q basis.
In 3Q, the COGS ratio improved by 1.9 percentage points to 60.6% from 62.5% QoQ. The SGAE ratio fell by 1.0 percentage points from 33.0% to 32.0% QoQ, resulting in an operating margin of 7.4%, an improvement of 2.9 percentage points YoY.
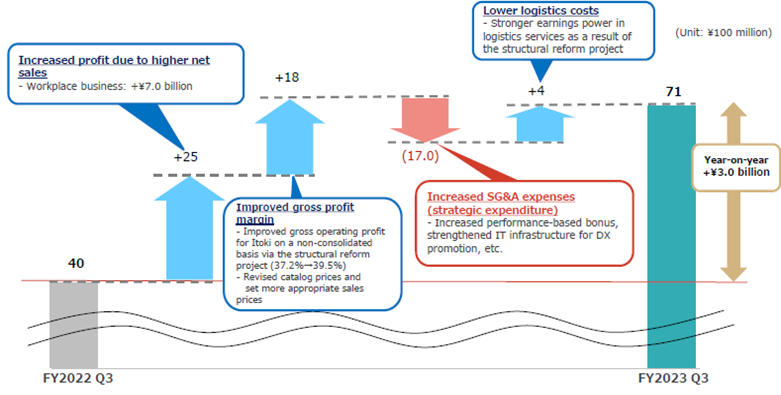
See the chart below for the factors behind the change in operating profit. The increase in profit (2.5 billion yen) due to higher sales, improved gross margin (1.8 billion yen) due to structural reform projects, and lower distribution costs (0.4 billion yen) offset the increase in SG&A expenses (1.7 billion yen) due to strategic spending, resulting in a significant increase in profit. The increase in SG&A expenses was mainly due to the reinforcement of IT infrastructure to promote DX and the allocation of performance-linked bonuses in 3Q, which had previously been bundled in December.
In the 3Q alone, net sales were 28,667 million yen (+9.4%), and operating profit was 177 million yen (vs. an operating loss of 285 million yen in the 3Q of FY2022). Normally, the company would have posted an operating loss due to a seasonal slump in sales during summer and the execution of expense budgets. It is noteworthy that the company delivered a profit in this 3Q.
Factor analysis of changes in operating profit
Source: The company materials for the 3Q results for FY12/2023 (published on November 13, 2023)
Workplace business (quarterly)
Source: Omega Investment from company materials
◇ Segment trends
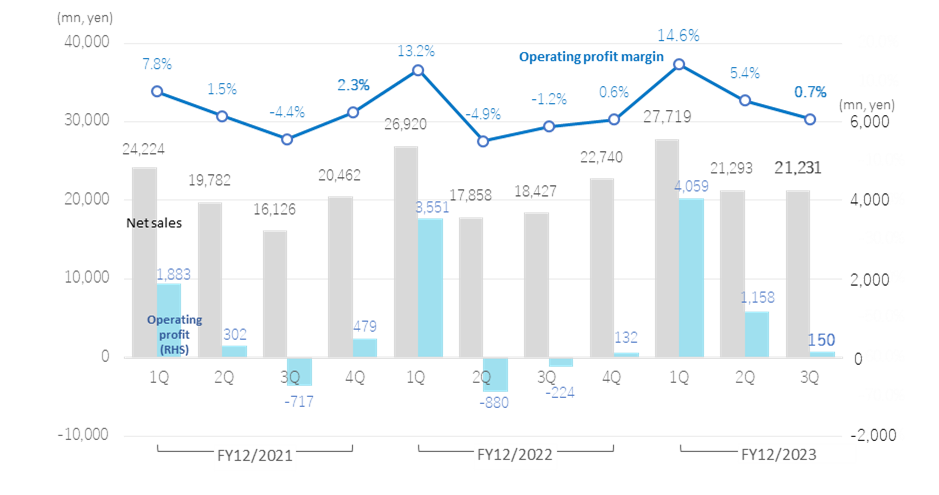
1) Workplace business: Sales: 70,243 million yen, +11.1% YoY; operating profit: 5,367 million, +119.3%.
Renewal projects increased in line with new hybrid ways of working after the onset of COVID-19. With labour shortages becoming a serious problem, there is a persistent need for office environments that can improve the quality of work to retain talented people. Sales of office furniture were also strong, mainly due to office relocations. On the other hand, the rise in raw material prices was absorbed by various cost-cutting efforts and price revisions commensurate with the increased customer value of the product offerings. Profit margins improved significantly (from 3.9% in 3Q FY12/2022 to 7.8% in 3Q FY12/2023), resulting in a significant profit increase.
The company posted sales of 21,231 million yen (+15.2%), an operating profit of 150 million yen (vs. an operating loss of 224 million yen in the same period previous year), and an operating profit margin of 0.7% in the 3Q alone. An operating profit in the 3Q is worth noting, as 3Q has tended to post losses in the past.
Equipment / Public business (quarterly)
Source: Omega Investment from company materials
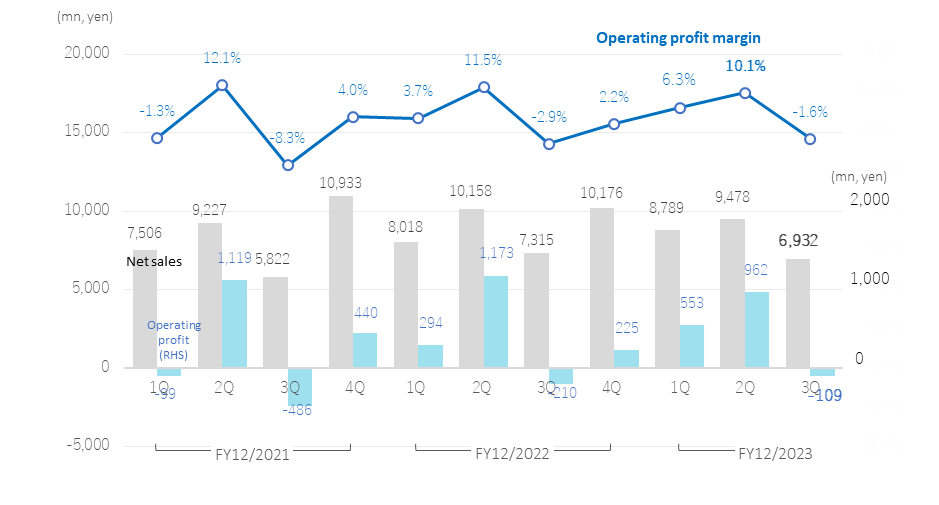
2) Equipment / Public business: Sales: 25,199 million yen, -1.1%; operating profit: 1,406 million yen, +11.8%.
Demand for display cases for museums and art galleries, digital signage, and other equipment for public facilities remained strong. Still, sales declined slightly in reaction to the large orders received for research facility equipment for science parks and other facilities in the same period of the previous fiscal year. Profitability improved due to enhanced customer value in public facility equipment such as the new “Artivista” display case.
In 3Q alone, sales declined 5.2% to 6,932 million yen, and operating profit improved to 109 million yen from a 210 million yen operating loss in the same period of last year.
◇ Full-year forecasts for FY12/2023: Progressing in line with the revised August forecast
Progress ratios at the end of 3Q vis-a-vis the revised full-year forecast at 2Q results announcement are 74% for net sales, 96% for operating profit and 102% for net profit attributable to owner of parent. In addition to continued solid inquiries for the Workplace business, the Office Equipment / Public business is expected to have a heavy second-half demand for logistics facilities, and demand for public facility equipment such as display cases for museums and art galleries and digital signage is expected to grow. Therefore, the company should comfortably achieve its full-year sales forecast. The company plans to strengthen human capital investment, focusing on future growth strategies, such as investments in education, office environment improvement, and other strategic investments, such as promoting digital transformation (DX) and facility enhancements. While anticipating increased costs, the ongoing effects of structural improvements are expected to continue until the first half of the year, and there is potential for positive earnings forecast revisions.
◇ Next medium-term management plan
FY12/2023 is the final year of the company’s medium-term management plan (2021-2023), “RISE ITOKI 2023. The company will likely achieve the initial target of 133 billion yen in net sales and has already met the 6 billion yen operating profit target as of 3Q. In its long-term vision, the company has designated 2021 to 2023 as the “Structural Improvements Phase,” as shown in the chart below, and has focused on building a profitable structure working to improve its earnings. The sales to date have tended to allow price competition to secure the top-line revenue, but the company has changed its mindset to secure the bottom-line profit. In addition, the company succeeded in increasing added value through proposal-based sales, etc. As a result, the company’s profitability, lagging behind its competitors, will average 3.9% from 2021 to 2023, improving from the average of 1.3% during 2018 and 2020. In 2023 alone, a significant improvement to 5.8%. The stellar performance of the company’s stock price is attributable to investors’ high regard for this progress.
The company is preparing its next medium-term management plan, which will be released with the announcement of FY12/2023 financial results. Having made progress in improving its earnings structure through the medium-term management plan up to 2023, the company intends to further grow and strengthen its earning power from 2024 to 2026 as the “High Monetization Phase”. We look forward to the next growth story under the leadership of President Minato and his management team.
Long-Term Vision and New Medium-Term Management Plan
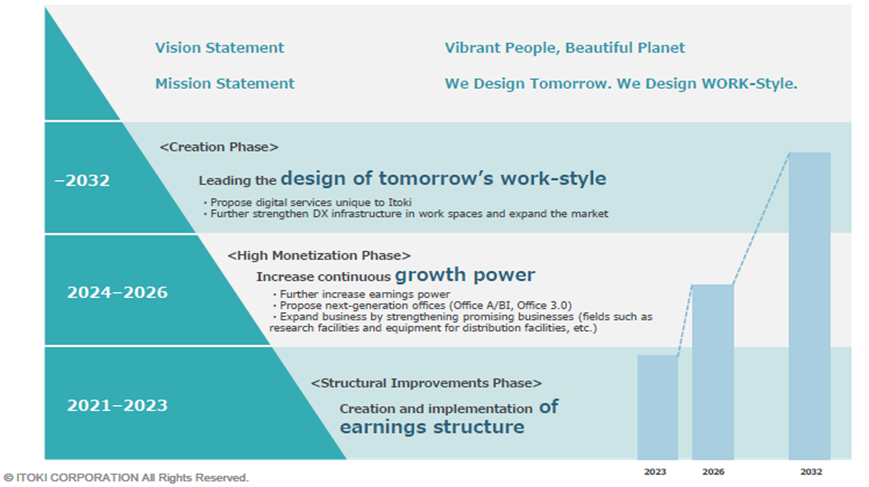
Source: The company materials for the 3Q results for FY12/2023 (published on November 13, 2023)
◇ Stock price: Strong performance, registering a 2.7x increase over the past year. PBR has recovered to 1x.
The stock price was down by 7.4% over the past month, a halt in performance after rising steadily since the summer of 2022, recording a one-year performance of 2.7x. Nevertheless, the stock is still up 124% YTD. The high performance of the company’s stock price stands out, as it is far ahead of the 25%-54% increase in the stock prices of its peers and the 26% rise in the TOPIX during the same period. The company’s PBR, which had been a concern of the management , has remained above 1.0 since August.
Although the stock price temporarily declined after the announcement of the 3Q results, the company’s earnings structure has been improving steadily, and office furniture demand, especially for renewal projects and office relocations, has been strong. In addition, the company plans to focus on further earnings growth in the Equipment / Public business, and the company’s earnings environment is good.
Going forward, we are interested in closely monitoring the company’s final results for the current fiscal year, earnings forecasts for the next fiscal year, and the forthcoming new medium-term management plan mentioned above.
7972:5-year stock price move
Four office furniture companies, TOPIX (past three years)
7972: Itoki PBR (LTM, past three years)
Financial data (quarterly basis)
FY (¥mn) |
2020/12 |
2021/12 |
2022/12 |
2023/12 |
|||||||||||
1Q |
2Q |
3Q |
4Q |
1Q |
2Q |
3Q |
4Q |
1Q |
2Q |
3Q |
4Q |
1Q |
2Q |
3Q |
|
[Statements of income] |
|||||||||||||||
Net sales |
37,707 |
26,997 |
21,489 |
30,017 |
32,167 |
29,468 |
22,412 |
31,858 |
35,345 |
28,411 |
26,205 |
33,363 |
36,965 |
31,225 |
28,667 |
Year-on-year basis (%) |
11.2 |
-9.3 |
-24.5 |
-0.1 |
-14.7 |
9.2 |
4.3 |
6.1 |
9.9 |
-3.6 |
16.9 |
4.7 |
4.6 |
9.9 |
9.4 |
Cost of sales |
23,710 |
17,765 |
13,811 |
19,036 |
20,101 |
18,729 |
14,443 |
20,872 |
21,483 |
18,030 |
16,678 |
21,384 |
22,216 |
18,954 |
17,483 |
Gross profit |
13,997 |
9,232 |
7,678 |
10,981 |
12,020 |
10,722 |
7,953 |
10,999 |
13,862 |
10,381 |
9,527 |
11,979 |
14,748 |
12,271 |
11,184 |
SG&A expenses |
10,996 |
9,602 |
9,590 |
9,901 |
10,352 |
9,453 |
9,203 |
10,150 |
9,898 |
9,973 |
9,812 |
11,484 |
9,970 |
10,047 |
11,006 |
Operating income |
3,001 |
-370 |
-1,912 |
1,079 |
1,698 |
1,275 |
-1,242 |
829 |
3,964 |
407 |
-285 |
496 |
4,777 |
2,225 |
177 |
Year-on-year basis (%) |
43.5 |
– |
– |
– |
-43.4 |
– |
– |
-23.2 |
133.4 |
-68.7 |
– |
-40.2 |
20.5 |
446.7 |
– |
Operating profit ratio (%) |
8.0 |
-1.4 |
-8.9 |
3.6 |
5.3 |
4.3 |
-5.5 |
2.6 |
11.2 |
1.4 |
-1.1 |
1.5 |
12.9 |
7.1 |
0.8 |
Non-operating income |
154 |
162 |
251 |
237 |
240 |
161 |
171 |
122 |
125 |
164 |
171 |
96 |
125 |
114 |
141 |
Non-operating expenses |
273 |
168 |
107 |
172 |
250 |
257 |
101 |
185 |
115 |
130 |
177 |
539 |
79 |
68 |
52 |
Ordinary income |
2,882 |
-376 |
-1,768 |
1,143 |
1,657 |
1,173 |
-1,179 |
786 |
3,974 |
442 |
-291 |
52 |
4,824 |
2,271 |
265 |
Extraordinary income |
0 |
6 |
125 |
980 |
1,255 |
78 |
133 |
88 |
786 |
139 |
118 |
6,762 |
1 |
15 |
120 |
Extraordinary expenses |
116 |
42 |
55 |
1,503 |
20 |
456 |
518 |
1,474 |
44 |
64 |
38 |
3,465 |
21 |
10 |
24 |
Income before income taxes |
2,766 |
-412 |
-1,697 |
620 |
2,893 |
795 |
-1,565 |
-600 |
4,716 |
516 |
-211 |
3,351 |
4,804 |
2,275 |
363 |
Total income taxes |
1,039 |
134 |
-195 |
654 |
1,028 |
490 |
-132 |
-796 |
1,381 |
246 |
-21 |
1,585 |
1,506 |
864 |
161 |
Net income |
1,760 |
-557 |
-1,491 |
53 |
1,942 |
348 |
-1,440 |
316 |
3,388 |
288 |
-159 |
1,777 |
3,296 |
1,411 |
202 |
Year-on-year basis (%) |
43.6 |
– |
– |
– |
10. |
– |
– |
496.2 |
74.4 |
-17.2 |
– |
462.3 |
-2.7 |
389.9 |
– |
Net income ratio (%) |
4.7 |
-2.1 |
-6.9 |
0.2 |
6.0 |
1.2 |
-6.4 |
1.0 |
9.6 |
1.0 |
-0.6 |
5.3 |
8.9 |
4.5 |
0.7 |
[Balance Sheets] |
|||||||||||||||
Current assets |
69,811 |
60,382 |
52,463 |
57,183 |
65,543 |
62,170 |
55,249 |
57,753 |
69,458 |
64,096 |
59,873 |
71,027 |
72,230 |
68,755 |
68,040 |
Cash and deposits |
18,186 |
21,312 |
18,956 |
18,246 |
19,503 |
22,112 |
18,213 |
17,351 |
19,196 |
20,073 |
17,138 |
26,876 |
20,898 |
24,688 |
23,192 |
Notes and accounts receivable
|
37,611 |
27,230 |
20,298 |
26,599 |
32,061 |
26,596 |
21,385 |
26,783 |
– |
– |
– |
– |
– |
– |
– |
Notes and accounts receivable
|
– |
– |
– |
– |
– |
– |
– |
– |
35,205 |
28,234 |
24,111 |
29,316 |
34,519 |
28,377 |
26,948 |
Non-current assets |
49,872 |
49,933 |
50,410 |
47,912 |
46,925 |
46,369 |
46,046 |
46,144 |
46,647 |
47,395 |
48,126 |
44,260 |
43,611 |
42,918 |
43,533 |
Property, plant and equipment |
27,612 |
27,350 |
27,329 |
26,206 |
25,184 |
24,779 |
24,887 |
24,417 |
25,105 |
26,042 |
26,932 |
24,978 |
24,689 |
24,952 |
24,730 |
Intangible assets |
5,113 |
5,623 |
5,853 |
5,590 |
5,504 |
5,419 |
4,885 |
4,114 |
4,128 |
4,168 |
4,145 |
1,819 |
1,837 |
1,884 |
2,161 |
Goodwill |
2,391 |
2,207 |
2,189 |
2,093 |
2,018 |
2,016 |
1,407 |
1,317 |
1,214 |
1,222 |
1,200 |
517 |
446 |
391 |
346 |
Investments and other assets |
17,146 |
16,959 |
17,227 |
16,116 |
16,236 |
16,170 |
16,273 |
17,612 |
17,413 |
17,184 |
17,048 |
17,462 |
17,084 |
16,080 |
16,641 |
Total assets |
120,352 |
110,940 |
103,453 |
105,096 |
112,469 |
108,540 |
101,295 |
103,898 |
116,105 |
111,492 |
108,000 |
115,288 |
115,841 |
111,693 |
111,573 |
Current liabilities |
55,449 |
46,097 |
40,198 |
43,646 |
49,245 |
45,266 |
40,307 |
42,544 |
51,837 |
47,138 |
43,655 |
49,099 |
47,854 |
42,547 |
42,010 |
Short-term borrowings |
15,616 |
13,289 |
14,239 |
13,234 |
13,458 |
12,061 |
12,409 |
12,500 |
15,014 |
11,976 |
11,738 |
11,239 |
10,874 |
10,299 |
10,383 |
Non-current liabilities |
18,327 |
18,220 |
18,079 |
17,259 |
17,506 |
17,088 |
16,257 |
16,277 |
16,334 |
16,020 |
16,178 |
16,278 |
16,238 |
15,727 |
15,724 |
Long-term borrowings |
9,475 |
9,574 |
9,453 |
8,508 |
8,711 |
8,193 |
7,435 |
7,591 |
7,427 |
7,174 |
7,266 |
7,530 |
7,453 |
7,062 |
6,959 |
Total liabilities |
73,777 |
64,318 |
58,277 |
60,906 |
66,751 |
62,354 |
56,565 |
58,822 |
68,172 |
63,158 |
59,833 |
65,377 |
64,092 |
58,275 |
57,734 |
Total net assets |
46,575 |
46,621 |
45,175 |
44,189 |
45,717 |
46,186 |
44,730 |
45,076 |
47,933 |
48,333 |
48,166 |
49,910 |
51,748 |
53,418 |
53,839 |
Shareholders’ equity |
45,479 |
45,390 |
43,786 |
43,691 |
45,047 |
45,419 |
43,979 |
44,301 |
47,249 |
47,567 |
47,408 |
49,185 |
50,806 |
52,267 |
52,469 |
Share capital |
5,294 |
5,294 |
5,294 |
5,294 |
5,294 |
5,294 |
5,294 |
5,294 |
5,294 |
5,294 |
5,294 |
5,294 |
5,294 |
5,294 |
5,294 |
Capital surplus |
9,201 |
9,642 |
9,641 |
9,628 |
9,628 |
9,632 |
9,632 |
9,638 |
9,638 |
9,638 |
9,638 |
9,638 |
9,638 |
9,665 |
9,665 |
Retained earnings |
31,030 |
30,461 |
28,884 |
28,950 |
30,306 |
30,654 |
29,213 |
29,530 |
32,477 |
32,769 |
32,610 |
34,387 |
36,008 |
37,419 |
37,621 |
Treasury shares |
-46 |
-6 |
-33 |
-182 |
-182 |
-161 |
-161 |
-161 |
-161 |
-134 |
-134 |
-134 |
-314 |
-111 |
-111 |
Share acquisition rights |
|
|
45 |
45 |
45 |
45 |
45 |
45 |
45 |
45 |
45 |
45 |
45 |
45 |
45 |
Total liabilities and net assets |
120,352 |
110,940 |
103,453 |
105,096 |
112,469 |
108,540 |
101,295 |
103,898 |
116,105 |
111,492 |
108,000 |
115,288 |
115,841 |
111,693 |
111,573 |
[Statements of cash flows] |
|||||||||||||||
Cash flow from operating activities |
5,404 |
|
-843 |
|
4,577 |
|
-1,803 |
|
4,581 |
|
1,223 |
4,078 |
|||
Cash flow from investing activities |
-1,442 |
|
290 |
|
503 |
|
-1,673 |
|
-1,410 |
|
6,333 |
-3,265 |
|||
Cash flow from financing activities |
|
293 |
|
-2,560 |
|
-1,418 |
|
-1,240 |
|
-661 |
|
-765 |
-3,266 |
||
Free cash flow |
3,962 |
|
-553 |
|
5,080 |
|
-3,476 |
|
3,171 |
|
7,556 |
813 |
|||
Net increase in cash and cash equiv. |
4,240 |
|
-3,037 |
|
3,787 |
|
-4,687 |
|
2,630 |
|
6,911 |
-2,466 |
|||
Cash and cash equiv. at beginning of period |
15,494 |
|
19,735 |
|
16,697 |
|
20,485 |
|
15,797 |
|
18,509 |
25,420 |
|||
Cash and cash equiv. at end of period |
19,735 |
|
16,697 |
|
20,485 |
|
15,797 |
|
18,509 |
|
25,420 |
22,953 |
|||
Source: Omega Investment from company materials
Financial data (full-year basis)
FY (¥mn) |
FY2012/12 |
FY2013/12 |
FY2014/12 |
FY2015/12 |
FY2016/12 |
FY2017/12 |
FY2018/12 |
FY2019/12 |
FY2020/12 |
FY2021/12 |
FY2022/12 |
[Statements of income] |
|||||||||||
Net sales |
105,508 |
103,461 |
102,993 |
106,516 |
101,684 |
108,684 |
118,700 |
122,174 |
116,210 |
115,839 |
123,324 |
Year-on-year basis (%) |
14.6 |
-1.9 |
-0.5 |
3.4 |
-4.5 |
6.9 |
9.2 |
2.9 |
-4.9 |
-0.3 |
6.4 |
Cost of sales |
70,027 |
67,118 |
66,797 |
68,374 |
65,021 |
69,966 |
77,436 |
80,495 |
74,322 |
74,145 |
77,575 |
Gross profit |
35,481 |
36,343 |
36,196 |
38,142 |
36,663 |
38,718 |
41,264 |
41,679 |
41,888 |
41,694 |
45,749 |
Gross profit ratio (%) |
33.6 |
35.1 |
35.1 |
35.8 |
36.1 |
35.6 |
34.8 |
34.1 |
36.0 |
36.0 |
37.1 |
SG&A expenses |
32,040 |
32,203 |
33,723 |
33,836 |
33,862 |
35,761 |
39,339 |
40,776 |
40,089 |
39,158 |
41,167 |
Operating income |
3,441 |
4,140 |
2,472 |
4,306 |
2,800 |
2,956 |
1,925 |
903 |
1,798 |
2,536 |
4,582 |
Operating profit ratio (%) |
3.3 |
4.0 |
2.4 |
4.0 |
2.8 |
2.7 |
1.6 |
0.7 |
1.5 |
2.2 |
3.7 |
Non-operating income |
813 |
813 |
841 |
898 |
771 |
750 |
889 |
677 |
804 |
694 |
556 |
Non-operating expenses |
518 |
528 |
495 |
605 |
483 |
412 |
448 |
634 |
720 |
793 |
961 |
Ordinary income |
3,735 |
4,425 |
2,818 |
4,599 |
3,087 |
3,295 |
2,365 |
945 |
1,881 |
2,437 |
4,177 |
Extraordinary income |
269 |
685 |
615 |
171 |
97 |
228 |
919 |
27 |
1,111 |
1,554 |
7,805 |
Extraordinary expenses |
352 |
238 |
262 |
524 |
267 |
121 |
204 |
35 |
1,716 |
2,468 |
3,611 |
Income before income taxes |
3,653 |
4,872 |
3,171 |
4,246 |
2,918 |
3,401 |
3,081 |
938 |
1,277 |
1,523 |
8,372 |
Total income taxes |
689 |
876 |
813 |
-385 |
1,068 |
959 |
1,339 |
1,517 |
1,632 |
590 |
3,191 |
Net income |
2,702 |
3,910 |
2,160 |
4,530 |
1,907 |
2,402 |
1,722 |
-550 |
-235 |
1,166 |
5,294 |
Net income ratio (%) |
2.6 |
3.8 |
2.1 |
4.3 |
1.9 |
2.2 |
1.5 |
-0.5 |
-0.2 |
1.0 |
4.3 |
[Balance Sheets] |
|||||||||||
Current assets |
49,294 |
52,925 |
55,714 |
56,342 |
52,410 |
58,147 |
62,143 |
58,109 |
57,183 |
57,753 |
71,027 |
Cash and deposits |
17,441 |
19,553 |
21,211 |
21,456 |
19,839 |
19,977 |
16,229 |
17,030 |
18,246 |
17,351 |
26,876 |
Notes and accounts receivable
|
24,935 |
26,243 |
25,965 |
26,138 |
23,241 |
26,869 |
33,160 |
28,244 |
26,599 |
26,783 |
|
Notes and accounts receivable
|
29,316 |
||||||||||
Non-current assets |
39,961 |
42,335 |
41,007 |
41,832 |
43,271 |
44,073 |
46,559 |
49,955 |
47,912 |
46,144 |
44,260 |
Property, plant and equipment |
27,928 |
28,193 |
27,041 |
26,395 |
25,322 |
24,426 |
26,362 |
27,781 |
26,206 |
24,417 |
24,978 |
Intangible assets |
705 |
1,230 |
1,109 |
1,313 |
1,142 |
3,651 |
4,437 |
4,945 |
5,590 |
4,114 |
1,819 |
Goodwill |
6 |
34 |
26 |
240 |
208 |
2,793 |
3,005 |
2,413 |
2,093 |
1,317 |
517 |
Investments and other assets |
11,327 |
12,911 |
12,857 |
14,123 |
16,806 |
15,995 |
15,760 |
17,229 |
16,116 |
17,612 |
17,462 |
Total assets |
89,256 |
95,261 |
96,721 |
98,175 |
95,681 |
102,221 |
108,703 |
108,778 |
105,096 |
103,898 |
115,288 |
Current liabilities |
36,455 |
35,359 |
36,677 |
36,106 |
35,390 |
39,683 |
45,133 |
47,559 |
43,646 |
42,544 |
49,099 |
Short-term borrowings |
11,222 |
11,473 |
11,087 |
10,940 |
11,760 |
12,564 |
11,721 |
15,533 |
13,234 |
12,500 |
11,239 |
Non-current liabilities |
14,560 |
16,874 |
16,854 |
14,756 |
14,888 |
15,211 |
16,076 |
15,385 |
17,259 |
16,277 |
16,278 |
Long-term borrowings |
4,122 |
5,124 |
5,089 |
5,171 |
5,296 |
5,328 |
5,113 |
6,633 |
8,508 |
7,591 |
7,530 |
Total liabilities |
51,016 |
52,234 |
53,532 |
50,863 |
50,278 |
54,894 |
61,210 |
62,944 |
60,906 |
58,822 |
65,377 |
Total net assets |
38,240 |
43,026 |
43,189 |
47,311 |
45,402 |
47,326 |
47,492 |
45,834 |
44,189 |
45,076 |
49,910 |
Shareholders’ equity |
35,960 |
41,079 |
41,632 |
45,677 |
44,949 |
46,863 |
46,854 |
45,370 |
43,812 |
44,931 |
49,871 |
Share capital |
5,277 |
5,277 |
5,277 |
5,277 |
5,277 |
5,277 |
5,277 |
5,294 |
5,294 |
5,294 |
5,294 |
Capital surplus |
13,020 |
13,061 |
13,061 |
13,222 |
13,140 |
12,404 |
9,786 |
9,201 |
9,628 |
9,638 |
9,638 |
Retained earnings |
18,520 |
22,073 |
23,556 |
29,223 |
30,504 |
32,315 |
31,104 |
29,862 |
28,950 |
29,530 |
34,387 |
Treasury shares |
-1,178 |
-833 |
-834 |
-3,000 |
-4,700 |
-4,701 |
0 |
-46 |
-182 |
-161 |
-134 |
Share acquisition rights |
|
|
|
|
|
|
|
|
45 |
45 |
45 |
Total liabilities and net assets |
89,256 |
95,261 |
96,721 |
98,175 |
95,681 |
102,221 |
108,703 |
108,778 |
105,096 |
103,898 |
115,288 |
[Statements of cash flows] |
|||||||||||
Cash flow from operating activities |
8,259 |
3,162 |
5,715 |
4,522 |
5,072 |
3,565 |
1,384 |
3,586 |
4,561 |
2,774 |
5,804 |
Cash flow from investing activities |
-14 |
-1,978 |
-1,742 |
-803 |
-4,044 |
-2,971 |
-3,094 |
-3,221 |
-1,152 |
-1,170 |
4,923 |
Cash flow from financing activities |
-1,652 |
51 |
-2,179 |
-3,807 |
-2,571 |
-706 |
-2,463 |
0 |
-2,267 |
-2,658 |
-1,426 |
Free cash flow |
8,245 |
1,184 |
3,973 |
3,719 |
1,028 |
594 |
-1,710 |
365 |
3,409 |
1,604 |
10,727 |
Net increase in cash and cash equiv. |
6,601 |
1,944 |
1,814 |
184 |
-1,619 |
88 |
-4,031 |
952 |
1,203 |
-900 |
9,622 |
Cash and cash equiv. at beginning of period |
9,555 |
16,156 |
18,102 |
19,918 |
20,103 |
18,483 |
18,571 |
14,540 |
15,494 |
16,697 |
15,797 |
Cash and cash equiv. at end of period |
16,156 |
18,102 |
19,918 |
20,103 |
18,483 |
18,571 |
14,540 |
15,494 |
16,697 |
15,797 |
25,420 |
Source: Omega Investment from company materials