2026-07-27
Home
Japanese

Omega Investment Co., Ltd.
Cosmo Bio (Company note – 3Q update)

| Share price (12/7) | ¥969 | Dividend Yield (23/12 CE) | 3.10 % |
| 52weeks high/low | ¥1,028/937 | ROE(TTM) | 5.23 % |
| Avg Vol (3 month) | 4,960 thou shrs | Operating margin (TTM) | 6.02 % |
| Market Cap | ¥5.8 bn | Beta (5Y Monthly) | 0.51 |
| Enterprise Value | ¥2.6 bn | Shares Outstanding | 6.048 mn shrs |
| PER (23/12 CE) | 12.55 X | Listed market | TSE Standard |
| PBR (22/12 act) | 0.67 X |
| Click here for the PDF version of this page |
| PDF Version |
Sales and profits declined, continuing from 2Q, affected by the weak yen. Research reagent sales to trend upwards in the near term.
◇ Summary of 3Q results for FY12/2023: Sales and profits declined, affected by the weak yen.
FY12/2023 3Q results of Cosmo Bio showed a 3.5% YoY decline in sales and a 36.4% decline in operating profit. 3Q sales of research reagents show a recovery trend, but the drop in sales from 1Q to 2Q weighed on the cumulative 9-month results. The business was significantly affected by the foreign exchange rate move due to the nature of the business as an import trading company, as well as an increase in SG&A expenses, resulting in a continued decline in profits from 2Q. The weak yen is expected to continue for some time, so the company continues its cost-cutting efforts. As a new initiative, it announced the launch of a contract service matching website, Scientist3.
The share price has been below 1,000 yen since February this year. The yen is expected to remain weak for the time being, and the company will likely undergo a difficult period in terms of profitability. On the other hand, sales activities have returned to pre-pandemic levels following the downgrade of COVID-19 to Category 5. Hence, a gradual recovery in sales can be expected. In addition, some of the selling price changes implemented in response to rising procurement costs appear to penetrate. The share price should reflect the improvement in profitability due to these measures. PBR below 1x is also a matter of management concern, and we are interested in keeping a close eye on how the company will move.
◇ Results for 3Q FY12/2023
The 3Q results for FY12/2023 show sales of 6,877 million yen (-3.5% YoY), operating profit of 447 million yen (-36.4% YoY) and quarterly profit attributable to owner of parent of 366 million yen (-19.4% YoY).
In terms of sales, on top of the high sales in the same period of the previous year, the growth of the Drug Discovery and Contract Services segment, which requires a long time for the results of sales activities to bear fruit, was affected by COVID-19 in the first half of the year. There were also delays in introducing new technologies from overseas. However, as a result of countermeasures, sales of research reagents have been recovering since the beginning of 3Q.
By product, sales of Research reagents, Equipment and Clinical diagnostic reagents decreased to 5,421 million yen (-2.0%), 1,413 million yen (-6.6%), 43 million yen (-48.8%) YoY, respectively. As mentioned above, the main reason was the delay in developing new products and customers due to the inability to conduct sufficient sales activities during the COVID-19 expansion. On the other hand, sales of contract services and consumables other than reagent sales continued to decline, which was a major factor in the latest decline in sales. Sales of consumables, which are included in Equipment, were sluggish due to the inventory hangover of the customers.
| JPY, mn, % | Net sales |
YoY % |
Oper. profit |
YoY % |
Ord. profit |
YoY % |
Profit ATOP |
YoY % |
EPS (¥) |
DPS (¥) |
| 2019/12 | 7,590 | 4.5 | 405 | 23.5 | 470 | 16.5 | 237 | -8.6 | 40.14 | 14.00 |
| 2020/12 | 8,092 | 6.6 | 752 | 85.6 | 817 | 73.7 | 674 | 183.2 | 113.70 | 34.00 |
| 2021/12 | 9,231 | 14.1 | 1,048 | 39.4 | 1,099 | 34.5 | 737 | 9.4 | 126.94 | 36.00 |
| 2022/12 | 9,553 | 3.5 | 816 | -22.2 | 790 | -28.1 | 517 | -29.8 | 89.13 | 36.00 |
| 2023/12 (CE) | 9,800 | 2.6 | 600 | -26.5 | 660 | -16.5 | 450 | 13.0 | 77.41 | 30.00 |
| 2022/12 3Q | 7,127 | 3.6 | 703 | -21.5 | 690 | -26.4 | 454 | -26.3 | 78.21 | 0.00 |
| 2023/12 3Q | 6,877 | -3.5 | 447 | -36.4 | 554 | -19.6 | 366 | -19.4 | 62.84 | 0.00 |
Sales and operating profit (quarterly)
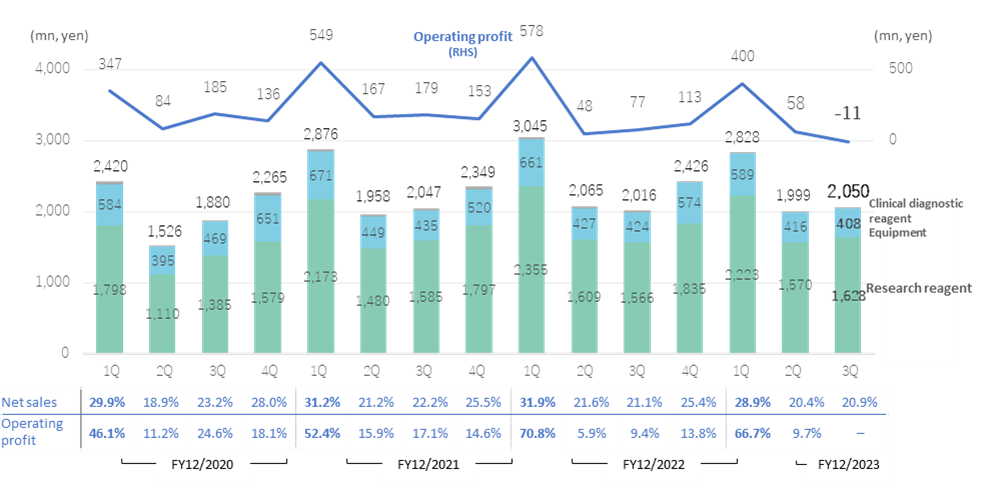
Note: Clinical diagnostics reagent sales are insignificant, and figures have not been shown. The table at the bottom shows the composition of the quarterly record to the full-year figures; The figures for FY12/2023 are a progress ratio to the full-year forecast.
Source: Omega Investment from company materials
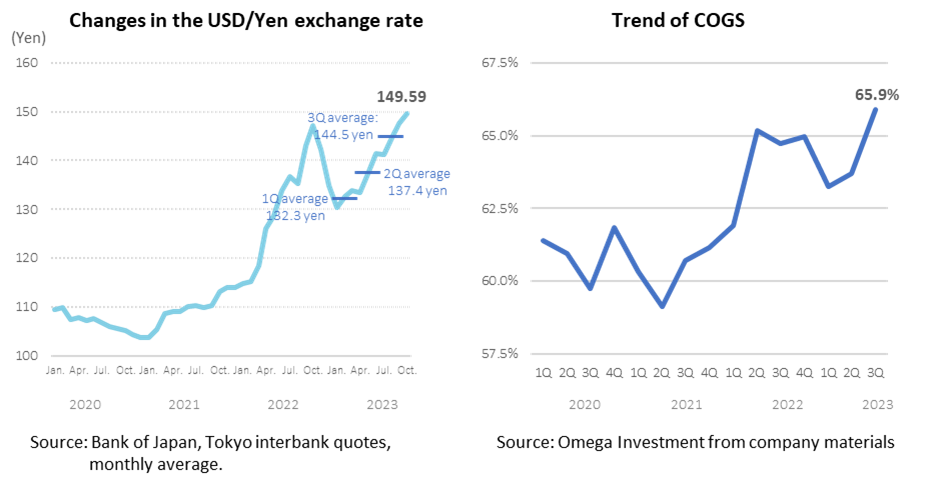
Analysis of changes in 3Q operating profit has not been published. However, given that the exchange rate impact accounted for 177 million yen of the YoY OP decrease of 168 million yen in 2Q, and considering the average exchange rate depreciated to 145 yen in 3Q (the third quarter only, Bank of Japan data, see chart below left) from 135 yen in the first half, the exchange rate move is assumed to have had a significant impact. Looking at the company’s purchases by currency, the US dollar accounts for just under 60% of purchases, the EUR for just under 10%, and only around 1/3 are settled in Japanese yen. Thus, currency movements directly affect the company’s COGS ratio. The exchange rate in 1Q-3Q previous year was 128 yen to the US dollar, but in 1Q-3Q 2023, it was 138 yen, a depreciation of 10 yen (see chart below left, based on the Bank of Japan’s rate).
Although the company has mitigated the risk of exchange rate fluctuations to some extent by using forward exchange rate contracts, the impact on earnings is still significant. The company is assuming an exchange rate of 140 yen for the year’s second half. However, considering that the average exchange rate for the third quarter only was already 145 yen (based on the Bank of Japan rate), the impact on profits is likely to be even greater. In response to the weak yen (i.e. deterioration in COGS ratio due to higher import costs), the company has been gradually raising prices on some products (by several to 20% depending on the product) since last autumn, which has begun to have an effect. Still, the company believes that the market environment and price competition with other companies in the industry will remain harsh.
SG&A expenses were 2,017 million yen, up 6.8% YoY, and the SGAE ratio rose 2.8 percentage points YoY to 29.3%. The company has been recruiting talented people in line with its long-term growth strategy, and the increase in personnel costs weighs heavily.
Looking at 3Q alone, sales increased by 1.7% to 2,050 million yen, reversing the decline in 1Q and 2Q (see also table on p. 5). By product line, sales of Research reagents were 1,628 million yen (+4.0%), Equipment 408 million yen (-3.8%) and Clinical diagnostic reagents 15 million yen (-42.3%), with Research reagent sales recording YoY growth due to the effect of price revisions and the resumption of sales activities after COVID-19. The company posted an operating loss of 11 million yen, with the average exchange rate for July-September at 144.5 yen against the dollar, a more significant swing to a weaker yen than the 132.3 yen in 1Q and 137.4 yen in 2Q, which had a considerable impact on costs (see previous page, based on the Bank of Japan’s rate). As a result, the COGS ratio worsened by 2 percentage points from 1H to 3Q, from 63.3% in 1Q to 63.7% in 2Q to 65.9% in 3Q, and, on top of that, the increase in SGAE is considered to be the reason for the operating loss (see previous page, bottom right-hand diagram).
In the BS, current assets at the end of September 2023 increased by 297 million yen compared to the end of the previous year. Cash and deposits increased by 402 million yen, while trade receivables decreased. Investment securities increased by 190 million, and non-current assets increased by 164 million yen to 3,340 million yen, bringing total assets to 10,773 million yen (up 460 million yen). As for liabilities and equity, total liabilities increased to 1,773 million yen (up 78 million yen) due to an increase in long-term liabilities. At the end of September 2023, the equity ratio was 78.2%, an improvement of 0.1 percentage points YoY. The company is virtually debt-free, has ample cash and a high equity ratio, and has sound financial health.
◇ Forecast for FY12/2023: No change from initial forecasts
The company’s forecasts for FY12/2023 were 9.8 billion yen (+2.6%) for net sales, 0.6 billion yen (-26.5%) for operating profit, 0.66 billion yen (-16.5%) for ordinary profit and 0.45 billion yen (-13.0%) for net profit attributable to owners of parent company, and as of the end of 3Q there were no changes. At the end of 3Q, the progress ratios against the full-year forecasts were 70.2%, 74.5%, 83.9% and 81.3%, respectively. Considering that the company’s results are heavily biased towards the 1Q, further sales and operating profit increases must be delivered to meet the forecasts.
The company has not changed its dividend policy: interim dividend of 14 yen a share (16 yen in 1H of last year) and 2H dividend of 16 yen (20 yen in the previous year), for a total dividend of 30 yen (36 yen last year). The dividend payout ratio for the current financial year is expected to be 38.8%, which will be lower than that of the previous year.
◇Topics/future initiatives
▷ “Scientist3”: On 30 October, the company announced the launch of “Scientist3“, a matching website for contract services for life science researchers, from spring 2024. “Scientist3” is a matching service platform specializing in life science research, a system that matches domestic and foreign suppliers of contract services with domestic researchers who use those contract services. Researchers can make inquiries, place orders, deliver and pay for contract services they are interested in, all online. The company has set ‘Contribute to the advancement of life science’ as the group’s objective in its new three-year plan from 2023, and this service is in line with this mission. It is the first platform service of its kind in Japan and is attracting attention as a new attempt in the research reagent industry, where face-to-face sales have traditionally been the mainstay.
▷ Expanding overseas operations: The company has also identified expanding its overseas operations, including its export business, as one of the group’s long-term strategies in its new three-year plan. It intends to increase its overseas sales, which currently stand at around 10%. Globally, the US is the leading country in the bio-industry; therefore, the US reagent industry is also led by US reagent companies. As a result, foreign exchange rates heavily influence the company’s earnings during periods of yen depreciation, such as now. The company has seen delays in its overseas expansion due to the curtailment of activities and self-restraint following the outbreak of COVID-19 but intends to strengthen its export business further. By strengthening the export business, the company plans to expand sales and shift to an earnings structure less susceptible to the effects of foreign exchange rates.
◇ Share price outlook: Expectations for earnings recovery in 4Q
The company’s share price has been below 1,000 yen for a long time since February this year. The yen is expected to remain weak for some time, given the interest rate differential between Japan and the US and the policies of the monetary authorities, and the company is forecasting lower profits for the full year as well, so there may be a lack of positive expectations on the shares’ near-term performance. However, the fact that sales of research reagents are improving in 3Q is positive news, and if the company can mitigate the impact of foreign exchange rates to some extent by further controlling costs, these should positively affect the share price. The company’s PBR below 1x is also a matter of the management’s concern, and we are interested to see how they respond to this.
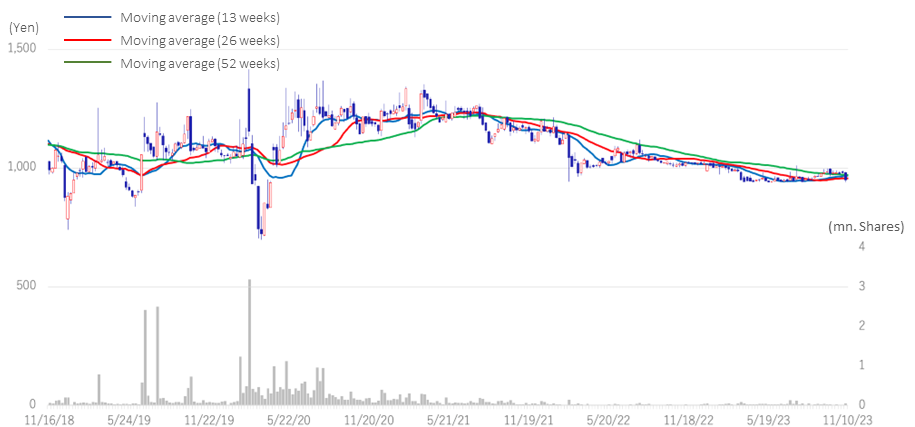
3386: 5-year stock price move
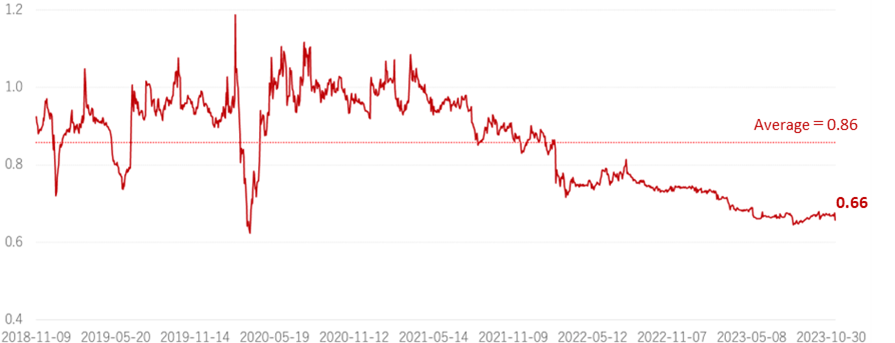
Historical PBR (LTM, last five years)
Financial data I (quarterly)
2020/12 |
2021/12 |
2022/12 |
2023/12 |
||||||||||||
1Q |
2Q |
3Q |
4Q |
1Q |
2Q |
3Q |
4Q |
1Q |
2Q |
3Q |
4Q |
1Q |
2Q |
3Q |
|
[Statements of income] |
|||||||||||||||
Net sales |
2,420 |
1,526 |
1,880 |
2,266 |
2,878 |
1,957 |
2,046 |
2,350 |
3,047 |
2,064 |
2,016 |
2,426 |
2,828 |
1,999 |
2,050 |
Year-on-year basis |
12.7% |
-7.3% |
4.4% |
13.6% |
18.9% |
28.2% |
8.8% |
3.7% |
5.9% |
5.5% |
-1.5% |
3.2% |
-7.2% |
-3.1% |
1.7% |
Research reagent |
1,798 |
1,110 |
1,385 |
1,579 |
2,173 |
1,480 |
1,585 |
1,797 |
2,355 |
1,609 |
1,566 |
1,835 |
2,223 |
1,570 |
1,628 |
Equipment |
584 |
395 |
469 |
651 |
671 |
449 |
435 |
520 |
661 |
427 |
424 |
574 |
589 |
416 |
408 |
Clinical diagnostic reagent |
37 |
21 |
26 |
35 |
32 |
29 |
27 |
32 |
29 |
29 |
26 |
17 |
16 |
12 |
15 |
Cost of sales |
1,486 |
930 |
1,123 |
1,401 |
1,736 |
1,157 |
1,242 |
1,437 |
1,886 |
1,345 |
1,305 |
1,576 |
1,789 |
1,273 |
1,350 |
Gross profit |
934 |
595 |
757 |
866 |
1,142 |
800 |
803 |
913 |
1,160 |
719 |
712 |
849 |
1,039 |
726 |
699 |
Gross profit margin |
38.6% |
39.0% |
40.3% |
38.2% |
39.7% |
40.9% |
39.2% |
38.9% |
38.1% |
34.8% |
35.3% |
35.0% |
36.7% |
36.3% |
34.1% |
SG&A expenses |
586 |
512 |
572 |
729 |
593 |
632 |
625 |
759 |
581 |
672 |
635 |
736 |
638 |
668 |
711 |
Operating profit |
347 |
84 |
185 |
136 |
549 |
167 |
179 |
153 |
578 |
48 |
77 |
113 |
400 |
58 |
-11 |
Year-on-year basis |
53.5% |
460.0% |
62.3% |
172.0% |
58.2% |
98.8% |
-3.2% |
12.5% |
5.3% |
-71.3% |
-57.0% |
-26.1% |
-30.7% |
20.8% |
– |
Operating profit margin |
14.3% |
5.5% |
9.8% |
6.0% |
19.1% |
8.5% |
8.7% |
6.5% |
19.0% |
2.3% |
3.8% |
4.7% |
14.1% |
2.9% |
– |
Non-operating profit |
8 |
43 |
9 |
11 |
7 |
42 |
9 |
13 |
6 |
27 |
11 |
13 |
16 |
85 |
16 |
Non-operating expenses |
0 |
0 |
0 |
6 |
22 |
-8 |
2 |
4 |
20 |
19 |
18 |
26 |
0 |
0 |
0 |
Ordinary Profit |
355 |
127 |
194 |
141 |
534 |
218 |
185 |
162 |
565 |
55 |
70 |
100 |
416 |
136 |
2 |
Extraordinary profit |
– |
– |
0 |
0 |
– |
– |
– |
– |
– |
– |
– |
– |
– |
– |
– |
Extraordinary expenses |
– |
– |
0 |
0 |
– |
– |
– |
– |
– |
– |
– |
– |
– |
– |
– |
Income before income taxes |
355 |
318 |
194 |
141 |
534 |
218 |
185 |
162 |
565 |
55 |
70 |
100 |
416 |
136 |
2 |
Total income taxes |
114 |
98 |
60 |
35 |
184 |
55 |
58 |
34 |
179 |
15 |
19 |
25 |
137 |
37 |
2 |
Net profit |
232 |
218 |
125 |
99 |
333 |
157 |
125 |
122 |
366 |
41 |
47 |
63 |
264 |
97 |
5 |
Year-on-year basis |
57.8% |
581.3% |
56.3% |
-550.0% |
43.5% |
-28.0% |
0.0% |
23.2% |
9.9% |
-73.9% |
-62.4% |
-48.4% |
-27.8% |
136.6% |
-89.4% |
Net profit ratio |
9.6% |
14.3% |
6.6% |
4.4% |
11.6% |
8.0% |
6.1% |
5.2% |
12.0% |
2.0% |
2.3% |
2.6% |
9.3% |
4.9% |
0.2% |
[Balance Sheets] |
|||||||||||||||
Current assets |
6,315 |
6,300 |
6,383 |
6,756 |
6,975 |
6,797 |
6,983 |
7,310 |
7,754 |
7,409 |
7,089 |
7,136 |
7,558 |
7,570 |
7,433 |
cash and deposits |
2,407 |
3,171 |
3,251 |
3,159 |
2,702 |
3,235 |
3,147 |
3,255 |
2,994 |
3,370 |
3,347 |
3,036 |
2,926 |
3,752 |
3,438 |
Accounts receivable |
2,911 |
2,033 |
2,188 |
2,784 |
3,262 |
2,431 |
2,434 |
2,714 |
3,390 |
2,567 |
2,436 |
2,799 |
3,332 |
2,488 |
2,485 |
Goods and products |
721 |
861 |
804 |
572 |
551 |
742 |
804 |
805 |
900 |
1,054 |
1,077 |
1,055 |
981 |
1,005 |
1,061 |
Non-current assets |
2,980 |
3,003 |
3,039 |
2,883 |
2,957 |
2,838 |
2,789 |
2,761 |
2,801 |
2,905 |
3,009 |
3,176 |
3,136 |
3,281 |
3,340 |
Property, plant and equipment |
689 |
673 |
649 |
636 |
624 |
606 |
593 |
599 |
591 |
586 |
583 |
577 |
578 |
566 |
568 |
Investments and other assets |
2,101 |
2,157 |
2,224 |
2,081 |
2,168 |
2,037 |
1,998 |
1,979 |
2,038 |
2,149 |
2,269 |
2,428 |
2,391 |
2,550 |
2,615 |
Total assets |
9,295 |
9,304 |
9,422 |
9,640 |
9,933 |
9,635 |
9,773 |
10,072 |
10,556 |
10,315 |
10,098 |
10,313 |
10,695 |
10,852 |
10,773 |
Current liabilities |
1,158 |
976 |
1,057 |
1,226 |
1,327 |
1,015 |
915 |
1,093 |
1,450 |
1,131 |
927 |
1,038 |
1,203 |
1,037 |
1,042 |
Short-term borrowings |
142 |
199 |
199 |
180 |
180 |
190 |
199 |
183 |
183 |
188 |
188 |
184 |
20 |
20 |
|
Non-current liabilities |
600 |
593 |
570 |
552 |
609 |
597 |
654 |
658 |
632 |
632 |
639 |
656 |
663 |
726 |
731 |
Total liabilities |
1,758 |
1,569 |
1,628 |
1,779 |
1,937 |
1,613 |
1,570 |
1,752 |
2,083 |
1,763 |
1,566 |
1,695 |
1,866 |
1,763 |
1,773 |
Total net assets |
7,537 |
7,734 |
7,794 |
7,861 |
7,996 |
8,022 |
8,203 |
8,319 |
8,473 |
8,552 |
8,531 |
8,617 |
8,828 |
9,088 |
9,000 |
Shareholders’ equity |
7,052 |
7,247 |
7,299 |
7,358 |
7,479 |
7,499 |
7,678 |
7,787 |
7,924 |
8,004 |
7,979 |
8,052 |
8,250 |
7,789 |
8,426 |
Share capital |
918 |
918 |
918 |
918 |
918 |
918 |
918 |
918 |
918 |
918 |
918 |
918 |
918 |
918 |
918 |
Capital surplus |
1,251 |
1,251 |
1,251 |
1,251 |
1,251 |
1,252 |
1,258 |
1,258 |
1,258 |
1,260 |
1,260 |
1,260 |
1,260 |
1,261 |
1,261 |
Retained earnings |
4,366 |
4,584 |
4,662 |
4,761 |
4,940 |
5,097 |
5,153 |
5,274 |
5,502 |
5,543 |
5,496 |
5,560 |
5,708 |
5,805 |
5,728 |
Treasury shares |
-67 |
-67 |
-67 |
-67 |
-207 |
-251 |
-239 |
-239 |
-239 |
-216 |
-216 |
-216 |
-216 |
-194 |
-194 |
Accumulated other comprehensive income |
582 |
560 |
533 |
494 |
575 |
483 |
586 |
574 |
484 |
498 |
520 |
530 |
580 |
719 |
712 |
Non-controlling interests |
485 |
487 |
495 |
503 |
517 |
523 |
525 |
532 |
549 |
548 |
552 |
565 |
578 |
579 |
574 |
Total liabilities and net assets |
9,295 |
9,304 |
9,422 |
9,640 |
9,933 |
9,635 |
9,773 |
10,072 |
10,556 |
10,315 |
10,098 |
10,313 |
10,695 |
10,852 |
10,773 |
Shareholders’ equity ratio |
75.9% |
77.9% |
77.5% |
76.3% |
75.3% |
77.8% |
78.6% |
77.3% |
75.1% |
77.6% |
79.0% |
78.1% |
77.1% |
78.4% |
|
[Statements of cash flows] |
|||||||||||||||
Cash flow from operating activities |
735 |
803 |
600 |
648 |
480 |
284 |
848 |
||||||||
Cash flow from investing activities |
70 |
42 |
-187 |
-145 |
-260 |
-291 |
-33 |
||||||||
Cash flow from financing activities |
-49 |
-97 |
-343 |
-420 |
-142 |
-236 |
-119 |
||||||||
Net increase in cash and cash equiv. |
755 |
743 |
76 |
95 |
115 |
-218 |
715 |
||||||||
Cash and cash equiv. at beginning of period |
2,416 |
2,416 |
3,159 |
3,159 |
3,255 |
3,255 |
3,036 |
||||||||
Cash and cash equiv. at end of period |
3,171 |
3,159 |
3,235 |
3,255 |
3,370 |
3,036 |
3,752 |
||||||||
Note: For the cash flow statement, the figures for 2Q are the cumulative totals for 1Q-2Q. The figures for 4Q are the cumulative totals for 1Q-4Q. Therefore, the opening balances are also those of the previous 4Q.
Source: Omega Investment from company materials
Financial data I (Fiscal year)
2012/12 |
2013/12 |
2014/12 |
2015/12 |
2016/12 |
2017/12 |
2018/12 |
2019/12 |
2020/12 |
2021/12 |
2022/12 |
|
[Statements of income] |
|||||||||||
Net sales |
7,241 |
7,050 |
7,235 |
7,357 |
7,427 |
7,068 |
7,261 |
7,590 |
8,092 |
9,231 |
9,553 |
Year-on-year |
0.7% |
-2.6% |
2.6% |
1.7% |
1.0% |
-4.8% |
2.7% |
4.5% |
6.6% |
14.1% |
3.5% |
Cost of sales |
4,057 |
4,429 |
4,811 |
4,976 |
4,655 |
4,535 |
4,602 |
4,710 |
4,940 |
5,572 |
6,112 |
Gross profit |
3,184 |
2,620 |
2,424 |
2,380 |
2,772 |
2,532 |
2,659 |
2,879 |
3,152 |
3,658 |
3,440 |
SG&A expenses |
2,386 |
2,349 |
2,261 |
2,180 |
2,257 |
2,339 |
2,330 |
2,474 |
2,399 |
2,609 |
2,624 |
Operating profit |
798 |
271 |
162 |
200 |
514 |
193 |
328 |
405 |
752 |
1,048 |
816 |
Year-on-year |
-10.4% |
-66.0% |
-40.2% |
23.5% |
157.0% |
-62.5% |
69.9% |
23.5% |
85.7% |
39.4% |
-22.1% |
Operating profit margin |
11.0% |
3.8% |
2.2% |
2.7% |
6.9% |
2.7% |
4.5% |
5.3% |
9.3% |
11.4% |
8.5% |
Non-operating profit |
46 |
177 |
128 |
175 |
21 |
208 |
89 |
72 |
71 |
71 |
57 |
Non-operating expenses |
43 |
3 |
5 |
2 |
51 |
3 |
13 |
7 |
6 |
20 |
83 |
Ordinary Profit |
801 |
444 |
285 |
373 |
483 |
397 |
403 |
470 |
817 |
1,099 |
790 |
Extraordinary profit |
3 |
9 |
46 |
34 |
55 |
8 |
|
|
190 |
|
|
Extraordinary expenses |
30 |
2 |
1 |
0 |
82 |
5 |
|
81 |
|
|
|
Income before income taxes |
774 |
451 |
330 |
407 |
456 |
400 |
403 |
388 |
1,008 |
1,099 |
790 |
Total income taxes |
336 |
137 |
131 |
158 |
180 |
148 |
126 |
142 |
307 |
331 |
238 |
net profit attributable to owner of parent |
411 |
313 |
201 |
230 |
254 |
237 |
260 |
237 |
674 |
737 |
517 |
Year-on-year |
-10.3% |
-23.8% |
-35.8% |
14.4% |
10.4% |
-6.7% |
9.7% |
-8.8% |
184.4% |
9.3% |
-29.9% |
Net profit ratio |
5.7% |
4.4% |
2.8% |
3.1% |
3.4% |
3.4% |
3.6% |
3.1% |
8.3% |
8.0% |
5.4% |
[Balance Sheets] |
|||||||||||
Current assets |
5,413 |
5,527 |
5,234 |
5,266 |
5,495 |
5,143 |
5,668 |
5,927 |
6,756 |
7,310 |
7,136 |
Cash equivalents and short-term securities |
2,143 |
2,036 |
1,482 |
1,498 |
1,948 |
1,483 |
2,268 |
2,516 |
3,259 |
3,555 |
3,036 |
Non-current assets |
1,541 |
2,750 |
2,927 |
2,523 |
2,438 |
2,982 |
2,832 |
2,962 |
2,883 |
2,761 |
3,176 |
Property, plant and equipment |
178 |
185 |
213 |
227 |
319 |
690 |
636 |
695 |
636 |
599 |
577 |
Investments and other assets |
1,201 |
2,456 |
2,613 |
2,071 |
1,842 |
2,041 |
1,943 |
2,068 |
2,081 |
1,979 |
2,428 |
Total assets |
6,955 |
8,277 |
8,161 |
7,790 |
7,934 |
8,126 |
8,501 |
8,890 |
9,640 |
10,072 |
10,313 |
Current liabilities |
916 |
818 |
1,130 |
1,017 |
916 |
799 |
945 |
987 |
1,226 |
1,093 |
1,038 |
Short-term borrowings |
20 |
20 |
20 |
20 |
20 |
20 |
20 |
20 |
20 |
20 |
20 |
Non-current liabilities |
317 |
660 |
497 |
394 |
436 |
488 |
502 |
581 |
552 |
658 |
656 |
Total liabilities |
1,234 |
1,479 |
1,628 |
1,412 |
1,352 |
1,288 |
1,448 |
1,568 |
1,779 |
1,752 |
1,695 |
Total net assets |
5,720 |
6,797 |
6,532 |
6,378 |
6,581 |
6,838 |
7,053 |
7,321 |
7,861 |
8,319 |
8,617 |
Shareholders’ equity |
5,230 |
6,311 |
6,050 |
5,951 |
6,135 |
6,381 |
6,581 |
6,843 |
7,358 |
7,787 |
8,052 |
Share capital |
918 |
918 |
918 |
918 |
918 |
918 |
918 |
918 |
918 |
918 |
918 |
Capital surplus |
1,221 |
1,221 |
1,221 |
1,251 |
1,251 |
1,251 |
1,251 |
1,251 |
1,251 |
1,258 |
1,260 |
Retained earnings |
3,119 |
3,314 |
3,397 |
3,521 |
3,680 |
3,812 |
4,026 |
4,181 |
4,761 |
5,274 |
5,560 |
Treasury shares |
-67 |
-67 |
-67 |
-67 |
-67 |
-67 |
-67 |
-67 |
-67 |
-239 |
-216 |
Valuation and exchange differences |
37 |
924 |
579 |
327 |
352 |
466 |
451 |
558 |
494 |
574 |
530 |
Total liabilities and net assets |
6,955 |
8,277 |
8,161 |
7,790 |
7,934 |
8,126 |
8,501 |
8,890 |
9,640 |
10,072 |
10,313 |
(Equity ratio) |
75.2% |
76.2% |
74.1% |
76.4% |
77.3% |
78.5% |
77.4% |
77.0% |
76.3% |
77.3% |
78.1% |
[Statements of cash flows] |
|||||||||||
Cash flow from operating activities |
347 |
126 |
297 |
129 |
573 |
89 |
908 |
549 |
803 |
648 |
284 |
Cash flow from investing activities |
-167 |
-99 |
-227 |
-263 |
99 |
-235 |
-185 |
-115 |
42 |
-145 |
-291 |
Cash flow from financing activities |
-126 |
-126 |
-122 |
-151 |
-107 |
-109 |
-85 |
-85 |
-97 |
-420 |
-236 |
Net increase in cash and cash equiv. |
61 |
-97 |
-52 |
-285 |
549 |
-264 |
684 |
348 |
743 |
95 |
-218 |
Cash and cash equiv. at beginning of period |
1,471 |
1,532 |
1,435 |
1,383 |
1,098 |
1,648 |
1,383 |
2,068 |
2,416 |
3,159 |
3,255 |
Cash and cash equiv. at end of period |
1,532 |
1,435 |
1,383 |
1,098 |
1,648 |
1,383 |
2,068 |
2,416 |
3,159 |
3,255 |
3,036 |
FCF |
180 |
27 |
70 |
-134 |
672 |
-146 |
723 |
434 |
845 |
503 |
-7 |
Source: Omega Investment from company materials