2026-07-27
Home
Japanese

Omega Investment Co., Ltd.
Sansei Landic (Company note – 3Q update)
| Share price (1/4) | ¥1,003 | Dividend Yield (23/12 CE) | 3.29 % |
| 52weeks high/low | ¥1,098/800 | ROE(TTM) | 12.78 % |
| Avg Vol (3 month) | 21.7 thou shrs | Operating margin (TTM) | 10.96 % |
| Market Cap | ¥8.61 bn | Beta (5Y Monthly) | 0.44 |
| Enterprise Value | ¥19.14 bn | Shares Outstanding | 8.584 mn shrs |
| PER (23/12 CE) | 6.99 X | Listed market | TSE Standard |
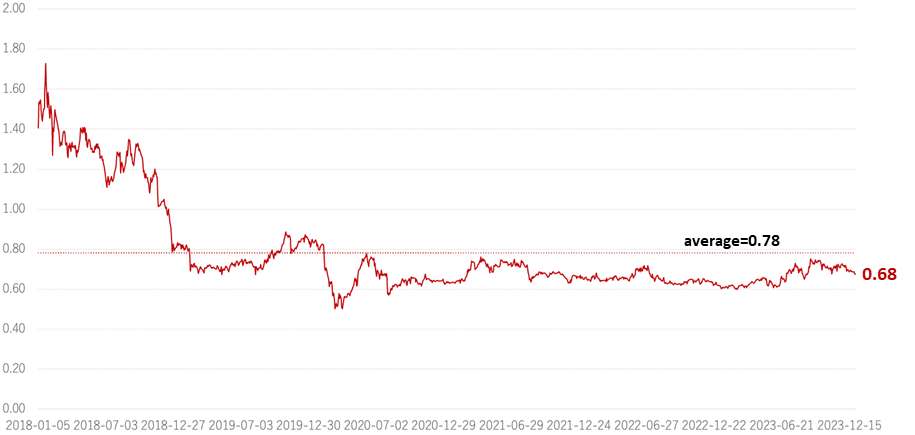
| PBR (22/12 act) | 0.68 X |
| Click here for the PDF version of this page |
| PDF Version |
Sales and profits are rising significantly higher following 2Q. Old unutilized properties are performing well; profit has already exceeded the company’s full-year forecast.
◇Summary of 3Q results for FY12/2023: Significant increase in sales and profit following 2Q
Sansei Landic announced its financial results for 3Q FY12/2023 on 14 November 2023, delivering a significant increase in the Real Estate Sales business; the overall sales rose by approximately 70% YoY. In particular, sales of Old unutilized properties doubled. As a result, operating income increased by 90%, continuing the significant increase recorded in 2Q. Sales by the end of 3Q had achieved 83% of the management’s full-year forecast. The operating income already achieved the full-year estimate. The purchases of Leasehold land were strong, and 95% of the full-year purchase plan had been achieved by the end of 3Q. Properties for sale at the end of 3Q remained at a high level of 23.4 billion yen.
The company’s 4Q sales plan was originally small, so the full-year financial forecasts were left unchanged.
◇ Share price: The share price looks set to rise again on the back of good results
The company’s share price turned upwards from the 800 yen level a year ago to reach a milestone of 1,000 yen by the end of July 2023. There was a moderate adjustment afterwards but on September 4th, the yearly high of 1,098 yen was recorded. On 20 November, following the announcement of 3Q results, the share price temporarily hit 1,090 yen. In addition to the two upward revisions to earnings, coupled with abundant inventories, we would expect the share price to rise further amid a strong property market.
◇ Financial results for 3Q FY12/2023: Sales up 70% and operating income up 90%. Financial performance remains robust.
The company’s 3Q results for FY12/2023 were sales up 72.8% YoY to 19,464 million yen, operating income rising 94.3% to 2,332 million yen, and quarterly net income attributable to owner of parent increasing 45.9% YoY to 1,326 million yen, demonstrating significant growth in sales and profits following 2Q. The construction business was sold in 1Q of the previous year, so a comparison of the Real Estate Sales business alone on an apple-to-apple basis, excluding the construction business, shows a 76.3% YoY increase in sales.
The management’s forecasts for the cumulative 3Q results were sales of 20,395 million yen, operating income of 2,450 million yen, and quarterly net income attributable to owner of parent of 1,413 million yen. The results were 95.4%, 95.2%, and 93.9% vis-a-vis these estimates. However, as mentioned above, the results are significantly higher YoY, and the company should comfortably achieve its full-year forecasts.
The gross profit margin in the cumulative 3Q fell by 5.3 percentage points to 28.8% from 34.1% YoY. This was due to a significant increase in the proportion of Old unutilized properties in sales from 47.4% to 58.1% YoY, while the proportion of high-margin Leasehold land sales fell from 44.1% to 34.1% YoY. The SG&A ratio fell from 23.4% to 16.8%, in line with the rapid increase in sales. As a result, the operating income margin improved by 1.3 percentage points from 10.7% to 12.0%.
In the BS, real estate for sale remained at a high level of 23,490 million yen.
| JPY, mn | Net sales | YoY % |
Oper. profit |
YoY % |
Ord. profit |
YoY % |
Profit ATOP |
YoY % |
EPS (¥) |
DPS (¥) |
| 2019/12 | 18,020 | 7.1 | 1,860 | 5.4 | 1,758 | 7.0 | 1,158 | 15.1 | 137.08 | 23.00 |
| 2020/12 | 17,774 | -1.4 | 847 | -54.5 | 709 | -59.7 | 357 | -69.1 | 42.34 | 25.00 |
| 2021/12 | 16,836 | -5.3 | 1,117 | 31.9 | 999 | 40.9 | 609 | 70.5 | 73.56 | 26.00 |
| 2022/12 | 15,513 | -7.7 | 1,469 | 31.5 | 1,283 | 28.4 | 1,060 | 73.9 | 129.61 | 28.00 |
| 2023/12 (CE) | 23,500 | 51.3 | 2,150 | 46.3 | 1,800 | 40.2 | 1,180 | 11.3 | 143.44 | 33.00 |
| 2022/12 3Q | 11,261 | -14.7 | 1,200 | 16.8 | 1,071 | 13.7 | 909 | 65.9 | 110.94 | – |
| 2023/12 3Q | 19,464 | 72.8 | 2,332 | 94.3 | 2,019 | 88.4 | 1,326 | 45.9 | 161.33 | – |
Quarterly sales and operating profit
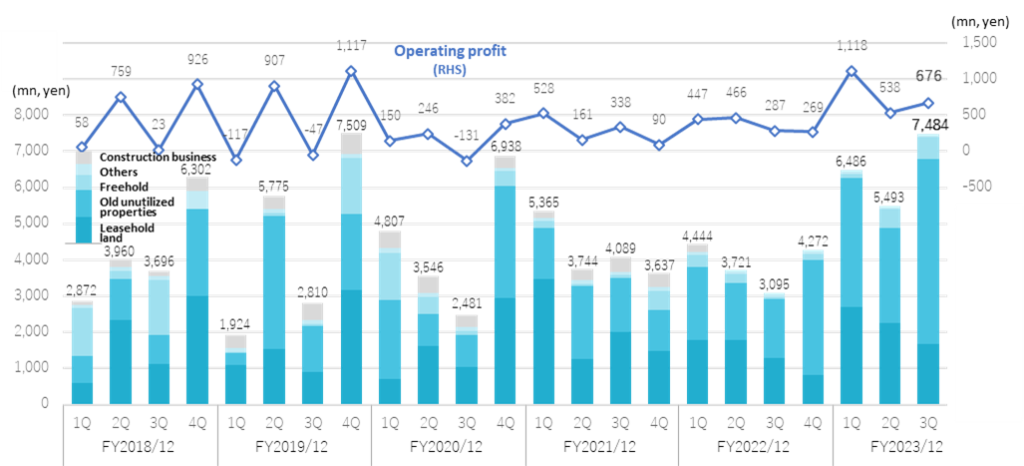
Source: Omega Investment from company materials
Reflecting strong purchases from 2Q FY12/2022 onwards, the company has secured sufficient inventory for sales going forward. As a result of good progress in sales, cash and deposits increased by 1,550 million yen to 5,387 million yen. Interest-bearing debt decreased by 137 million yen YoY to 16,261 million yen, reflecting fine sales activities. Total assets amounted to 30,632 million yen, an increase of 1,655 million yen from the end of FY2022. The equity ratio at the end of 3Q stood at 39.9%, an improvement of 1.8 percentage points over the end of FY2022.
Real Estate Sales business trends
Leasehold land: Sales were 6,640 million yen (+36.3%). Sales of Leasehold land purchased last year have progressed, with sales increasing by approximately 40% YoY. The number of projects with relatively high unit prices resulted in a moderate decrease to 236 projects, or 3.3%. Although slightly short of the forecast of 6,851 million yen, sales continued to be strong, particularly in the Tokyo metropolitan area.
Old unutilized properties: Sales recorded 11,317 million yen (+116.4%). In recent years, the company has been strengthening its sales structure outside the metropolitan area, and the results are starting to kick in. There were 74 projects, a significant increase of 111.4%. In the 3Q alone, sales tripled YoY to 5,113 million yen.
Freehold: Sales were 1,213 million yen (+92.4%). Although coming in slightly below the forecast of 1,307 million yen, sales doubled YoY. The number of projects was 17, increasing by 21.4%.
Purchase of real estate for sales: Registered 13,679 million yen, showing the high purchase. Purchases of Leasehold land increased by approximately 50%.
Purchases in the Real Estate Sales business were 13,679 million yen, a decrease of 6.9%, but the level remains high, running above 4 billion on a quarterly basis since 2Q FY12/2022.
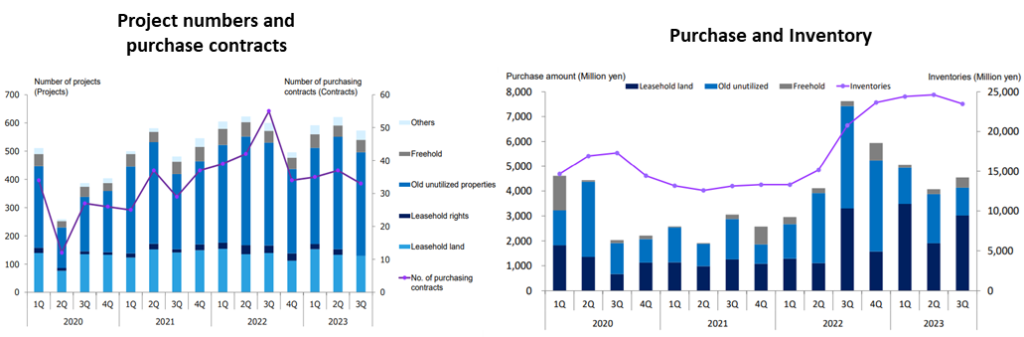
Source: company materials
In the same period of the previous year, the purchase of Old unutilized properties accounted for nearly 60% of the total purchase volume. In 3Q, the purchase volume of Leasehold land accounted for more than 50% of the total volume. The 3Q cumulative purchase results by business segment were as follows: Leasehold land saw a growth of 47.5% with 8,410 million yen, mainly due to strong purchase in the Kanto region. Old unutilized properties decreased by 45.3% to 4,546 million yen due to the high-level previous year. Freehold, on the other hand, grew by 6.5% to 722 million yen. The company sets its annual purchasing plan at 14.4 billion yen. As of the end of 3Q, it was already 95% complete, and the current purchase appears to be progressing well.
The above right-hand chart shows the trend of purchases and sales in the company’s Real Estate Sales business: purchases remained low from 3Q FY12/2020 due to a slowdown in sales activities caused by COVID-19 but have been recovering since the start of FY12/2022. In particular, the company recorded a high level of purchases in 3Q and 4Q FY12/2022, and the results of these purchases should contribute to the company’s strong financial performance from this year onwards. Large projects take time to sell, so sales are expected to be recorded from the next financial year onwards.
◇ Forecasts for FY12/2023: No change in the forecasts revised on 10 August
When the company announced its 2Q results, it revised its financial forecasts for the second time this year (see table below), predicting a 51.3% YoY increase in sales and a 46.3% increase in operating income. As of the end of 3Q, the actual progress against the full-year forecast was 82.8% for sales, 108.5% for operating income margin and 112.4% for quarterly income attributable to owner of parent, meaning that profits have already met the full-year forecast. At the time of the second upward revision, the company expected fewer properties to be sold in 4Q, leaving its full-year financial forecasts unchanged.
Upward revisions to FY12/2023 consolidated forecasts
| JPY, mn | Net sales | Oper. profit |
Ord. profit |
Profit ATOP |
EPS (¥) |
| Initial forecast at FY12/2022 result call (A) (14 February 2023) |
17,119 | 1,594 | 1,305 | 836 | 102.68 |
| Revised forecast at the time of 1Q result announcement (B) (announced 15 May 2023) |
20,500 | 1,700 | 1,400 | 900 | 109.55 |
| Revised forecast at the time of 2Q result announcement (C) (announced 10 Aug. 2023) |
23,500 | 2,150 | 1,800 | 1,180 | 143.44 |
| Change (C – B) | 3,000 | 450 | 400 | 280 | – |
| Percentage change (C/B,%) | +14.6 | +26.5 | +28.6 | +31.1 | – |
| Change (C – A) | 6,381 | 556 | 495 | 344 | – |
| Percentage change (C/A,%) | +37.3 | +34.9 | +37.9 | +41.1 | – |
| FY12/2022 actual | 15,533 | 1,469 | 1,283 | 1,060 | 129.61 |
| Revised forecast, YoY (%) | 51.3 | 46.3 | 40.2 | 11.3 | – |
| Progress ratio as at 3Q (%) | 82.8 | 108.5 | 112.2 | 112.4 | – |
Source: Omega Investment from company materials
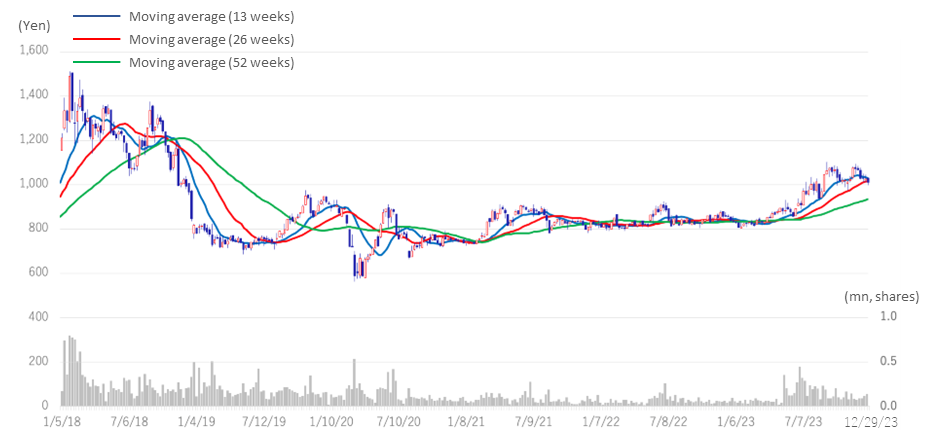
◇ Share price: The share price has recovered to above 1,000 yen level. Further upside is expected.
The company’s share price turned upwards from the 800 yen level a year ago and recovered to the milestone level of 1,000 yen at the end of July 2023. Thereafter, there was a slight adjustment, but on 4 September, the share price reached 1,098 yen, the highest since the beginning of the year. The share price regained momentum following the good results, achieving full-year profits in 3Q. On 24 November, the share price closed at 1,067 yen, marking a YTD high on a closing price basis. YTD performance is +28.8%. This reflects the company’s good performance against the backdrop of a buoyant property market and abundant inventory, which is expected to contribute to the next financial year.
On the other hand, PBR below 1.0 is problematic for investors. PBR has recently risen above 0.7x following the rising share price. Given the company’s unique business model and earnings opportunities, the shares are cheap. The company has stated that it recognises the improvement of PBR as an important management issue and is considering concrete measures to address it. It plans to announce basic policies to make management conscious of the cost of capital and share price by the time it announces its full-year results. Hopefully, the shares should be reassessed by the roadmap for sustainable earnings growth to be announced.
6-year share price move
Historical PBR (last six years)
Financial data (quarterly)
FY (¥mn) |
2020/12 |
2021/12 |
2022/12 |
2023/12 |
|||||||||||
1Q |
2Q |
3Q |
4Q |
1Q |
2Q |
3Q |
4Q |
1Q |
2Q |
3Q |
4Q |
1Q |
2Q |
3Q |
|
[Sales by segment] |
|||||||||||||||
Net sales |
4,807 |
3,546 |
2,481 |
6,938 |
5,365 |
3,744 |
4,089 |
3,637 |
4,444 |
3,721 |
3,094 |
4,272 |
6,486 |
5,494 |
7,484 |
Year-on-year basis |
149.7% |
-38.6% |
-11.7% |
-7.6% |
11.6% |
5.6% |
64.8% |
-47.6% |
-17.2% |
-0.6% |
-24.3% |
17.4% |
45.9% |
47.6% |
141.8 |
Real estate sales business |
4,339 |
3,092 |
2,137 |
6,543 |
5,171 |
3,434 |
3,679 |
3,244 |
4,222 |
3,721 |
3,094 |
4,272 |
6,486 |
5,493 |
7,484 |
Year-on-year basis |
175.3% |
-42.7% |
-9.2% |
-5.7% |
19.2% |
11.1% |
72.1% |
-50.4% |
-18.3% |
8.3% |
-15.9% |
31.7% |
53.6% |
47.6% |
141.8% |
Sales composition ratio |
90.3% |
87.2% |
86.2% |
94.3% |
96.4% |
91.7% |
90.0% |
89.2% |
95.0% |
100.0% |
100.0% |
100.0% |
100.0% |
100.0% |
100.0% |
Leasehold land |
719 |
1,613 |
1,044 |
2,950 |
3,464 |
1,267 |
2,003 |
1,474 |
1,793 |
1,794 |
1,284 |
832 |
2,707 |
2,259 |
1,674 |
Year-on-year basis |
-33.8% |
4.3% |
17.4% |
-7.1% |
381.4% |
-21.5% |
91.9% |
-50.0% |
-48.2% |
41.6% |
-35.9% |
-43.6% |
51.0% |
25.9% |
30.4% |
Sales composition ratio |
15.0% |
45.5% |
42.1% |
42.5% |
64.6% |
33.8% |
49.0% |
40.5% |
40.3% |
48.2% |
41.5% |
19.5% |
41.7% |
41.1% |
22.4% |
Old unutilised properties |
2,180 |
897 |
872 |
3,101 |
1,419 |
2,025 |
1,488 |
1,151 |
2,024 |
1,556 |
1,649 |
3,170 |
3,571 |
2,633 |
5,113 |
Year-on-year basis |
520.6% |
-75.5% |
-32.0% |
-47.1% |
-34.9% |
125.8% |
70.6% |
-62.9% |
42.6% |
-23.2% |
10.8% |
175.4% |
76.4% |
69.2% |
210.1% |
Sales composition ratio |
45.4% |
25.3% |
35.1% |
44.7% |
26.4% |
54.1% |
36.4% |
31.6% |
45.5% |
41.8% |
53.3% |
74.2% |
55.1% |
47.9% |
68.3% |
Freehold |
1,305 |
465 |
106 |
395 |
191 |
46 |
101 |
526 |
315 |
266 |
49 |
157 |
101 |
504 |
603 |
Year-on-year basis |
4560.7% |
428.4% |
92.7% |
-74.2% |
-85.3% |
-90.1% |
-4.7% |
33.2% |
64.9% |
478.3% |
-51.5% |
-70.2% |
-67.9% |
89.5% |
1140.8% |
Sales composition ratio |
27.1% |
13.1% |
4.3% |
5.7% |
3.6% |
1.2% |
2.5% |
14.5% |
7.1% |
7.1% |
1.6% |
3.7% |
1.6% |
9.2% |
8.1% |
Others |
133 |
117 |
116 |
97 |
96 |
95 |
88 |
94 |
89 |
105 |
112 |
114 |
105 |
97 |
90 |
Year-on-year basis |
21.5% |
12.5% |
-7.9% |
-23.0% |
-28.3% |
-18.8% |
-24.1% |
-3.1% |
-7.3% |
10.5% |
27.3% |
21.3% |
19.1% |
-8.6% |
-19.6% |
Sales composition ratio |
2.8% |
3.3% |
4.7% |
1.4% |
1.8% |
2.5% |
2.2% |
2.6% |
2.0% |
2.8% |
3.6% |
2.7% |
1.6% |
1.7% |
1.2% |
Construction business |
468 |
455 |
343 |
395 |
194 |
309 |
409 |
392 |
222 |
– |
– |
– |
– |
– |
– |
Year-on-year basis |
34.1% |
19.8% |
-24.9% |
-30.1% |
-58.4% |
-32.1% |
19.3% |
-0.8% |
14.0% |
– |
– |
– |
– |
– |
– |
Sales composition ratio |
9.7% |
12.8% |
13.8% |
5.7% |
3.6% |
8.3% |
10.0% |
10.8% |
5.0% |
– |
– |
– |
– |
– |
– |
[Statements of income] |
|||||||||||||||
Net sales |
4,807 |
3,546 |
2,481 |
6,938 |
5,365 |
3,744 |
4,089 |
3,637 |
4,444 |
3,721 |
3,096 |
4,272 |
6,486 |
5,494 |
7,484 |
Cost of sales |
3,865 |
2,557 |
1,934 |
5,431 |
4,020 |
2,756 |
2,945 |
2,745 |
3,146 |
2,310 |
1,963 |
3,066 |
4,320 |
3,859 |
5,681 |
Gross profit |
942 |
989 |
548 |
1,507 |
1,344 |
986 |
1,143 |
892 |
1,297 |
1,411 |
1,132 |
1,206 |
2,166 |
1,636 |
1,803 |
SG&A expenses |
792 |
744 |
678 |
925 |
816 |
826 |
805 |
802 |
850 |
946 |
845 |
937 |
1,084 |
1,097 |
1,127 |
Operating profit |
150 |
245 |
-131 |
382 |
528 |
160 |
338 |
90 |
447 |
466 |
287 |
269 |
1,118 |
538 |
675 |
Non-operating profit |
9 |
5 |
51 |
5 |
12 |
8 |
8 |
6 |
7 |
7 |
6 |
7 |
8 |
6 |
20 |
Non-operating expenses |
55 |
63 |
60 |
10 |
37 |
40 |
34 |
39 |
39 |
55 |
54 |
64 |
80 |
165 |
88 |
Ordinary income |
103 |
188 |
-140 |
298 |
502 |
128 |
311 |
56 |
415 |
417 |
239 |
212 |
1,045 |
378 |
595 |
Extraordinary income |
0 |
0 |
0 |
|
3 |
0 |
0 |
0 |
19 |
0 |
0 |
1 |
– |
– |
– |
Extraordinary expenses |
0 |
0 |
0 |
|
0 |
0 |
8 |
7 |
– |
– |
8 |
||||
Loss before income taxes |
103 |
188 |
-140 |
298 |
506 |
128 |
311 |
56 |
435 |
399 |
231 |
205 |
1,045 |
378 |
586 |
Total income taxes |
36 |
72 |
-49 |
295 |
183 |
48 |
166 |
-4 |
59 |
60 |
36 |
54 |
361 |
122 |
199 |
Net income |
67 |
114 |
-90 |
176 |
323 |
79 |
145 |
61 |
375 |
338 |
196 |
151 |
683 |
255 |
387 |
[Balance Sheets] |
|||||||||||||||
Current assets |
18,816 |
20,798 |
20,577 |
19,040 |
17,554 |
17,371 |
18,769 |
18,968 |
19.018 |
21,579 |
26,379 |
27,929 |
28,392 |
29,382 |
29,233 |
Property for sale |
14,655 |
16,923 |
17,312 |
14,424 |
13,493 |
12,586 |
13,134 |
13,301 |
13,304 |
15,152 |
20,775 |
23,657 |
24,404 |
24,623 |
23,490 |
Non-current assets |
1,188 |
1,164 |
1,197 |
1,030 |
951 |
1,054 |
1,081 |
1,082 |
1,124 |
1,099 |
1,129 |
1,047 |
1,233 |
1,394 |
1,399 |
Tangible assets |
451 |
449 |
443 |
306 |
291 |
290 |
293 |
301 |
317 |
313 |
314 |
299 |
312 |
529 |
520 |
Investments and other assets |
668 |
653 |
691 |
655 |
595 |
703 |
732 |
730 |
761 |
743 |
769 |
701 |
873 |
817 |
836 |
Total assets |
20,004 |
21,962 |
21,774 |
20,071 |
18,505 |
18,425 |
19,849 |
20,051 |
20,134 |
22,678 |
27,508 |
28,976 |
29,626 |
30,777 |
30,632 |
Current liabilities |
9,883 |
7,767 |
7,699 |
5,772 |
5,517 |
7,540 |
8,633 |
8,731 |
8,153 |
8,871 |
11,168 |
12,606 |
13,658 |
16,133 |
16,375 |
Short-term borrowings |
7,729 |
6,352 |
6,676 |
4,463 |
4,272 |
6,105 |
7,171 |
7,367 |
5,025 |
5,057 |
6,960 |
10,192 |
11,151 |
12,198 |
14,470 |
Non-current liabilities |
345 |
4,303 |
4,274 |
4,232 |
2,919 |
792 |
976 |
1,017 |
1,525 |
3,114 |
5,453 |
5,314 |
4,405 |
2,810 |
2,035 |
Long-Term Borrowings |
– |
3,958 |
3,929 |
3,879 |
2,570 |
483 |
683 |
740 |
1,260 |
2,827 |
5,153 |
5,033 |
4,093 |
2,545 |
1,791 |
Total liabilities |
10,228 |
12,071 |
11,973 |
10,004 |
8,436 |
8,332 |
9,609 |
9,749 |
9.679 |
11,968 |
16,622 |
17,920 |
18,064 |
18,943 |
18,411 |
Total net assets |
9,776 |
9,891 |
9,801 |
10,067 |
10,070 |
10,093 |
10,240 |
10,301 |
10,463 |
10,692 |
10,886 |
11,056 |
11,561 |
11,833 |
12,220 |
Total shareholders’ equity |
9,776 |
9,891 |
9,801 |
10,067 |
10,070 |
10,093 |
10,240 |
10,297 |
10,459 |
10,688 |
10,882 |
11,052 |
11,562 |
11,833 |
12,220 |
Capital stock |
818 |
818 |
818 |
818 |
818 |
820 |
820 |
820 |
821 |
822 |
824 |
833 |
860 |
860 |
860 |
Legal capital reserve |
779 |
779 |
779 |
779 |
779 |
781 |
781 |
781 |
782 |
785 |
786 |
796 |
823 |
824 |
824 |
Retained earnings |
8,174 |
8,289 |
8,200 |
8,465 |
8,577 |
8,656 |
8,802 |
8,863 |
9,023 |
9,362 |
9,557 |
9,708 |
10,164 |
10,419 |
10,807 |
Stock acquisition right |
4 |
4 |
4 |
4 |
4 |
4 |
4 |
4 |
4 |
3 |
3 |
3 |
– |
– |
– |
Total liabilities and net assets |
20,004 |
21,962 |
21,774 |
20,071 |
18,505 |
18,425 |
19,849 |
20,051 |
20,134 |
22,678 |
27,508 |
28,976 |
29,626 |
30,777 |
30,632 |
[Statements of cash flows] |
|||||||||||||||
Cash flow from operating activities |
-3,683 |
-916 |
2,110 |
1,704 |
1,184 |
-9,267 |
911 |
||||||||
Loss before income taxes |
291 |
712 |
635 |
1,003 |
833 |
1,269 |
1,423 |
||||||||
Cash flow from investing activities |
-9 |
-287 |
-26 |
-51 |
-205 |
-266 |
-655 |
||||||||
Cash flow from financing activities |
|
3,021 |
|
952 |
|
-2,129 |
-608 |
-559 |
7,971 |
-56 |
|||||
Net increase in cash and cash equiv. |
-671 |
-251 |
-46 |
1,045 |
420 |
-1,563 |
200 |
||||||||
Cash and cash equiv. at beginning of period |
3,958 |
3,958 |
3,707 |
3,707 |
4,752 |
4,752 |
3,188 |
||||||||
Cash and cash equiv. at end of period |
3,287 |
3,707 |
3,661 |
4,752 |
5,173 |
3,188 |
3,839 |
||||||||
Source: Omega Investment from company materials
Financial data
FY (¥mn) |
2012/12 |
2013/12 |
2014/12 |
2015/12 |
2016/12 |
2017/12 |
2018/12 |
2019/12 |
2020/12 |
2021/12 |
2022/12 |
2023/12(forecast) |
[Statements of income] |
||||||||||||
Net sales |
9,475 |
9,187 |
10,443 |
11,567 |
12,300 |
13,098 |
16,833 |
18,020 |
17,774 |
16,836 |
15,533 |
23,500 |
YoY change (%) |
17.8 |
-3.0 |
13.7 |
10.8 |
6.3 |
6.5 |
28.5 |
7.1 |
-1.4 |
-5.3 |
-7.7 |
51.3 |
Cost of sales |
7,061 |
6,254 |
7,055 |
7,798 |
8,344 |
8,566 |
12,028 |
12,902 |
13,788 |
12,467 |
10,485 |
– |
Gross profit |
2,415 |
2,934 |
3,389 |
3,769 |
3,957 |
4,532 |
4,805 |
5,119 |
3,986 |
4,368 |
5,047 |
– |
SG&A expenses |
1,898 |
2,014 |
2,184 |
2,470 |
2,510 |
2,770 |
3,039 |
3,258 |
3,139 |
3,250 |
3,578 |
– |
Operating profit |
517 |
920 |
1,205 |
1,300 |
1,446 |
1,762 |
1,766 |
1,861 |
847 |
1,117 |
1,469 |
2,150 |
YoY change (%) |
31.0 |
77.9 |
30.9 |
7.9 |
11.3 |
21.9 |
0.2 |
5.4 |
-54.5 |
31.9 |
31.5 |
46.3 |
Operating income margin (%) |
5.5 |
10.0 |
11.5 |
11.2 |
11.8 |
13.5 |
10.5 |
10.3 |
4.8 |
6.6 |
9.5 |
9.1 |
Non-operating profit |
5 |
12 |
14 |
15 |
15 |
12 |
28 |
42 |
88 |
34 |
26 |
– |
Non-operating expenses |
85 |
122 |
174 |
118 |
133 |
106 |
150 |
144 |
226 |
152 |
212 |
– |
Ordinary income |
437 |
810 |
1,044 |
1,196 |
1,329 |
1,669 |
1,643 |
1,759 |
709 |
999 |
1,283 |
1,800 |
Extraordinary income |
23 |
|
|
|
|
97 |
|
|
32 |
3 |
20 |
– |
Extraordinary expenses |
17 |
|
|
|
|
94 |
104 |
|
29 |
33 |
– |
|
Loss before income taxes |
443 |
810 |
1,044 |
1,196 |
1,329 |
1,672 |
1,539 |
1,759 |
712 |
1,003 |
1,269 |
– |
Total income taxes |
209 |
354 |
418 |
472 |
475 |
561 |
533 |
600 |
355 |
394 |
209 |
– |
Net income attributable to owner of parent |
233 |
456 |
626 |
724 |
854 |
1,111 |
1,007 |
1,159 |
358 |
609 |
1,060 |
1,180 |
YoY change (%) |
47.5 |
95.4 |
37.5 |
15.6 |
17.9 |
30.2 |
-9.4 |
15.1 |
-69.1 |
70.5 |
73.9 |
11.3 |
Net income margin (%) |
2.5 |
5.0 |
6.0 |
6.3 |
6.9 |
8.5 |
6.0 |
6.4 |
2.0 |
3.6 |
6.8 |
5.0 |
[Balance Sheets] |
||||||||||||
Current assets |
6,257 |
8,023 |
7,836 |
10,366 |
9,749 |
15,874 |
15,745 |
18,094 |
19,040 |
18,968 |
27,929 |
– |
Property for sale |
4,834 |
6,346 |
5,166 |
7,699 |
6,877 |
11,863 |
11,678 |
13,493 |
14,424 |
13,301 |
23,657 |
– |
Non-current assets |
836 |
895 |
957 |
1,031 |
1,083 |
1,042 |
1,032 |
1,199 |
1,030 |
1,082 |
1,047 |
– |
Tangible assets |
135 |
569 |
603 |
572 |
591 |
467 |
458 |
456 |
306 |
301 |
299 |
– |
Investments and other assets |
622 |
226 |
258 |
383 |
405 |
494 |
505 |
669 |
655 |
730 |
701 |
– |
Total assets |
7,093 |
8,919 |
8,793 |
11,398 |
10,833 |
16,916 |
16,777 |
19,294 |
20,071 |
20,050 |
28,976 |
– |
Current liabilities |
3,098 |
4,587 |
3,165 |
4,910 |
3,751 |
8,430 |
6,160 |
9,047 |
5,772 |
8,731 |
12,606 |
– |
Short-term borrowings |
2,095 |
3,362 |
2,094 |
3,778 |
2,624 |
7,076 |
4,728 |
7,203 |
4,462 |
5,544 |
10,192 |
– |
Non-current liabilities |
562 |
465 |
367 |
453 |
226 |
479 |
1,710 |
351 |
4,232 |
1,017 |
5,314 |
– |
Long-Term Borrowings |
526 |
419 |
320 |
180 |
88 |
364 |
1,320 |
|
3,879 |
740 |
5,033 |
– |
Total liabilities |
3,660 |
5,051 |
3,531 |
5,363 |
3,977 |
8,909 |
7,869 |
9,399 |
10,004 |
9,748 |
17,920 |
– |
Total net assets |
3,433 |
3,868 |
5,262 |
6,034 |
6,856 |
8,006 |
8,908 |
9,894 |
10,066 |
10,301 |
11,056 |
– |
Total shareholders’ equity |
3,433 |
3,868 |
5,262 |
6,034 |
6,852 |
8,002 |
8,904 |
9,890 |
10,062 |
10,297 |
11,052 |
– |
Capital stock |
257 |
257 |
661 |
710 |
720 |
788 |
811 |
814 |
818 |
820 |
833 |
– |
Legal capital reserve |
218 |
218 |
622 |
671 |
681 |
749 |
772 |
775 |
779 |
781 |
796 |
– |
Retained earnings |
2,958 |
3,393 |
3,978 |
4,654 |
5,451 |
6,464 |
7,320 |
8,302 |
8,465 |
8,863 |
9,708 |
– |
Stock acquisition right |
|
|
|
|
4 |
4 |
4 |
4 |
4 |
4 |
3 |
– |
Total liabilities and net assets |
7,093 |
8,919 |
8,793 |
11,398 |
10,833 |
16,916 |
16,777 |
19,294 |
20,071 |
20,050 |
28,976 |
– |
Equity ratio (%) |
48.4 |
43.4 |
59.8 |
52.9 |
63.3 |
47.3 |
53.1 |
51.3 |
50.1 |
51.4 |
38.1 |
– |
[Statements of cash flows] |
||||||||||||
Cash flow from operating activities |
-953 |
-664 |
1,761 |
-1,451 |
1,611 |
-3,666 |
1,617 |
-420 |
-917 |
1,704 |
-9,267 |
– |
Loss before income taxes |
443 |
810 |
1,044 |
1,196 |
1,329 |
1,672 |
1,539 |
1,759 |
712 |
1,003 |
1,269 |
– |
Cash flow from investing activities |
-15 |
-175 |
-111 |
-116 |
-184 |
107 |
-64 |
-71 |
-288 |
-51 |
-266 |
– |
Cash flow from financing activities |
692 |
1,136 |
-612 |
1,588 |
-1,278 |
4,667 |
-1,495 |
984 |
953 |
-608 |
7,971 |
– |
Issuance of shares |
|
|
800 |
97 |
21 |
37 |
45 |
6 |
9 |
– |
||
Net increase in cash and cash equiv. |
-276 |
296 |
1,039 |
22 |
150 |
1,108 |
58 |
493 |
-251 |
1,045 |
-1,563 |
– |
Cash and cash equiv. at beginning of period |
1,069 |
793 |
1,089 |
2,128 |
2,150 |
2,299 |
3,407 |
3,465 |
3,959 |
3,707 |
4,752 |
– |
Cash and cash equiv. at end of period |
793 |
1,089 |
2,128 |
2,150 |
2,299 |
3,407 |
3,465 |
3,959 |
3,707 |
4,752 |
3,188 |
– |
Free cash flow |
-968 |
-839 |
1,650 |
-1,567 |
1,427 |
-3,559 |
1,553 |
-491 |
-1,205 |
1,653 |
-9,533 |
– |
Source: Omega Investment from company materials