2026-06-26
Home
Japanese

Omega Investment Co., Ltd.
Hamee (Company note – 2Q update)

| Share price (1/12) | ¥1,004 | Dividend Yield (24/4 CE) | 2.2 % |
| 52weeks high/low | ¥1,210 / 688 | ROE(23/4) | 11.1 % |
| Avg Vol (3 month) | 57 thou shrs | Operating margin (23/4) | 9.1 % |
| Market Cap | ¥16.0 bn | Beta (5Y Monthly) | 1.9 |
| Enterprise Value | ¥14.7 bn | Shares Outstanding | 15.9 mn shrs |
| PER (24/4 CE) | 10.6 X | Listed market | TSE Standard |
| PBR (23/4 act) | 1.8 X |
| Click here for the PDF version of this page |
| PDF Version |
Q2 FY04/2024 (Aug-Oct 2023).
Financial results show YoY growth in revenues and profits.
Summary
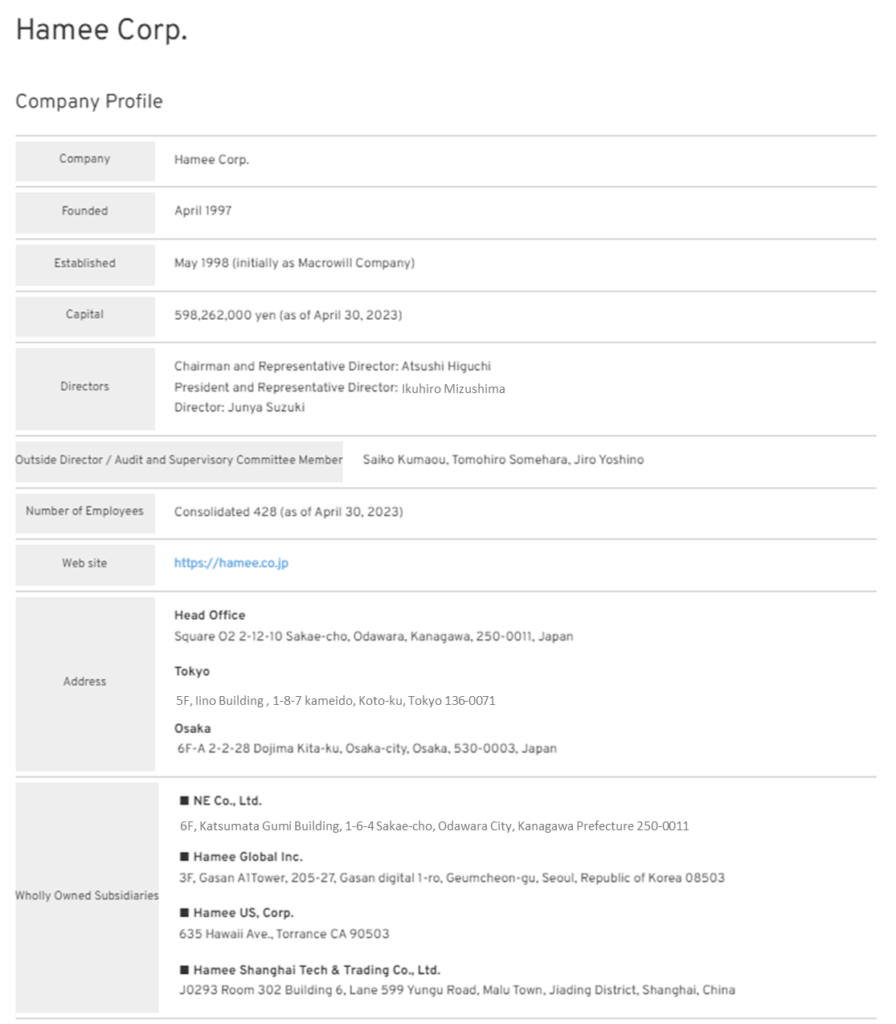
Company profile
◇ Hamee Corp. was founded in 1997, went public on TSE Mothers in 2015, and is currently listed on the Standard Market. The company spin-off and operates ‘Commerce Business’ and ‘Platform Business’, both of which are profitable. In FY04/2023, the company reported consolidated net sales of JPY 14 billion, operating income of JPY 1.3 billion, total assets of JPY 12.3 billion, net assets of JPY 9 billion, and 428 employees. The Mid-Term Management Plan announced in June 2023 aims for net sales of JPY 22.5 billion and operating income of JPY 3.3 billion in FY04/2026.
◇ ‘Commerce Business’: the main business is the planning, development, and manufacture of mobile accessories, as well as e-commerce sales and wholesale to mass retailers, with the iFace series of in-house designed products gaining recognition, particularly among younger consumers. The scale of the business is net sales of JPY 10.7 billion and segment profit of JPY 700 million for the full year to April 2023. The company is currently promoting the multi-layering of its Gaming Accessories Business, Cosmetics (“ByUR” brand), and Global Business, the results of which are beginning to become apparent in terms of earnings. In particular, cosmetics brands are attracting increasing attention.
◇‘Platform Business’: Developed ’Next Engine’, a cloud (SaaS) EC Attractions for internet retailers that automates operations related to online shop operations and centrally manages order processing and inventory status for multiple shops across malls, and is provided to more than 6,000 companies, mainly medium-sized businesses. The scale of the business is on track for steady growth in sales and profits, with net sales of JPY 3.4 billion and segment profit of JPY 1.5 billion in FY04/2023, and is expected to benefit from the expansion of the EC market in the future. The company is strengthening its growth platform by developing small businesses, improving APRU by reviewing rates, Consulting Business, and developing a B2B Matching Platform Business. It also offers a hometown tax donation service business.
◇ Reorganisation: a share-distribution-type spin-off of NE Inc., the Platform Business, is planned for 2025, and NE Inc. will be listed on the stock exchange. Current shareholders of the company will become shareholders of two listed companies in the future, the company and NE Inc. The aim is to reflect the potential of the two businesses in the current share price in an appropriate and timely manner.
Q2 update for FY04/2024
◇Increased sales and profits: net sales of JPY 4.3 billion (+22% YoY), operating income of JPY 460 million (+41% YoY) and net income of JPY 330 million (+16% YoY), with both the Commerce Business and Platform Business recording increases in sales and profits. A closer look reveals both positive and negative factors, but in general, the results give rise to expectations of higher sales and earnings in the future. The full-year forecast remains unchanged, and although progress up to Q2 has been slow, Q3 results are important as performance tends to be weighted towards the second half of the year.
◇Points of interest:
Firstly, will the results in Q3, which is a busy period, increase the probability of achieving the full-year forecast?
Secondly, at what point will the profit contribution of the Cosmetics and Global business in the Commerce Business raise the level to grow the overall Commerce Business?
Thirdly, will the average customer spend in the Next Engine Business steadily turn positive?
Fourthly, when and how will PER and other valuation indices reassess the company’s growth potential and round up?
Table of contents
| Summary | 1 |
| Key financial data | 2 |
| Q2 results for FY04/2024 | 3 |
| Share price trend | 9 |
| Points of interest | 10 |
| Financial results | 11 |
| Useful information | 13 |
Key financial data
| Fiscal Year | FY4/2017 | FY4/2018 | FY4/2019 | FY4/2020 | FY4/2021 | FY4/2022 | FY4/2023 | |
| Net sales | JPY, mn | 8,502 | 9,377 | 10,303 | 11,325 | 12,364 | 13,413 | 14,038 |
| Ordinary profit | JPY, mn | 1,048 | 1,267 | 1,179 | 1,757 | 2,149 | 2,330 | 1,400 |
| Net profit attributable to owners | JPY, mn | 696 | 873 | 821 | 1,069 | 1,556 | 1,744 | 945 |
| Number of shares outstanding | Shares, mn | 15.8 | 16.1 | 16.1 | 16.1 | 16.3 | 16.3 | 16.3 |
| Net asset | JPY, mn | 2,756 | 3,597 | 4,189 | 4,824 | 6,528 | 8,253 | 8,961 |
| Total asset | JPY, mn | 4,240 | 5,042 | 5,761 | 8,097 | 8,339 | 10,518 | 12,320 |
| Book value per share | JPY | 170 | 216 | 254 | 297 | 405 | 513 | 557 |
| EPS | JPY | 44 | 55 | 51 | 67 | 98 | 110 | 59 |
| Equity to asset | % | 64 | 69 | 70 | 58 | 77 | 78 | 72 |
| ROE | % | 30 | 28 | 22 | 25 | 28 | 24 | 11 |
| Cash flow from operating activities | JPY, mn | 576 | 1,246 | 651 | 1,934 | 1,941 | 1,186 | 695 |
| Cash flow from investing activities | JPY, mn | -433 | -674 | -671 | -1,020 | -412 | -886 | -1,507 |
| Cash flow from financing activities | JPY, mn | 69 | -230 | -7 | 933 | -1,736 | 298 | 263 |
| Cash and cash equivalents at end of period | JPY, mn | 1,324 | 1,695 | 1,660 | 3,453 | 3,355 | 4,026 | 3,536 |
| Number of employees | Person | 233 | 285 | 309 | 353 | 387 | 403 | 428 |
Q2 FY04/2024 financial results trends
Hamee Corp. announced its financial results for Q2 FY04/2024 (Aug-Oct 2023) after the close on 14 December 2023.
Return to higher sales and profits
Q2 saw a recovery. This is impressive in view of the fact that in the Q1 of the year, operating profit and ordinary profit fell, and quarterly net profit attributable to owners of parent was negative (loss), despite a YoY increase in sales.
Net sales were JPY 4.3 billion (+22% YoY), operating income was JPY 460 million (+41% YoY), and net income was JPY 330 million (+16% YoY), with both the Commerce and Platform Business reporting higher sales and income.
According to IR materials, the progress of earnings up to Q2 shows that net sales and operating income in both segments have exceeded the initial forecasts.
Progress against full-year forecasts is low
Full-year forecasts remain unchanged.
Next, a review of progress to Q2 shows that net sales, operating margin income, ordinary income, and net profit attributable to owners of parent stood at 45%, 30%, 34%, and 13%, respectively. It is too early to judge that the full-year forecast is more likely to be achieved with the Q2 results.

Source: Omega Investment from company materials.
The company’s full-year forecast will only be determined once it has landed in Q3
However, as both the Commerce and Platform Business tend to be biased towards the second half of the year, it would be premature to judge that the possibility of missing the full-year forecast has increased.
In particular, there are many positive factors, such as the significant growth in net sales of cosmetics in the Commerce Business and the expected effects of the fee revision in the Platform Business in the second half of the year, which is the busy season.
Taking these points into account, we should wait for the Q3 results.
Company explanation of seasonal factors
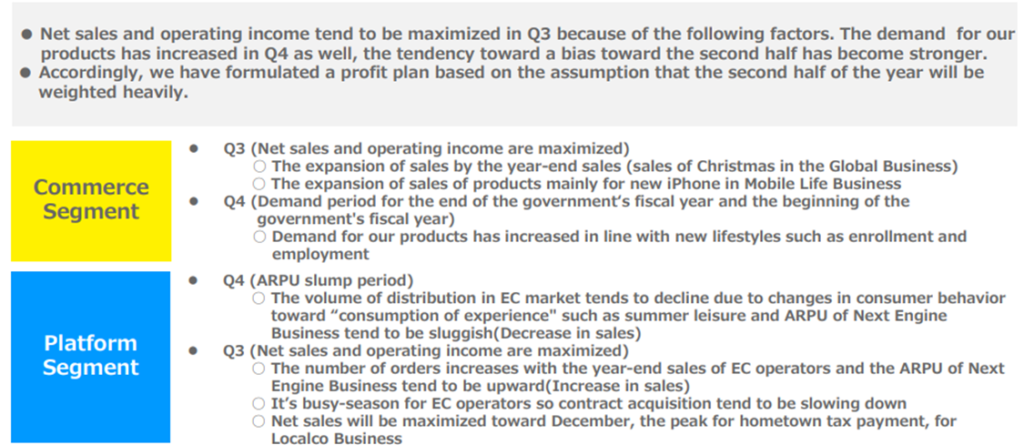
Source: Omega Investment from company materials.
Commerce Business
Increase in sales and profit
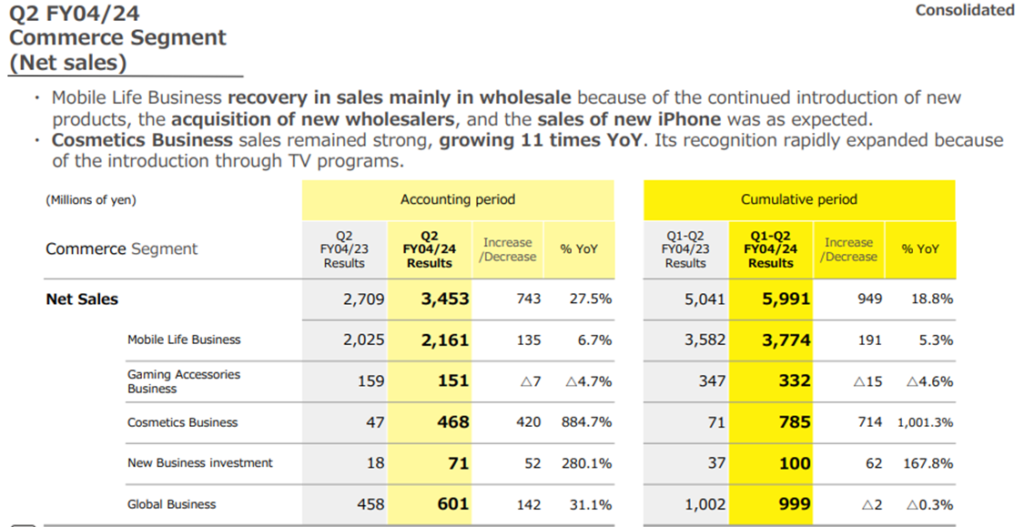
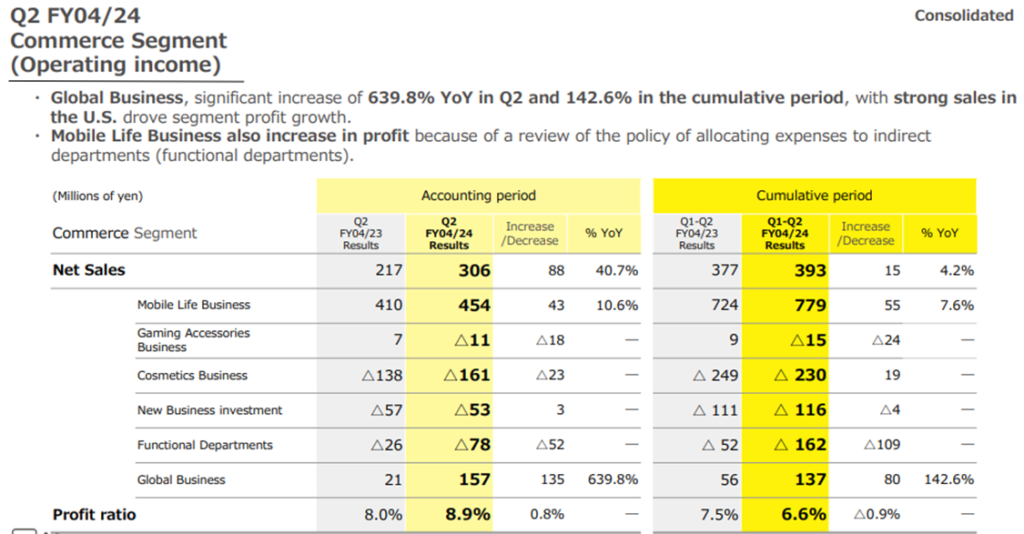
In Q2, the Commerce Business recorded net sales of JPY 3.5 billion (+28% YoY), a segment profit of JPY 300 million (+41% YoY) and a profit margin of 8.9% (+0.8 percentage points YoY).
The drivers of sales growth were Cosmetics Business, Global Business and then Mobile Life Business. In particular, the cosmetics business rapidly gained recognition, with net sales increasing 11 times YoY to JPY 470 million. In Global Business, overseas sales of Otamatone, which was taken over in January this year, are steadily growing. In the Mobile Life Business, wholesale sales have expanded and sales have steadily increased due to the roll-out of new products and the revitalisation of the new iPhone sales season.
On the other hand, the Gaming Accessories Business experienced a slight decline in sales due to tougher competition. However, the company is quickly working on expanding its product line-up and is expected to pick up from Q3 onwards.
In terms of profits, the Global Business, with its strong sales performance, saw a significant increase in profits. The Mobile Life Business also saw an increase in profits, but in some respects, the burden was lightened by a review of the cost distribution policy. On the other hand, the Gaming Accessories Business posted a slight operating loss due to weak net sales.
The Cosmetics business has been burdened by the costs of brand recognition and sales channel expansion, and despite a significant increase in sales, the loss has widened slightly YoY. It remains to be seen how this deficit will narrow and turn into a profit contribution.
Source: Omega Investment from company materials
Source: Omega Investment from company materials
Platforms business
Increase in sales and profit
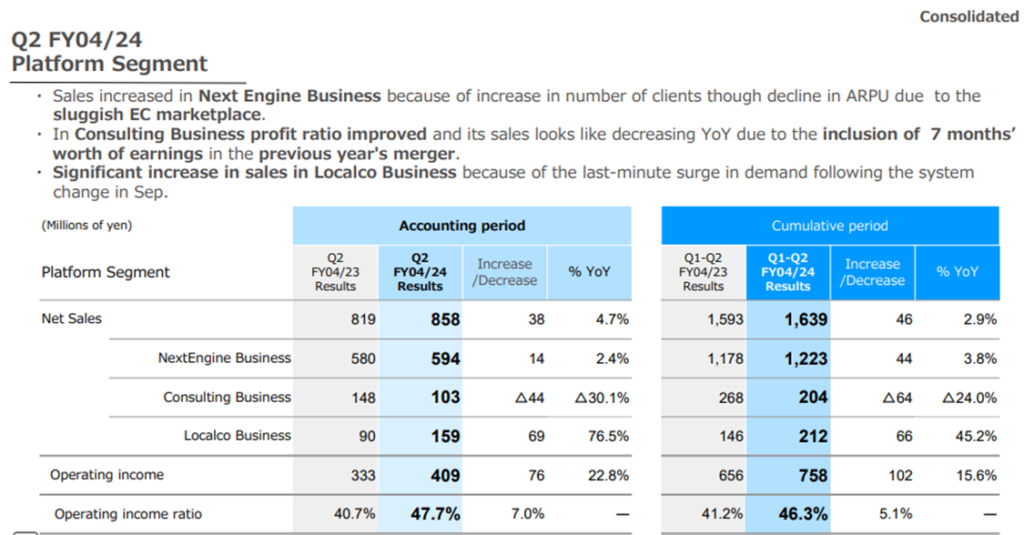
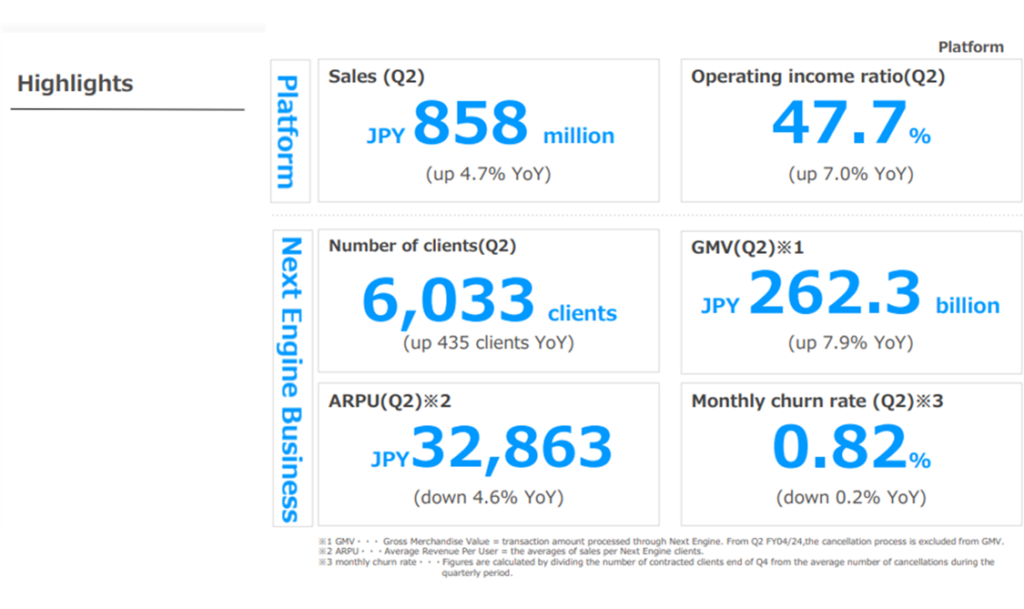
In Q2, the Platform Business recorded net sales of JPY 860 million (+5% YoY), a segment profit of JPY 410 million (+23% YoY) and a profit margin of 47.7% (+7.0 percentage points YoY).
Net sales in the core Next Engine Business amounted to JPY 590 million (+2% YoY), with the rate of increase remaining low.
KPIs show a steady increase in the number of clients to 6,033, with a net increase of 116 during the period, a low monthly churn rate and a solid GMV of JPY 262.3 billion (+7.9% YoY).
On the other hand, ARPU was JPY 32,863 (-4.6% YoY), which can be regarded as the main reason for the sluggish growth in NextEngine’s net sales. The August-October period is seasonal, with consumption shifting from goods to services, and the number of orders also appears to be suppressed.
However, the seasonality is expected to turn into a tailwind from now on, and the positive effects of the price revision are also likely, so the results in Q3 will be of interest.
Q2 results were underpinned by the hometown tax donation support Localco Business. In the period under review, transactions are expected to have been brought forward compared to previous years due to changes in the hometown tax donation system in October. Therefore, Q3 performance is expected to be more subdued than in last years.
In general, Next Engine Business struggled a little, but there is a virtuous cycle of a solid customer base and well-timed support from Localco Business for the segment as a whole. On 8 December, a collaboration with Mercari Inc. was announced, which is expected to expand customer base and raise ARPU. The impression is that the company is responding agilely to changes in the business environment and taking the necessary steps.
Source: Omega Investment from company materials.
Source: Omega Investment from company materials.
Reorganisation, etc.
A share-distribution-type spin-off of NE Inc. and a spin-off IPO of NE Inc. were announced on 14 July 2023. No new information on this is currently explicitly disclosed.
Share price trend
Hamee share price trends

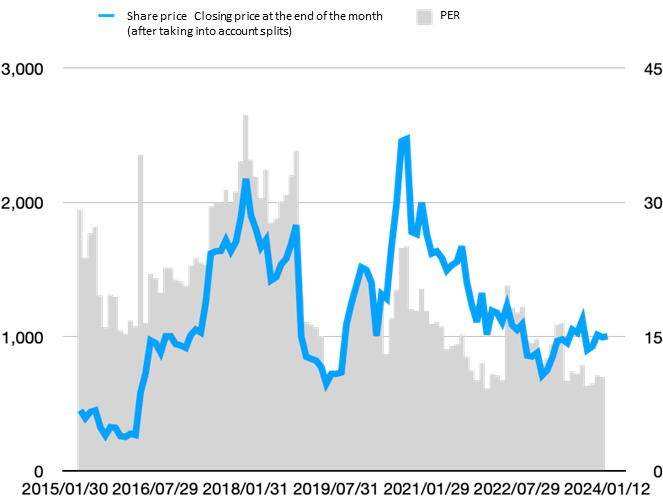
The month-end closing price of the company’s share price and EPS by year (FY04/2024 is the company’s forecast), as well as the share price and PER (price-to-earnings ratio), are shown in this graph.
The reaction of the share price after the Q2 results announcement was a drop and then a recovery, with the share price just before the announcement and in recent days at almost the same level. The main reason for this is that, despite the positive results in terms of increased sales and profits, progress against the full-year plan was low. As a result, the PER remains low at around 10x the company’s full-year EPS forecast. This multiple looks a little modest for an e-commerce manufacturing and sales business and for what is an e-commerce platform.
From a different perspective, the company has the potential for a significant positive valuation change depending on its growth potential and its content. For this reason, the focus of attention on Q3 results is likely to be extremely high.
Points of interest
As mentioned above, Q2 results were generally strong, leading to expectations for Q3. However, the share price reaction to the results has been mild, suggesting that the stock market still considers the company’s full-year forecasts to be less certain.
If Q3 is a good Q3 and the content of the business performance is positive, suggesting medium-term growth, there is a strong possibility that valuations will expand and provide significant investment attraction.
The following points are of particular interest in the run-up to the Q3 results.
Firstly, will the results in Q3, which will be a busy period, increase the probability of achieving the full-year forecast?
Secondly, when will the cosmetics business in the commerce segment turn profitable and subsequently play a role in driving net sales and profits? Will the Global Business play another profit-driving role?
Thirdly, will the Next Engine Business penetrate and establish itself as a platform? Will the average revenue per customer (ARPU) turn to an increasing trend, especially after the price revision?
Finally, when will PER and other valuation indicators reassess and expand the company’s growth potential?
Financial results
Full-year financial results
Financial period |
FY4/2017 |
FY4/2018 |
FY4/2019 |
FY4/2020 |
FY4/2021 |
FY4/2022 |
FY4/2023 |
FY4/2024 |
FY4/2025 |
FY4/2026 |
Consolidated, Japanese GAAP |
Company forecast |
Medium-term
|
Medium-term
|
|||||||
[Statements of income] |
||||||||||
Net sales |
8,502 |
9,377 |
10,303 |
11,325 |
12,364 |
13,413 |
14,038 |
16,813 |
19,408 |
22,515 |
Operating income |
1,106 |
1,380 |
1,164 |
1,745 |
2,180 |
2,202 |
1,271 |
2,086 |
2,754 |
3,323 |
Ordinary profit |
1,048 |
1,267 |
1,179 |
1,757 |
2,149 |
2,330 |
1,400 |
2,069 |
||
Net profit before income taxes |
1,010 |
1,259 |
1,179 |
1,582 |
2,144 |
2,463 |
1,396 |
|||
Net profit attributable to owners of the parent |
696 |
873 |
821 |
1,069 |
1,556 |
1,744 |
945 |
1,537 |
||
[Balance Sheets] |
||||||||||
Total assets |
4,240 |
5,042 |
5,761 |
8,097 |
8,339 |
10,518 |
12,320 |
|||
Total liabilities |
1,484 |
1,445 |
1,572 |
3,272 |
1,811 |
2,265 |
3,360 |
|||
Total net assets |
2,756 |
3,597 |
4,189 |
4,824 |
6,528 |
8,253 |
8,961 |
|||
Total borrowings |
468 |
298 |
500 |
1,740 |
104 |
544 |
1,300 |
|||
[Statements of cash flows] |
||||||||||
Cash flow from operating activities |
576 |
1,246 |
651 |
1,934 |
1,941 |
1,186 |
695 |
|||
Cash flow from investing activities |
-433 |
-674 |
-671 |
-1,020 |
-412 |
-886 |
-1,507 |
|||
Cash flow from financing activities |
69 |
-230 |
-7 |
933 |
-1,736 |
298 |
263 |
|||
Cash and cash equivalents at end of period |
1,324 |
1,695 |
1,660 |
3,453 |
3,355 |
4,026 |
3,536 |
|||
[Efficiency] |
||||||||||
Ratio of ordinary profit to sales |
12% |
14% |
11% |
16% |
17% |
17% |
10% |
12% |
||
ROA |
19% |
15% |
15% |
19% |
18% |
8% |
||||
ROE |
30% |
28% |
22% |
25% |
28% |
24% |
11% |
|||
[Per-share] Unit : JPY |
||||||||||
EPS |
44 |
55 |
51 |
67 |
98 |
110 |
59 |
94 |
||
BPS |
170 |
216 |
254 |
297 |
405 |
513 |
557 |
|||
DPS |
4.5 |
5.5 |
6.5 |
7.0 |
10.0 |
22.5 |
22.5 |
22.5 |
||
[Number of employees] |
||||||||||
Number of consolidated employees |
233 |
285 |
309 |
353 |
387 |
403 |
428 |
(Million of yen)
Source: Omega Investment from company materials.
Rounding half up
Key PL items
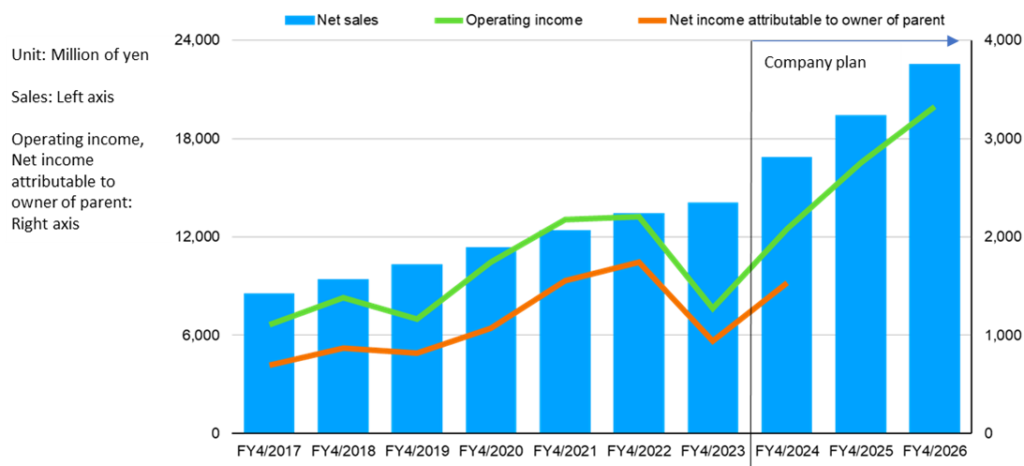
Sales, operating margin, and ROE

Source: Omega Investment from company materials.
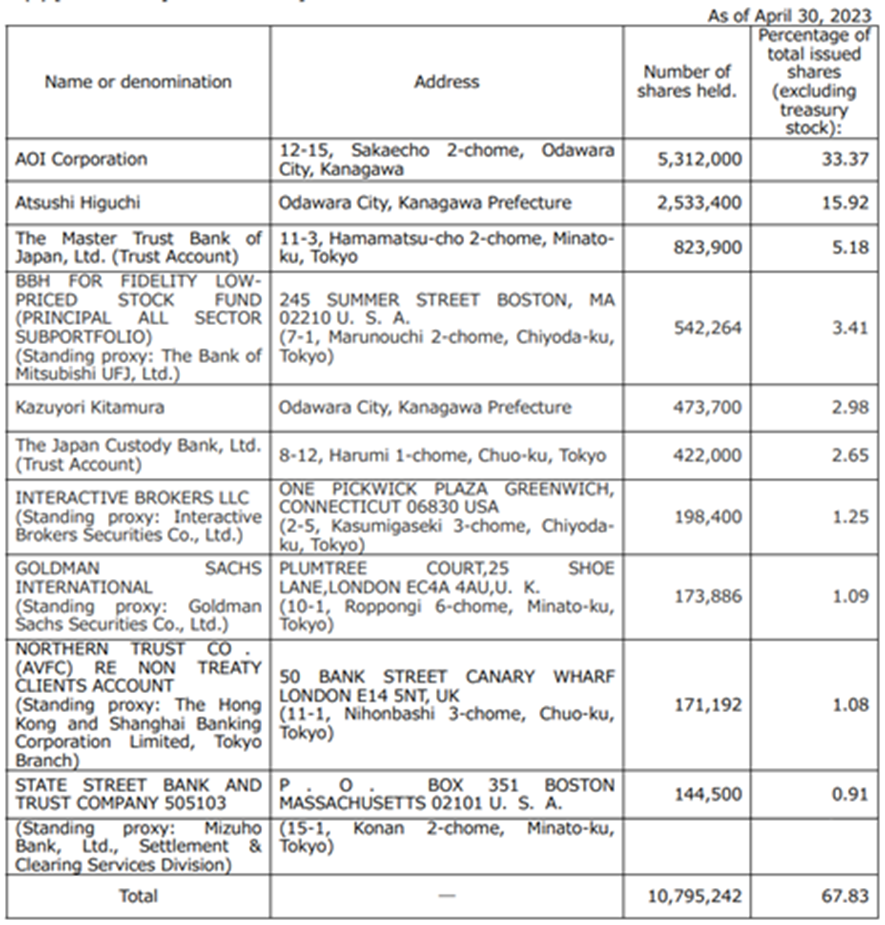
Useful information
Principal shareholders
Shareholder composition
