2026-07-15
Home
Japanese

Omega Investment Co., Ltd.
BlueMeme (Company note – Basic report)

| Share price (1/29) | ¥1,249 | Dividend Yield (24/3 CE) | – % |
| 52weeks high/low | ¥2,350 / 1,029 | ROE(TTM) | 7.3 % |
| Avg Vol (3 month) | 13.2 thou shrs | Operating margin (TTM) | 3.29 % |
| Market Cap | ¥4.4 bn | Beta (5Y Monthly) | 0.16 |
| Enterprise Value | ¥2.1 bn | Shares Outstanding | 3.562 mn shrs |
| PER (24/4 CE) | 22.6 X | Listed market | TSE Standard |
| PBR (23/4 act) | 1.71 X |
| Click here for the PDF version of this page |
| PDF Version |
Pioneering Japan’s digital transformation (DX) with low-code and Agile development
Summary
◇BlueMeme has been a pioneer in Japan since the days when the terms ‘low-code’ and ‘Agile’ development were not familiar at all. It has specialised in low-code development since its establishment in 2006. In recent years, low-code and Agile development has become a key development concept as Japanese companies are challenged to transform themselves through DX. The company is actively expanding its investment to expand its unique automation concepts, such as Digital Labour and business architects. Although the company is investing in the immediate future, if these development concepts prove effective and the automation of system development progresses, a significant leap forward in terms of profitability can be expected.
◇Issues concerning DX and low-code development in Japan: The low level of progress in DX by Japanese companies compared to other countries has become a significant issue in the wake of the outbreak of COVID-19. In particular, the status of DX initiatives in small and medium-sized enterprises (SMEs) is extremely low compared to large enterprises. On the other hand, the shortage and uneven distribution of IT personnel in Japan are significant challenges for the spread of DX. The low-code platform proposed by the company is one effective solution to these issues. It is expected to contribute substantially to the future progress of DX in Japan.
◇Low-code development market expected to grow at a high rate: The global low-code related market is worth USD 18,469 million (2021) and is expected to grow at a CAGR of 20%. The low-code development market in Japan is worth 100 billion yen and is expected to grow at a CAGR of 37%. However, it is small in size compared to the information services industry as a whole. In other words, there is a large potential market. Hence, the company’s growth potential is high.
◇Growth strategy: The company announced its medium-term management plan on 14 November 2023. It aims to achieve sales of 4.1 billion yen and an operating profit of 920 million yen in FY3/2026 due to up-front investments made to date. After that, the company aims to achieve sales of 10 billion yen in FY3/2028, with a CAGR of +56.2%.
The key points for realising this growth are,
(1) Strengthen the research and development system for digital labour and promote its practical application.
(2) Shifting the billing format from person-monthly person-hours to the volume of applications generated.
(3) Expand the number of business architects capable of providing high-unit-price services.
(4) Expand indirect sales in collaboration with partner companies.
Along with these, the company has set out concrete policies.
◇Earnings trends: The company’s full-year results for FY3/2023 showed sales of 2,244 million yen (up 16%), operating profit of 309 million yen (down 15%) and net profit attributable to owners of parent of 230 million yen (down 9%). Although both Professional Services and software licence sales were robust, driven by domestic DX demand, the results for the year were lower due to upfront investment, mainly in Digital Labour.
The forecast for FY3/2024 is for an 18% increase in revenue and a slight increase in operating profit.
◇Stock price trends: The company’s share price fell by 18% on 15 November following the announcement on 14 November 2023 of lower profits in its 2Q FY3/2024 results. The company announced the above medium-term management plan in conjunction with the result announcement. However, there were strong concerns among investors that upfront investment in Digital Labour had so far been too much, putting pressure on profits. The medium-term management plan sets out a specific growth strategy with Digital Labour as a critical factor, along with numerical targets. If the subsequent strategies bear fruit, there could be a rapid improvement in profitability. We would expect the share price to turn around as the management team achieves results in line with the medium-term management plan.
Table of contents
| Summary | 1 |
| Key financial data | 2 |
| Company profile | 3 |
| History | 3 |
| Group overview / Business chart/Orders received by customer sector | 5 |
| Business overview | 6 |
| Low-code market trends | 6 |
| Features and strengths of BlueMeme | 8 |
| Financial results | 10 |
| Full-year results for FY3/2023 | 10 |
| 2Q results for FY3/2023 | 11 |
| FY3/2024 full-year forecast | 12 |
| Growth strategy | 12 |
| Stock information, etc. | 16 |
| Share price trend | 16 |
| Major shareholders / Shareholder return policy | 18 |
| Corporate governance and the top management | 18 |
| Terminology | 21 |
| Financial data | 22 |
Key financial data
| Fiscal Year | 2019/3 | 2020/3 | 2021/3 | 2022/3 | 2023/3 | 2024/3 (Forecast) |
| Net sales | 1,496 | 1,800 | 2,101 | 1,929 | 2,244 | 2,650 |
| Cost of sales | 1,036 | 1,275 | 1,410 | 885 | 1,132 | – |
| Gross profit | 461 | 524 | 691 | 1,044 | 1,111 | – |
| SG&A expenses | 374 | 492 | 515 | 680 | 801 | – |
| Operating profit | 87 | 31 | 175 | 363 | 309 | 310 |
| Ordinary profit | 86 | 30 | 174 | 348 | 310 | 310 |
| Net profit | 61 | 10 | 130 | 253 | 230 | 230 |
| Current assets | 814 | 1,073 | 1,179 | 2,754 | 2,794 | – |
| Cash and deposits | 363 | 584 | 645 | 2,356 | 2,224 | – |
| Non-current assets | 202 | 199 | 206 | 201 | 222 | – |
| Total assets | 1,016 | 1,272 | 1,386 | 2,956 | 3,016 | – |
| Total liabilities | 668 | 914 | 862 | 601 | 429 | – |
| Total net assets | 348 | 358 | 523 | 2,354 | 2,587 | – |
| Equity ratio (%) | 34.3 | 28.1 | 37.8 | 79.6 | 85.8 | – |
| Cash flow from operating activities | -65 | 174 | 182 | 338 | 94 | – |
| Cash flow from investing activities | -148 | -13 | -21 | -9 | -46 | – |
| Cash flow from financing activities | 279 | 59 | -100 | 1,381 | -179 | – |
| Cash and cash equivalents at end of period | 363 | 584 | 645 | 2,356 | 2,224 | – |
Note: From FY3/2022, the new accounting standard for revenue recognition (new standard) is applied. Therefore, there is no continuity between FY3/2021 and FY3/2022 onwards.
Source: Omega Investment from company materials
Company profile
BlueMeme provides unique contract development services specialising in Agile methods and low-code technology under the corporate philosophy of ‘creating new value, changing norms, and evolving culture’. Its mission is to “improve the international competitiveness of Japanese companies” by utilising the latest low-code development tools and its unique development methodology, Agile-DX, to increase the development productivity of engineers and promote DX in domestic companies.
The company’s DX business utilises OutSyetems, a globally acclaimed low-code development tool, and Agile-DX, the Group’s proprietary project management method.
The single segment of the DX business can be broadly divided into the following two services.
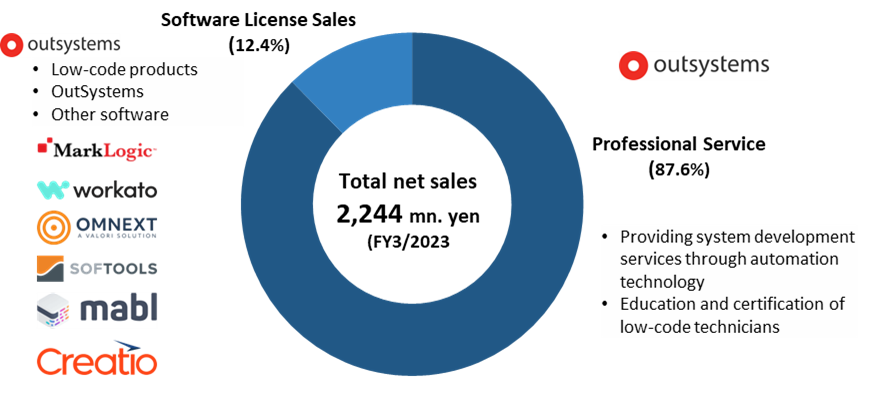
Professional Services: Contract development services and training for engineers using Agile-DX, featuring OutSystems and Agile-DX, to provide stable system development with high customer satisfaction in a short time and with a small team. Professional Services consist mainly of contract development, with 96% providing contract development services using automation technology and 4% providing training for engineers. The company’s revenue model is flow-based due to contracted development, with sales of 1,966 million yen in FY3/2023.
Software License Sales: The company sells low-code development tools and other software. The company has been a distributor for OutSystems since 2012, selling OutSystems’ low-code development platform. In recent years, the company has been selling software licences as a distributor for companies other than OutSystems, including MarkLogic Corp (US), Workato (US), mabl Inc. (US). and Creatio Inc. (US).In recent years, the company has also sold software licences as a distributor for companies other than OutSystems, including MarkLogic Corp. Sales for FY3/2023 were 277 million yen*.
*In Software License Sales, previously, cost plus profit was recognized as net sales and allocated proportionally over the contract period, but starting from FY2022/3, a new accounting standard for revenue recognition has been applied, and only profit is recognized as net sales and recorded as a lump sum in the month the contract begins. Therefore, Software License Sales have decreased significantly since FY2022/3 compared to FY2021/3.
Sales by Segment
Source: Omega Investment from company materials
History
The company was established in December 2006 in Shinsuna, Koto-ku, Tokyo. It is interesting to note that INTEC IT Capital (now SX Capital Co., Ltd.), a venture capital company of INTEC Corporation (now a group company of TIS (TSEP: 3626), was involved in the establishment of the company. INTEC, an existing major system integrator, invested in the company as an external venture with an open innovation concept when it entered a new field. was involved in the company’s establishment. In August 2009, Masanori Matsuoka from INTEC IT Capital was seconded to the company, and in May 2010, he was appointed representative director. Since then, the company has expanded its business under Matsuoka’s leadership.
In April 2011, the business development consulting business combined with low-code development was launched.
In October 2012, the company signed a distributor agreement with OutSystems Software Em Rede, S.A. (Portugal, now headquartered in the United States), which will subsequently become the company’s low-code development platform, and started selling IT system contract development services using OutSystems’ low-code development platform and Agile methods. In October 2013, the company signed a sole agency agreement with OutSyetems in Japan. In August 2018, it started providing the Agile-SDK, the predecessor of its original development method, Agile-DX. Since then, the company has continued to expand its business, specialising in low-code, including supporting the introduction of low-code development platforms and technical consulting business and providing technical training for low-code development.
In December 2017, OPENMODELS, a company specialising in low-code development and Agile methods, was established as a wholly-owned subsidiary; on 29 June 2021, the company was listed on the Mothers market of the Tokyo Stock Exchange (now the TSE Growth Market). In April 2022, the company established a venture investment subsidiary, BlueMeme Partners Ltd. In the same month, the company announced a capital and business alliance in the low-code business with MITSUI KNOWLEDGE INDUSTRY Co., Ltd. to develop the low-code business further. In the capital and business alliance, 504,000 of the shares in the INTEC IT No. 2 investment limited partnership were transferred, allowing the original shareholders to exit the partnership. The investment partnership’s ranking of major shareholders dropped from No. 1 to No. 7 (equity share of 3.73%). Instead, MITSUI KNOWLEDGE INDUSTRY Co., Ltd. became the first major shareholder with a 20.89% stake.
| Year | Month | Item |
| 2006 | Dec. | BlueMeme Inc. is established in Shinsuna, Koto-ku, Tokyo. |
| 2010 | May | Masanori Matsuoka is appointed as the representative director. |
| 2010 | Jul. | Business analysis and business modelling projects for developing business systems are launched. |
| 2011 | Apr. | Start of business system development consulting business combined with low-code development. |
| 2012 | Oct. | The first Japanese distributorship agreement was signed with OutSystems Software Em Rede, S.A., Portugal (currently headquartered in the USA), which deals with low-code development platforms. |
| Launches IT systems contract development services using Agile methods based on low-code development platforms. | ||
| 2013 | Oct. | The sole agency agreement was signed with OutSystems for Japan. |
| Start of low-code development platform implementation support and technical consulting business. | ||
| 2014 | Jun. | Technical training in low-code development for user companies is now available. |
| 2014 | Nov. | Fukuoka office opens in Fukuoka City, Fukuoka Prefecture. |
| 2017 | Jun. | Yokohama office opens in Yokohama, Kanagawa Prefecture. |
| 2017 | Dec. | OPENMODELS, a company specialising in low-code development and Agile methods, is established as a wholly-owned subsidiary. |
| 2018 | May | Collaboration agreement with Omnext B.V., Netherlands, a provider of model analysis services. |
| 2018 | Aug. | Signed a distributorship agreement with MarkLogic Corporation of the USA, which handles next-generation databases. |
| Agile-SDK, the predecessor to Agile-DX, is now available. | ||
| 2019 | Mar. | Following the establishment of OutSystems Japan K.K., a distributorship agreement was signed with the company. |
| 2019 | Aug. | Okinawa office opens in Naha City, Okinawa. |
| 2020 | Apr. | A distribution agreement was signed with Workato, Inc. of the USA, a provider of cloud service collaboration platforms. |
| 2020 | Oct. | Joint research and demonstration tests on our development methodology Agile-DX are launched with Cambridge Technology Partners Ltd. |
| 2021 | Jan. | Distribution agreement signed with Cognite Ltd. |
| 2021 | Jun. | Listed on the Mothers market of the Tokyo Stock Exchange (now the TSE Growth Market) (29 June). |
| 2022 | Mar. | Distribution agreement with US-based mabl Inc., which provides a test automation platform. |
| Mar. | Signed a distributorship agreement with US-based Creatio Inc., which provides a no-code/low-code development platform. | |
| 2022 | Apr. | BlueMeme Partners Inc. is established as a subsidiary of venture investment business. |
| Transition from the Mothers market to the Growth market as a result of a review of the Tokyo Stock Exchange market classification. | ||
| Capital and business alliance with MITSUI KNOWLEDGE INDUSTRY Co., Ltd. in the low-code business. | ||
| Start of joint research with Kyoto University on genome analysis using quantum computers. | ||
| Aug. | AGILA-DX platform, a no-code BPM platform compliant with Agile-DX, goes on sale. | |
| Dec. | A distribution agreement was signed with US-based GenRocket, Inc., which provides an AI-based platform for automatic synthetic data generation. | |
| Agile-SaaS, a new service, was launched. | ||
| 2023 | Apr. | Started joint research with Kyushu University for the construction of big language models using quantum AI. |
| Jun. | Subsidiary OPENMODELS signed a domestic agency agreement with Creatio on behalf of BlueMeme. | |
| Jul. | Became Japan’s first OutSystems Premium Partner. | |
| Launched LeapLeaper, an owned media offering a wide range of information on technology. | ||
| Oct. | Established a joint research department for network AI statistical analysis with Kyushu University. | |
| Nov. | BlueMeme Partners launched BlueMeme first fund. |
Source: Omega Investment from company materials
Group overview
As seen in the History section, the company group consists of three companies: the company, OPENMODELS Corporation, which operates a platform business, and BlueMeme Partners Corporation, which conducts venture investment business. The company has three offices in Japan: Fukuoka, Kumamoto, and Okinawa. In addition, the company has a Dutch office in Rotterdam, the Netherlands.
MITSUI KNOWLEDGE INDUSTRY Co., Ltd. currently holds 20.68% of the company’s shares as the largest shareholder. Following the capital tie-up, in August 2022, the company announced it would provide Digital Labour services jointly with MITSUI KNOWLEDGE INDUSTRY Co., Ltd. The two companies plan to continue to cooperate in the low-code sector.
Business chart
The business structure diagram is as follows. In providing system development services, which account for over 80% of the company’s sales, the company uses the low-code platform of software product provider OutSystems as a development platform. It provides system development services to client companies.
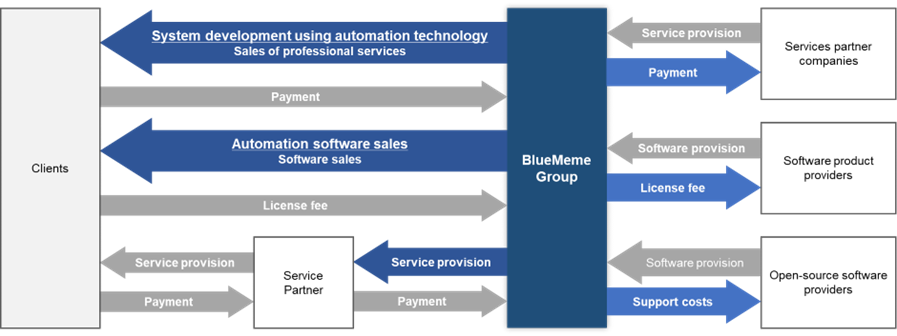
Source: Company materials
Orders received by customer industry
Refer to the chart below for the distribution of order intake across different industries. Although manufacturing, service, and construction sectors make notable contributions, the portfolio is diversified, minimizing industry-specific biases and enhancing risk management.
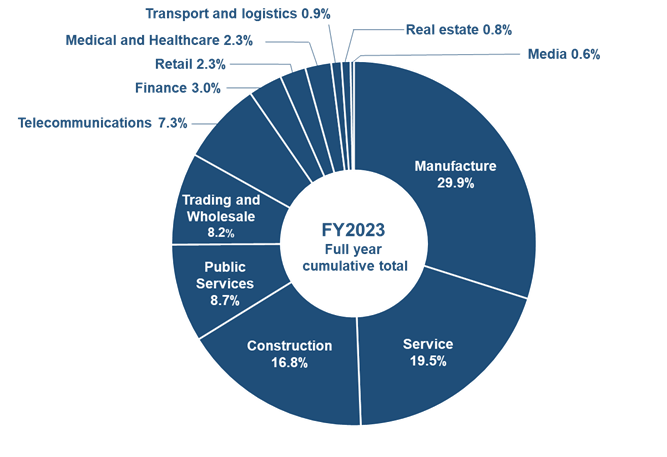
Source: Company materials
Business overview
Low-code market trends
Challenges facing the DX and ICT industry in Japan
In recent years, the decline in the international competitiveness of Japanese companies has become a significant concern, with issues such as the delay in systemisation within companies and low white-collar productivity. The diagram below compares the status of DX implementation in Japan, the US and Germany. Despite various past circumstances, including cultural backgrounds, the manufacturing and non-manufacturing sectors are far behind the two countries. DX is not simply about moving existing business processes onto a system but about changing the business model in line with the internet age, which is a significant challenge for Japanese companies.
Comparison of DX progress (WB tabulation)
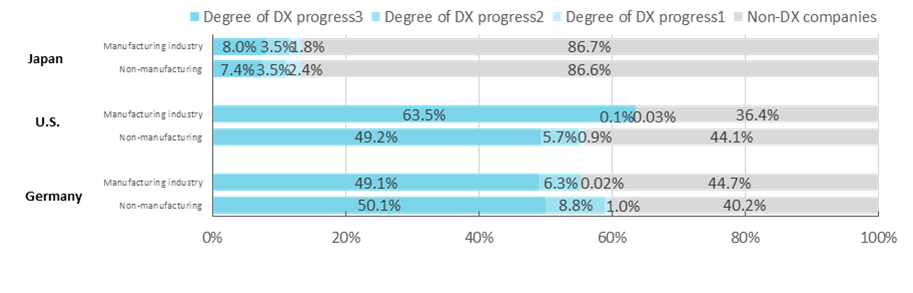
Note: Concerning the level of DX progress, the order is 3>2>1, indicating that specific concrete concrete initiatives on DX are in progress. Non-DX companies represent companies that have not made any DX efforts to date. Weighted according to industry size composition (WB tabulation).
Source: Prepared by Omega Investment, based on InfoCom Research, Inc.’s ‘Contracted Research Study on the Impact of Digital Transformation on the Economy’ (March 2021).
Furthermore, looking at the status of DX initiatives by business size of domestic companies shows that, compared to large companies, SMEs need to catch up in introducing DX. It is true that investment in ICT is difficult without financial resources. However, analysis of the Information Research Institute’s report above also shows a correlation between progress in DX and increased sales, suggesting that SMEs must also actively introduce DX in the future. The company also provides in-house development support services for SMEs to promote DX.
Status of DX initiatives (Japan)
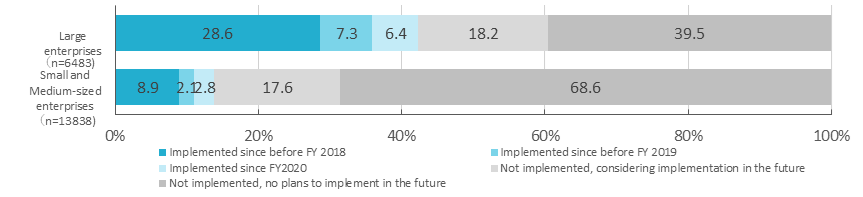
Source: Prepared by Omega Investment from Ministry of Internal Affairs and Communications (2021) ‘Research Study on the Impact of Digital Transformation on the Economy’.
On the other hand, a significant challenge for the spread of DX in Japan is the problem of a shortage of IT personnel. According to estimates by the Ministry of Economy, Trade and Industry (METI), there will be a shortage of up to 790,000 IT personnel by 2030. Furthermore, a large proportion of IT personnel in Japan are engaged in the IT industry, such as hardware manufacturers and system integrators, and there are limited opportunities for IT engineers to work in industries other than IT, which is one of the reasons why IT has not progressed well in Japan. (see next page, above). The company’s low-code platform and the Digital Labour it advocates will make a significant contribution to eliminating this uneven distribution of IT personnel and promoting system development within non-IT companies.
Comparison of industries in which IT personnel are engaged in different countries
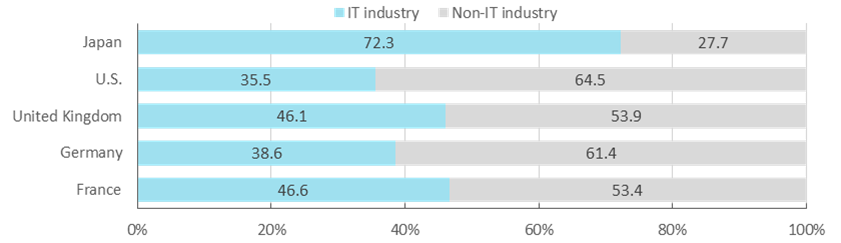
Source: Omega Investment, based on the Annual Economic and Fiscal Report 2022, Cabinet Office.
The low-code market is expected to expand in the future
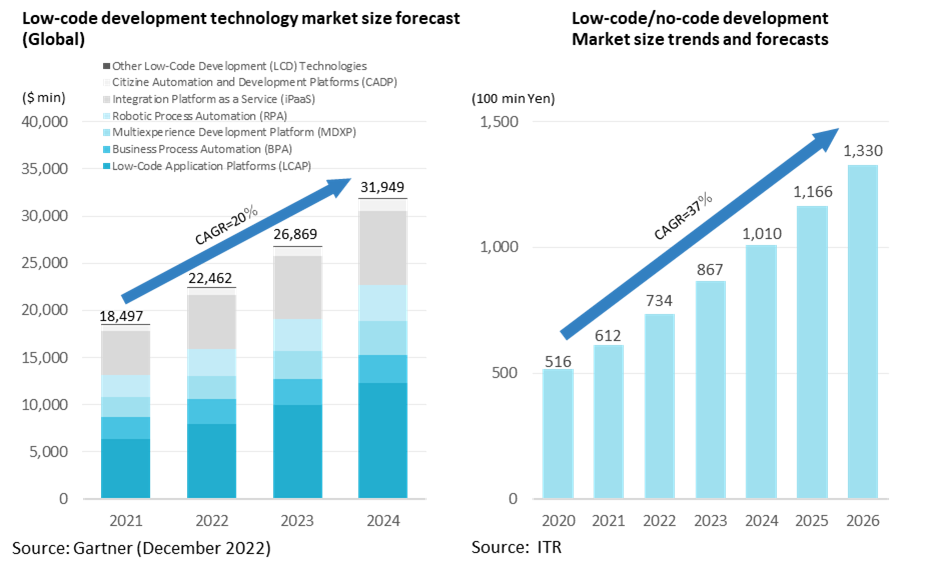
Under these circumstances, low-code-related platforms are expected to grow rapidly. The details of low-code are discussed below, but according to a Gartner study, the global low-code development technology market was worth USD 18,947 million in 2021 and is expected to grow at a CAGR of +20% to reach USD 31,949 million by 2024. Of this, the Low-Code Application Platform offered by the company is expected to grow at a CAGR of +25%, from USD 6,324 million in 2021 to USD 12,351 million in 2024.
Meanwhile, the size of the domestic low-code/no-code market was 51.6 billion yen in 2020. It is expected to expand at a CAGR of +37% thereafter, reaching 133 billion yen by 2026. The market size of Japan’s information services industry is still tiny in comparison with the total market size of the software industry, information processing and provision services industry and internet ancillary services industry, which is 19,162.9 billion yen, according to the Survey of Selected Service Industries (2018) by the Ministry of Economy, Trade and Industry. In addition, not all software development will be replaced by low-code/no-code. In other words, there is a large potential market.
Features of low-code development
There are high hopes for low-code, Agile-type development as an effective response to these challenges facing the Japanese IT industry. Conventional system development by system integrators and others, known as the waterfall approach, attempts to improve productivity by introducing computer systems into existing business structures.
Comparison of waterfall method and Agile method development
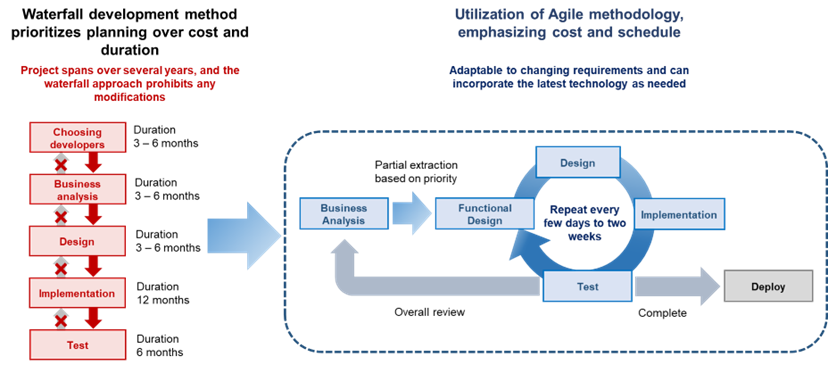
Source: Company materials
Scratch development requires coding from scratch, which lengthens the development period and involves large development costs. Once the specifications have been finalised, it is difficult to change them in the middle of the process, and problems can arise, such as actual development taking longer than envisaged initially or incurring a significant cost increase.
On the other hand, low-code development is a technology for quickly developing systems with minimum coding and by preparing standard-level codes, scripts and integration environments in advance. Low-code technology also enables the development of Agile methods, which differ from one-way waterfall methods. Agile methods allow for repeating the planning, design, development and testing processes in small cycles of functional units, making it possible to respond to changes in specifications midway through the process.
Since the Internet has become commonplace, advances such as web1, web2, and web3 have been coming in cycles of over ten years, and the lifespan of the business model itself is shortening in the Internet age. In such an era of rapid change, it is difficult to cope with waterfall-type development, and the DX of system development itself can be described as low-code, Agile development.
Features and strengths of BlueMeme
The company quickly recognised such changes in the development environment and, in 2011, launched a business system development consulting business combined with low-code development. In 2012, it began handling products from OutSystems, a globally acclaimed low-code development platform. Currently, more than 90% of the company’s sales are OutSystems-related services.
Development of OutSystems and progress in the company’s low-code business
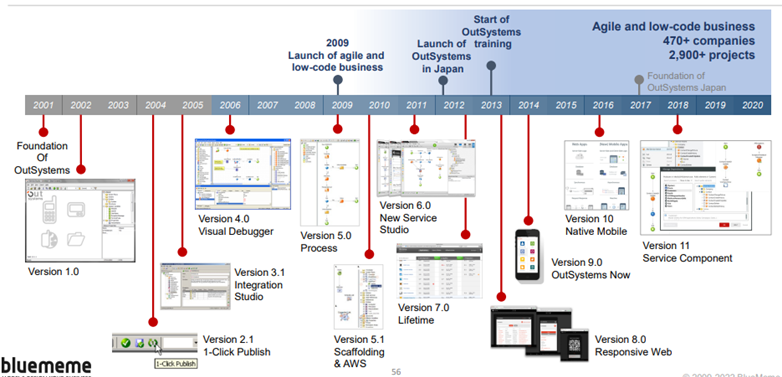
Source: Company materials
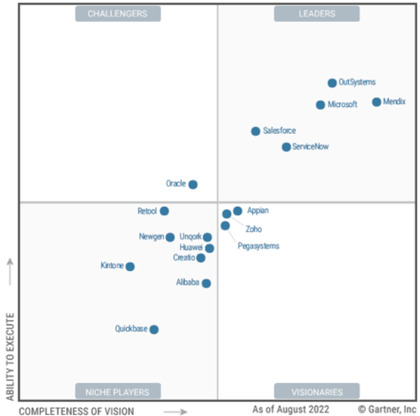
OutSystems: a leader in low-code development platforms
Low-code development platforms are offered by specialist low-code vendors such as OutSystems, as well as major software vendors such as Microsoft, Oracle and Salesforce. OutSystems’s products and services are highly regarded in this context. The company currently has offices in 13 countries and territories. It has more than several thousand customers, mainly major corporations. More than 600,000 developers develop on the company’s low-code development platform.
The left-hand chart shows the Magic Quadrant by Gartner, Inc., which positions each player based on qualitative data analysis methods. OutSystems has been selected as one of the leaders for the sixth consecutive time. The company has received top marks for completeness of vision and ability to execute.
OutSystems’ products can create complex applications and components with low-code development, differentiating them from its competitors. And they also have enterprise-level platform capabilities and scalability. Furthermore, they are also rated as offering robust security, multi-experience development and AI-enhanced development capabilities.
The company’s remarkable foresight in recognizing the high competitive advantage of OutSystems’ LCAP (Low-Code Application) over a decade ago is worthy of attention.
Standardisation through the unique Agile-DX
Although the Agile development method is compatible with low-code, it is generally insufficient in some respects for application to enterprise-level development. The company has developed and offers its development method, Agile-DX, which standardises the business analysis and requirements definition methods lacking in Agile methods.
In low-code development using conventional methods, methods for upstream processes such as business analysis, requirements definition and functional design are not defined, and methods for testing are often not defined. As a result, it was not easy to increase development speed, even with low-code development. The company focused on this point and added a missing method to the agile methods. By shortening development duration, reducing development person hours and curbing wasteful IT investment, the company has made it possible to speed up low-code development significantly.
In March 2022, the company partnered with mabl, Inc. (USA), a provider of test automation platforms. The aim is to develop next-generation testing processes.
Agile-DX concept
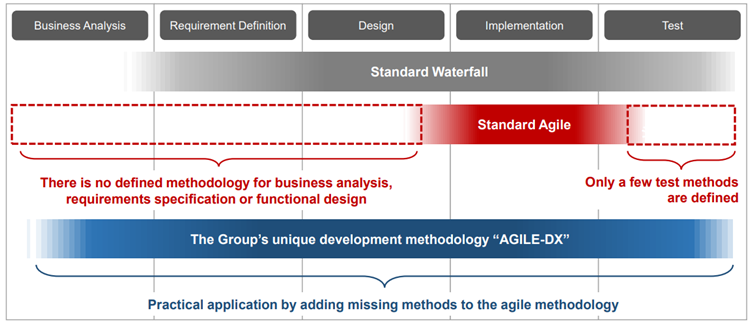
Source: Company materials
A new service, Digital Labour, launched
The company aims to transform its low-code system development methods further and use AI-based virtual workers, ‘Digital Labour, ‘ to automate the process without relying on human hands. Beyond that, the company is planning to further cultivate talents known as “business architects” and is also envisioning a future engineer profile capable of addressing a broader range of responsibilities.
Financial results
Changes in net sales /operating profit (quarterly)
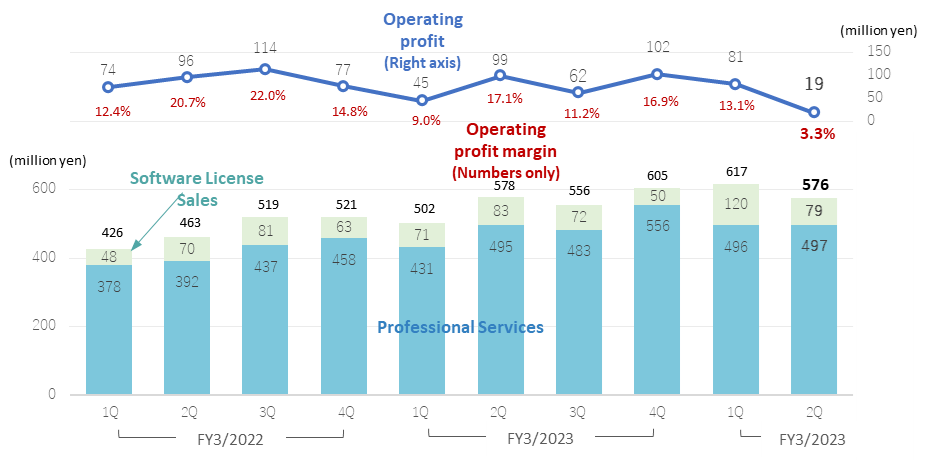
Note: From FY3/2022, the new revenue recognition accounting standard (new standard) is applied. Therefore, there is no continuity between the period up to FY3/2021 and FY3/2022 onwards. The impact on Professional Services is minor, but the impact on Software License Sales is significant.
Source: Omega Investment from company materials
FY3/2023 financial results
Sales were largely in line with expectations. Operating profit was better than the revised forecast.
The company’s FY3/2023 sales were 2,244 million yen (up 16.3% YoY), operating profit was 309 million yen (down 14.9%), and net profit attributable to owners of parent was 230 million yen (down 9.0%). Against the revised forecasts disclosed on 14 February 2023: 96.8% for sales, 121.5% for operating profit, and 135.7% for net profit attributable to owners of parent company. Although sales were slightly short of target, profits came in above the forecasts.
Looking at the sales composition by service, Professional Services continue to be the primary source of sales, accounting for 87.6% of the total (previous year: 86.4%) and software licence sales 12.4% (last year: 13.6%). In terms of sales format, 85.1% (86% in the previous year) of sales are made directly by the Group to end-users, while 14.9% (14% in the last year) are made via sales partners, indicating a high ratio of direct sales.
Trends by service
In Professional Services, the provision of contracted system development and consulting using the OutSystems® low-code development tool in contracted development services expanded steadily.
| JPY, mn, % | Net sales | YoY % |
Oper. profit |
YoY % |
Ord. profit |
YoY % |
Profit ATOP |
YoY % |
EPS (¥) |
DPS (¥) |
| 2020/3 | 1,800 | 20.3 | 31 | 99.1 | 30 | 99.0 | 10 | -82.7 | 5.15 | 0.00 |
| 2021/3 | 2,101 | 16.8 | 175 | 448.8 | 174 | 465.3 | 130 | 1133.6 | 62.49 | 0.00 |
| 2022/3 | 1,929 | – | 363 | – | 348 | – | 253 | – | 78.48 | 0.00 |
| 2023/3 | 2,244 | 16.3 | 309 | -14.9 | 310 | -11.0 | 230 | -9.0 | 65.64 | 0.00 |
| 2024/3 (CE) | 2,650 | 18.1 | 310 | 0.0 | 310 | -0.1 | 230 | -0.1 | 66.56 | 0.00 |
| 2023/3 2Q | 1,081 | 21.6 | 145 | -15.1 | 145 | -7.4 | 97 | -9.1 | 27.94 | 0.00 |
| 2024/3 2Q | 1,194 | 10.4 | 99 | -31.4 | 101 | -30.1 | 48 | -50.8 | 13.76 | 0.00 |
Note: The new accounting standard for revenue recognition (new standard) is applied from FY3/2022. Therefore, there is no continuity between FY3/2021 and FY3/2022 onwards.
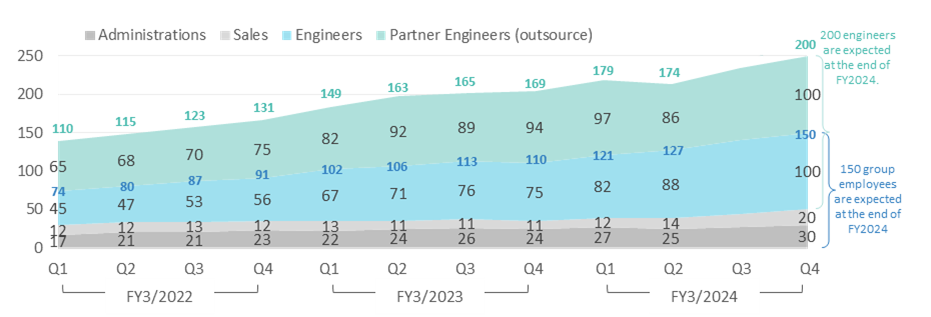
Breakdown of the number of staff in the company’s group
Source: Company materials
On a quarterly basis, sales increased YoY in each quarter, and for the year as a whole, sales in the Professional Services segment increased by 18.0% YoY to 1,966 million yen. Sales of contract development services, which account for the majority of this service, increased by 18.7% to 1,888 million yen, while training increased by 3.8% to 78 million yen.
Meanwhile, in Software License Sales, sales of the products handled, particularly OutSystems®, were strong, along with the provision of Professional Services. Software License Sales increased by 277 million yen, or 5.3%.
Operating profit analysis
Operating profit for FY3/2023 was 309 million yen, a decrease of 14.9% YoY. The factors behind the increase and decrease in operating profit are as follows: despite the effect of increased sales of 67 million yen, the company invested 70 million yen in sales promotion, including building a structure for new customer areas such as financial institutions, local governments and educational institutions, based on its growth strategy; 10 million yen in recruiting and training personnel for Professional Services; and 41 million yen in research and development to realise next-generation system development methods. As a result, operating profit decreased by 54 million yen.
Major events, etc., during FY3/2023
– The number of employees at the end of FY3/2023 was 110. This is an increase of 19 people compared to the end of the previous year. The number of engineers, including service partners, increased by 38 to 169. The company is continuing to expand its workforce, particularly engineers, to meet rising demand and future growth, and plans to have 150 Group employees (+40 on FY3/2023) and 200 engineers (+31 on FY3/2023) by the end of FY3/2024.
– Capital and business alliance with MITSUI KNOWLEDGE INDUSTRY Co., Ltd. in the low-code business: in April 2022, a capital and business alliance was concluded with MITSUI KNOWLEDGE INDUSTRY Co., Ltd. to expand low-code technology and Agile development further. By bringing together the resources of both companies, the alliance aims to accelerate the promotion of the DX business using the low-code Agile development method Agile-DX, as well as to train and provide DX business personnel. MITSUI KNOWLEDGE INDUSTRY Co., Ltd. invested in the company, making it the largest shareholder (20.68%, end-March 2023), and launched a new business related to Digital Labour services in August 2022.
– Launched owned media ‘LeapLeaper’: in order to ensure that the company’s vision of the future of system development and the IT industry, which the group is aiming for, is communicated, the company launched its own media ‘LeapLeaper’, which introduces a wide range of information such as quantum computers, biotechnology, AI, Agile development, low-code development“. was launched. The company intends to increase the number of potential customers by disseminating information from the customer’s perspective.
FY3/2024 2Q results
10% increase in revenue, 31% decrease in operating profit
The company’s 2Q results for FY3/2024 showed sales of 1,194 million (+10.4% YoY), operating profit of 99 million (-31.4% YoY) and quarterly net profit attributable to owners of parent of 48 million yen (-50.8% YoY).
Although sales remained steady due to the expansion of ongoing projects for existing clients and the acquisition of new projects, operating profit decreased due to increased recruitment and training-related costs and research and development costs.
By service, Professional Services sales were 993 million yen, up 7.3%. Software License Sales increased by 200 million yen, or +29.2% YoY, with an increase in the number of customers, particularly for the mainstay OutSystems.
On the other hand, the increase in personnel costs, which exceeded the growth in sales, plus the aggressive upfront investment in research and development costs, were the main reasons for the decline in operating profit 2Q FY3/2024, which posted 99 million yen. Analysis of changes shows that, compared with operating profit of 145 million yen in 2Q FY3/2023, the operating profit increased by 112 million yen due to the effect of increased sales, -26 million yen due to cost of sales, -78 million yen due to increased recruitment and training costs as a result of accelerated recruitment and training of personnel including engineers, and -54 million yen due to increased R&D costs as a result of development and joint research with universities with a view to introducing new services such as Digital Labour.
FY3/2024 full-year forecasts
Sales 2,650 million (+18.1% YoY), operating profit 310 million yen (+0.0%), net profit attributable to owners of parent 230 million yen (-0.1%)
The company’s forecasts for FY3/2024 have not been revised since the beginning of the year. As of the end of 2Q FY3/2024, the company had achieved 45.1% of its operating profit margin, 32.2% of its operating profit, 32.8% of its ordinary profit and 20.9% of its net profit attributable to owners of parent. The company still needs to catch up in these areas compared to progress in 2Q FY2023/3. A catch-up should be expected in the second half of the year.
Growth strategy
Growth scenarios in Medium-term management plan
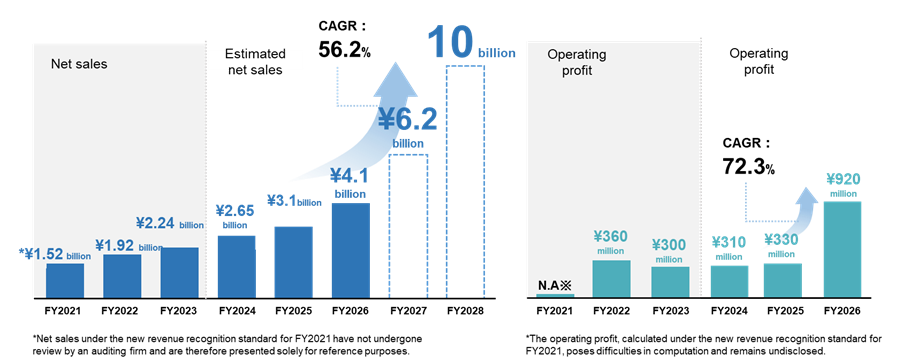
Source: Company, medium-term management plan (FY3/2024 – FY3/2026), business plan and growth potential (14 November 2023).
Medium-term management plan published
Targets sales of 4.1 billion yen in FY3/2026 and 10 billion yen in FY3/2028
In November 2023, the company announced its medium-term management plan (FY3/2024 – FY3/2026). The company has long stated that it will take on the challenge of changing the industrial structure through the development and spread of Digital Labour. In the future, it aims to create an environment in which business architects alone can develop systems without low-code personnel by evolving Digital Labour. The current medium-term management plan sets out these growth strategies in more concrete terms and clearly states numerical management targets.
The company defines the key points of its growth strategy as follows
(1) Strengthen the research and development system for Digital Labour and promote its practical application.
(2) Shift the billing format from man-monthly person-hours to the volume of applications generated.
(3) Expand the number of business architects capable of providing high-unit-price services.
4) Expanding indirect sales in collaboration with partner companies.
On this basis, the company aims to achieve sales of 4,100 million yen, operating profit of 920 million yen and pro forma EBITDA of 1,190 million yen in FY3/2026, with CAGRs of +24.4% and +72.3%, respectively, compared to FY3/2024 forecasts of sales of 2,650 million yen and operating profit of 310 million yen. Furthermore, from FY3/2026, the company aims to grow at a CAGR of +56.2% and achieve sales of 10 billion yen in FY3/2028.
1. Cost structure changes in IT service delivery with Digital Labour
Source: Company, medium-term management plan (FY3/2024 – FY3/2026), business plan and growth potential (14 November 2023).
Digital Labour as a Key Factor
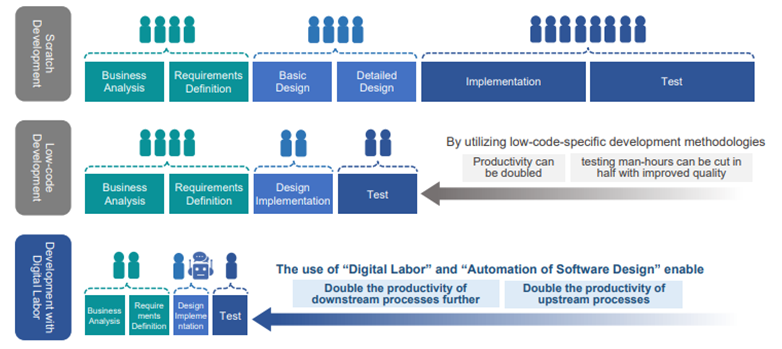
In recent years, the company has been actively investing in the research, development, promotion and introduction of Digital Labour. Initially, low-code development itself has a significant advantage over conventional development in terms of reduced person-hours for productivity and quality improvement. Still, the introduction of Digital Labour is expected to increase this productivity further (see above).
The company believes that the automation of application design and development by Digital Labour will enable it to realise twice the development productivity of typical low-code development. As a result, the number of engineers involved in a project on a person-hour basis can be reduced, which in turn significantly reduces labour costs and is expected to improve project profitability.
On the other hand, although system development has an image of high technology, the actual development site is a man-monthly operation, and the profit model is highly labour-intensive. Compared with high-tech companies such as GAFAM in the US, which have built a business model with increasing returns, system integrators in Japan urgently need to improve their labour productivity. As seen in the market trends, Japan is said to be lagging behind other countries in DX reforms, and improving this labour productivity is a pressing issue. The company’s advocacy of low-code development and the introduction of Digital Labour has the potential to provide major breakthroughs. Another benefit of the introduction of Digital Labour is this shift in the revenue model for system development. The traditional billing model for system development is calculated on the basis of the number of engineers required to write the code for system development x the labour cost per engineer, making it difficult to increase productivity. In addition, in waterfall-style development, the initial project definition and basic design estimates are often too weak, resulting in significant budget overruns, making it a major challenge for system integrators to change their profit models.
2. The development of systems that ‘charge by the amount of apps generated’ is made possible by Digital Labour
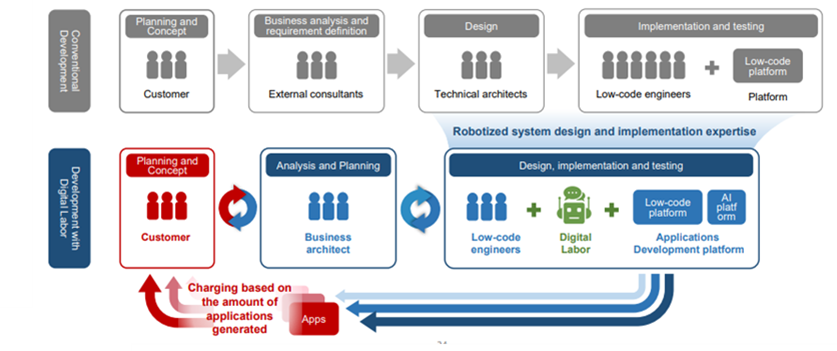
Source: Company, medium-term management plan (FY3/2024 – FY3/2026), business plan and growth potential (14 November 2023).
By robotising application design and implementation know-how, the company aims to shift the billing format for system development from man-monthly person-hours to one based on ‘application generation volume’. The use of Digital Labour makes it possible to realise large-scale system development with a small number of people.
In the conventional revenue model based on man-monthly person-hours, expansion of business scale = expansion of the number of employees, and the revenue model depended on the number of engineers. However, by switching to a revenue model based on the volume of applications generated, it is possible to expand the business scale and improve profitability without a significant increase in the number of employees.
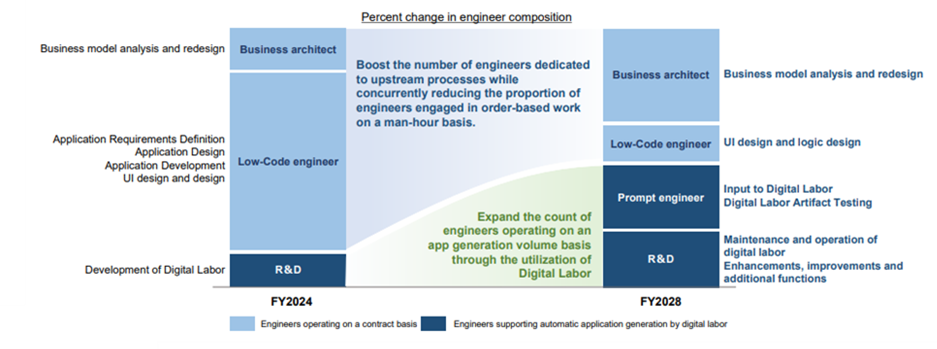
3. Changes in the cost structure in the engineering domain with Digital Labour
Source: Company, medium-term management plan (FY3/2024 – FY3/2026), business plan and growth potential (14 November 2023).
The introduction of low-code and Digital Labour will enable the transformation of the revenue structure, and the key to this in the future will be the business architect. The company calls the engineers who analyse and redesign business models business architects, and as automation progresses, these business architects will become increasingly important. Business architects are required to have in-depth knowledge of their customers’ business areas and the corresponding system development and problem-solving. Therefore, in the future, these business architects will produce significant added value, and the development of business architects will be a major challenge. The company plans to promote reskilling, mainly through AGILE-DX, to thicken the pool of business architects and shift the composition of engineers, as shown in the diagram above.
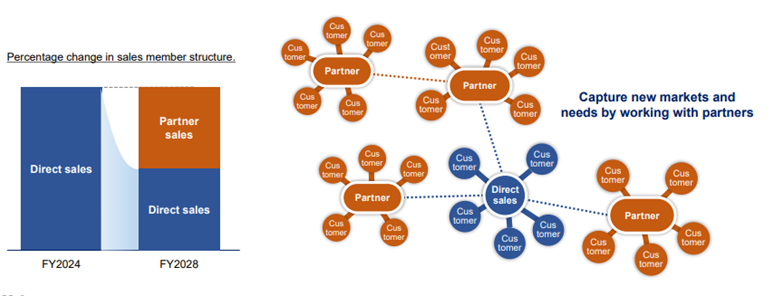
The next pillar of the company’s medium-term management plan is the expansion of indirect sales in collaboration with partner companies. As seen in the financial results, the current sales structure of the company is such that the group’s direct sales account for nearly 90% of sales. From a profit margin perspective, direct sales offers greater advantages compared to sales through distributors. However, it requires the development of an internal sales system. Consequently, even with the successful implementation of Digital Labor to reshape the revenue structure, the hurdle of sales bottlenecks remains.
4. Changes in the cost structure in the sales area with Digital Labour
Source: Company, medium-term management plan (FY3/2024 – FY3/2026), business plan and growth potential (14 November 2023).
The company is naturally aware of this and has taken the business decision to enter into a capital and business alliance with MITSUI KNOWLEDGE INDUSTRY Co., Ltd. in view of Digital Labour’s progress. In the future, the company will expand indirect sales in collaboration with partner companies in addition to the current direct sales structure in order to achieve a dramatic increase in revenues. The aim is to capture new markets and needs through collaboration with partner companies.
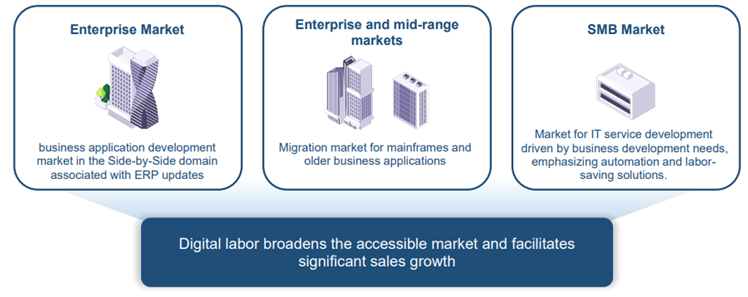
Digital Labour’s expansion of BlueMeme’s IT service delivery market
Source: Company, medium-term management plan (FY3/2024 – FY3/2026), business plan and growth potential (14 November 2023).
The company believes that the use of Digital Labour will not only improve the productivity of existing IT service delivery but also expand the markets where IT services can be provided, as shown in the diagram above. The company’s low-code development is characterized by its ability to develop large-scale systems such as mission-critical systems that are not intended for the SMB market. As migration of existing legacy systems will become an urgent issue in the future, including SAP’s ‘2027 problem*’, the company aims to enter these modernisation markets in earnest by utilising low-code development. By utilising Digital Labour and AGILE-DX, the company expects to support legacy migration of large-scale systems that have been used for a long time.
Medium- and long-term management strategy
As we have seen, in its new medium-term management plan, the company has clarified the details of its specific growth strategy and numerical targets, with Digital Labour as a key factor.
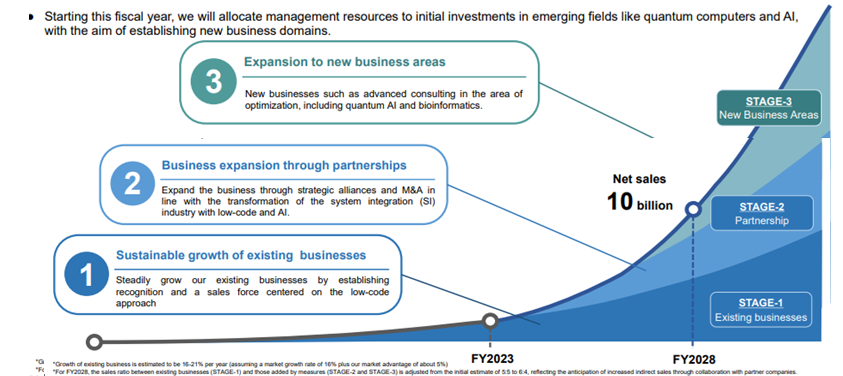
It has also drawn up a medium- to long-term strategy, including for FY2027 and beyond, as shown in the diagram below.
STAGE-1: Further develop low-code and aim for sustainable growth of existing businesses.
STAGE-2: Respond to changes in the systems integration industry through low-code and AI. Expand business through business alliances and M&A.
STAGE-3: Expand into advanced consulting business in new areas, including quantum AI.
*The end of standard support for SAP’s ERP product SAP ERP 6.0. Many companies in Japan have already introduced this product. With the end of support, business decisions such as migration to a new version or migration to other ERP services will be required.
Digital Labour’s growth strategy and long-term expansion into new business areas
Source: Company, medium-term management plan (FY3/2024 – FY3/2026), business plan and growth potential (14 November 2023).
STAGE-3 is still in the realm of the imagination. Still, the management team will be expected to achieve the results of STAGE-1 and STAGE-2 by steadily implementing the medium-term management plan presented here.
Stock information, etc.
Share Price Trend
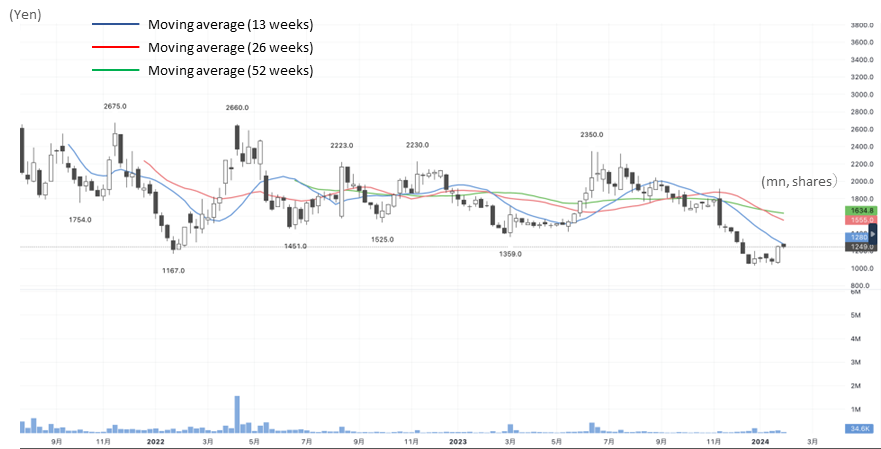
The company’s share price hit a high of 3,730 yen on 8 July after an opening price of 2,850 yen against a public offering price of 2,820 yen when it went public on 29 June 2021. Thereafter, after reaching a low of 1,167 yen on 27 January 2022, the share price remained in a boxed range of around 2,000 yen. However, following the announcement of FY3/2024 2Q results on 14 November 2023, the share price fell 18.1% to 1,472 yen on the following day (15 November). The closing price on 24 November was JPY 1,472, representing a 22.1% decline since the beginning of the year.
Over the past few years, the company has identified the development of the Digital Labour concept as the source of future growth. It has invested in human resources and development to realise this concept. As a result, these upfront investments have put pressure on earnings and have also had a negative impact on the share price. The company announced its medium-term management plan in conjunction with the announcement of its financial results this time. However, in addition to the profit decline in the 2Q results, concerns have arisen regarding progress towards the full-year forecast. As noted above, the future of the company’s share price will depend on the company delivering positive results towards the targets set out in its medium-term management plan.
4069:BlueMeme stock price move
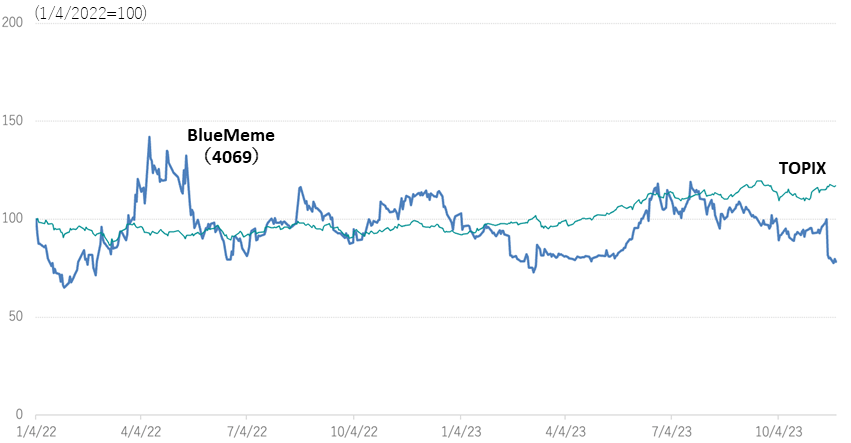
Share price compared to TOPIX
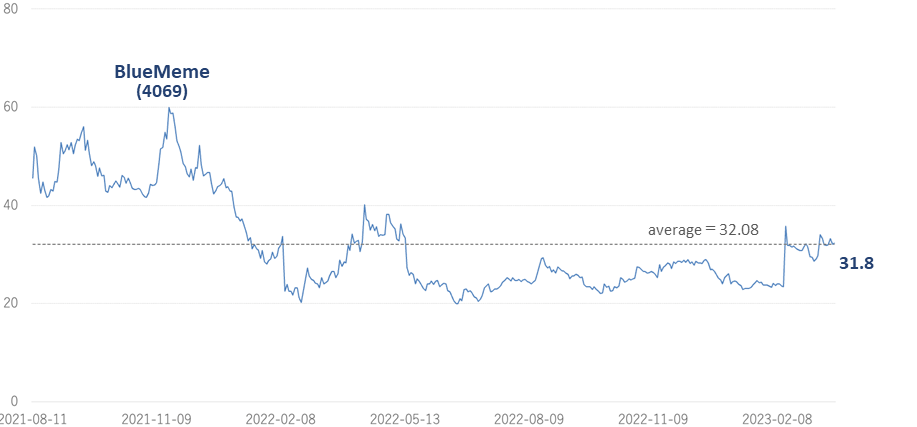
Historical PBR
Major shareholders
| Name | Number of shares owned |
Ratio of the number of shares owned to the total number of issued shares (%) |
| MITSUI KNOWLEDGE INDUSTRY CO., LTD. | 733,000 | 20.68 |
| BM Trust Co., Ltd. | 365,000 | 10.30 |
| Masanori Matsuoka | 310,000 | 8.75 |
| au Kabucom Securities Co., Ltd. | 158,200 | 4.46 |
| Mariko Tsujiguchi | 157,500 | 4.44 |
| Mobile Create Co., Ltd. | 148,808 | 4.20 |
| Wei Zhu | 106,000 | 2.99 |
| BBH/SUMITOMO MITSUI TRUST BNL, LIMITED (LONDONBRANCH)/SMTTIL/JAPAN SMALL CAP FUND CLT AC(Standing proxy: Sumitomo Mitsui Banking Corporation) |
101,500 | 2.86 |
| T.D.I.CO.,LTD. | 89,284 | 2.52 |
| Ryo Ichikawa | 88,000 | 2.48 |
| Total | 2,257,292 | 63.69 |
| Number of shares issued and outstanding | 3,553,546 |
Note: As of 31 March, 2023.
The company holds 34 treasury shares but is excluded from the above major shareholders. Number of shares held as a percentage of the total number of shares issued (%), excluding treasury shares.
Source: Omega Investment from company materials
Shareholder return policy
As a technology venture company, the company is in a growth phase where cash flow is invested for future growth. Therefore, the company does not currently pay dividends and has not announced any plans to do so.
However, on 9 March 2023, the company announced that it would buy back its shares on the market between 10 March and 9 September, with a maximum of 140,000 shares (4% of the total number of shares issued (excluding treasury shares)) and a maximum acquisition price of 200 million yen in monetary terms.
The aim is to ensure a flexible future capital policy by giving particular consideration to shareholders in terms of share price measures.
Corporate governance and top management
The company has a board of auditors with one full-time auditor and two auditors. The company currently has one representative director and six directors, two of whom are outside directors, making the ratio of outside directors 26%. Of the current total of 10 directors and auditors, nine are male, and one is female (see next page). The new Corporate Governance Code requires diversity, including gender and internationality, as a prerequisite for ensuring the effectiveness of the Board of Directors and Board of Auditors. Currently, the company’s sales are entirely domestic, but the number of foreign employees is expected to increase in the future. From a corporate governance perspective, even greater diversity, including in the management team, will be required in the future.
Top management
Representative Director:Masanori Matsuoka

Born 1975.
Apr. 1998 Joined System Clinic Inc.
Aug. 2000 Joined Japan Online Securities Co. (now au Kabucom Securities Co., Ltd.)
May 2001 Joined SAP Japan Co., Ltd.
Aug. 2004 Joined Net Conscious Ltd.
Jun. 2006 Joined Sun Microsystems (now Oracle Corporation Japan)
Aug. 2009 Joined INTEC IT Capital (now SX Capital, Inc.)
Aug. 2009 Seconded to the company
May 2010 Joined the Company Representative Director, Chief Executive Officer (present post)
Dec. 2017 President of OPENMODELS Inc.
Apr. 2022 Director, BlueMeme Partners Inc. (present post)
Apr. 2023 Chairman of the Board, OPENMODELS Inc. (present post)
Director:Kuniharu Miyawaki

Born 1973.
Apr. 1997 Joined The Japan Research Institute, Ltd.
Jul. 2006 Transferred to Japan Soken Solutions Ltd (now JSOL CORPORATION) by spin-off company
May 2013 Joined SBI Mortgage (now ARUHI Corporation)
Aug. 2019 Executive director
Nov. 2019 President and Representative Director of Aruhi Real Estate Technology Co.
Sep. 2022 Joined the Company, Executive Officer, Head of Service Design Department
Apr. 2023 Executive Officer of the Company, General Manager of the Technology Division and General Manager of the Service Design Department
Jun. 2023 Director of the Company (present post)
Director : Mariko Tsujiguchi

Born 1980.
Apr. 2006 Joined The Japan Research Institute, Ltd.
Jul. 2006 Transferred to Japan Soken Solutions Ltd (now JSOL CORPORATION) by spin-off company.
Jul. 2010 Joined the Company
Sep. 2016 Manager, Consulting Sales Department
Mar. 2017 Executive Officer and General Manager, Consulting Sales Department
Apr. 2017 Executive Officer and General Manager, Corporate Sales Department
Jun. 2017 Executive Officer and Head of Corporate Sales
Dec. 2017 Director of OPENMODELS Inc.
Feb. 2018 Director and Chief Operating Officer of the Company (present post)
April 2023 Chairman of the Board of OPENMODELS Inc. (present post)
Director : Wei Zhu

Born 1979.
Apr. 1999 Joined Technical Marketing Research Co.
Jan. 2003 Joined Net Conscious Ltd.
Nov. 2006 Joined Oracle Corporation Japan
Jun. 2010 Joined the Company
Sep. 2016 Manager, Professional Services Department of the Company
Mar. 2017 Executive Officer , Head of Professional Services Department
Jun. 2017 Director, Head of Professional Services
Feb. 2018 Director, Chief Technology Officer (present post)
Director : Ryo Ichikawa

Born 1975.
Apr. 1998 Joined Gyosei Co.
Jan. 2001 Joined SAP Japan Co., Ltd.
Jul. 2007 Joined Tohmatsu Consulting (now Deloitte Tohmatsu Consulting LLC,)
Jul. 2010 Joined the Company
Dec. 2017 Director of OPENMODELS Inc. (present post)
May 2019 SSO Manager and SA Manager, Corporate Sales Department
Aug. 2019 Executive Officer, General Manager, Professional Services Department of the Company
Oct. 2020 Director, Chief Financial Officer (present post)
Director (Outside Director) : Kinei Kawane
Born 1958.
Apr. 1976 Joined Tokyo Telecommunications Construction Co.
Apr. 1980 Joined Tokyo Computer Service Co.
Apr. 1986 Joined Nansei Information Development (now JTA Infocom)
Apr. 1988 General Manager, Sales Department, S.P.O. Corporation (now OKIGIN S.P.O. Corporation)J
an. 2005 Director of OKIGIN S.P.O.
Oct. 2010 Executive Officer, IDEES Inc.
Jun. 2014 Establishment of Crosspoint Consulting Co. Representative Director (present post)
Jan. 2015 Director, Data Curation Ltd.
Oct. 2017 Director, Sunkuit Co.
Feb. 2019 Director of the Company (present post)
Director (Outside Director) : Kentaro Matsushima

Born 1971.
Apr. 1995 Joined MITSUI KNOWLEDGE INDUSTRY Co. (now Mitsui Knowledge Industry Co.)
Apr. 2007 Seconded to MKI Software Services Ltd (now MKI Technologies Co., Ltd)
Oct. 2011 General Manager, Cloud Business Promotion Department, Business Solutions Division, Mitsui Information Development Co.
Apr. 2013 Manager, Business Development Department
Apr. 2015 Manager, R&D Department
Apr. 2016 Manager, Enterprise Technology Department, System Technology Group
Apr. 2018 Manager, Trading Company Technology Department, ICT Core Technology Group
Apr. 2020 General Manager, Solution Technology Division of the same company
Apr. 2022 Executive Officer, General Manager, Solution Technology Division, MITSUI KNOWLEDGE INDUSTRY Co., Ltd (present post)
Jun. 2022 Director of the Company (present post)
Full-time Auditor : Kazuhiko Sugiyama
Born 1947.
Apr. 1970 Joined Nissho Iwai Corporation (now Sojitz Corporation)
Jul. 1976 Seconded to Nissho Iwai America Corporation (now Sojitz Corporation of America) (New York)
Sep. 1995 General Manager, Legal Department, Nissho Iwai Corporation (now Sojitz Corporation)
Sep. 2000 Founding President and Representative Director of Risk Monster Inc.
Jun. 2005 Chairman of the Board
Jun. 2008 Chairman of the Board, Lismont Business Portal Ltd.
Mar. 2011 External auditor, Wirelessgate Inc.
Jun. 2016 Auditor of the Company (present post)
Auditor:Minoru Mukai
Born 1953.
Apr. 1976 Joined The Bank of Tokyo, Ltd. (now MUFG Bank, Ltd.)
Apr. 1996 General Manager, Underwriting Department 3, Tokyo Mitsubishi Securities (now Mitsubishi UFJ Morgan Stanley Securities Co.
Jul. 2000 Managing Director of UBS Global Asset Management (now UBS Asset Management)
Jan. 2004 Managing Director
Apr. 2004 Executive Vice President and Representative Director of the company
Jun. 2005 Vice-Chairman, Japan Investment Advisers Association
May 2011 Part-time lecturer at the Faculty of Economics, Osaka University and Kobe University (present post)
Jun. 2017 Auditor of the Company (present post)
Auditor:Kazuhisa Hayashida
Born 1973.
Apr. 1997 Joined Tokyo Electron Ltd.
Dec. 2006 Mizuzu Audit Corporation
Aug. 2007 Nippon Audit Corporation (currently EY Ernst & Young ShinNihon LLC)
Feb.2014 Director of Kazuhisa Hayashida Certified Public Accountant Office (present post)
Jun. 2017 Auditor of the Company (present post)
Note: In the above, the company in each officer’s biography indicates the relevant company. The Company refers to BlueMeme Inc.
Source: Company materials
Skills matrix of the Board of Directors’ Members
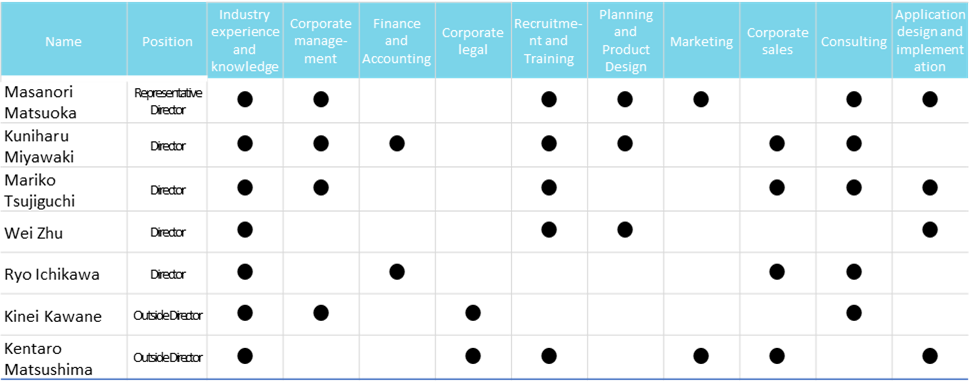
Source: Company materials
The company’s corporate governance structure
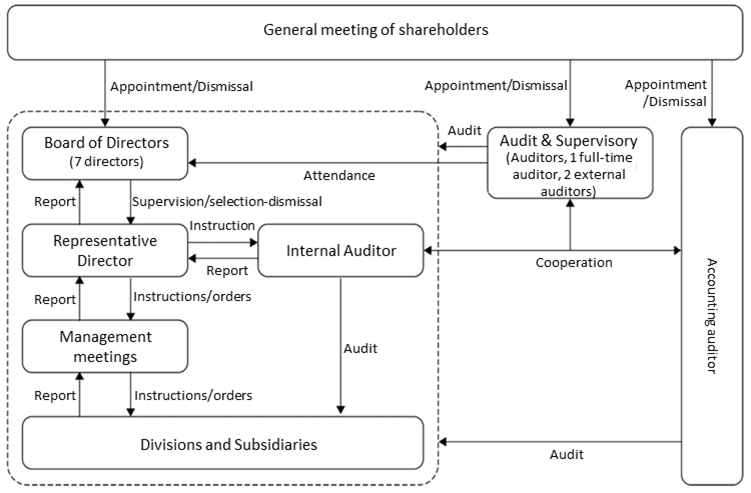
Source: Company materials
Glossary
| Terminology | Meaning and content |
| System integrator | A company that undertakes the development and operation of information systems, mainly on a lump-sum basis, from the customer, who is the owner of the system. Also referred to as a system integrator in Japan. |
| Contracted development | A method whereby a client company outlines the system it wants to create and outsources the development of the information system to an external development company. |
| Scratch Development | Generally, when developing a product, refers to creating it anew from scratch without building on something that already exists. In information systems development, it refers to creating or rebuilding an entire system from scratch by manually programming it |
| Agile methodology | A method of making decisions by adopting change iteratively. |
| Project management method | Standard processes, control procedures and deliverables to be created when carrying out software development are defined and systematised. |
| Low-code development | A development method suitable for complex, large-scale system development that improves the development productivity of engineers by automating most of the programmer’s work using the latest technology, rather than the method of engineers writing design documents and programmers programming while looking at those design documents, which was common in system development. |
| low-code development tool | Created using low-code technology to automate programming, a generic term for tools that can automate many of the tasks previously done manually by programmers. |
| waterfall style | A workflow for large-scale contracted system development, proposed in the 1970s, and a mainstream method in Japanese contracted system development. It was used when introducing company-wide systems in large companies, such as the introduction of the Xth online system in financial institutions and the online reservation system of the former Japanese National Railways. Specifically, this method involves first defining and agreeing on all the requirements of the software to be created, then designing everything on that basis, producing all the programs based on that design, and finally verifying that they work correctly. This method cannot cope with changes in requirements that occur after the requirements have been defined, as all the requirements of the software to be made must first be determined. This makes it difficult for this method to cope with changing requirements and new additions due to the recent rapid changes in the social environment and technological evolution. In addition, the initial estimates are not sufficiently calculated, and problems such as more time and costs than expected are incurred after development has started. |
| Low-code development tool vendors | Collective name for companies developing and selling low-code development tools. |
Financial data (quarterly basis)
| FY(\mn) | 2021/3* | 2022/3 | 2023/3 | 2023/3 | ||||||||||
| 1Q | 2Q | 3Q | 4Q | 1Q | 2Q | 3Q | 4Q | 1Q | 2Q | 3Q | 4Q | 1Q | 2Q | |
| [Statements of income] | ||||||||||||||
| Net sales | 485 | 541 | 482 | 594 | 426 | 463 | 519 | 521 | 502 | 578 | 556 | 606 | 617 | 577 |
| Year-on-year basis (%) | – | – | – | – | – | – | – | – | 17.8% | 25.0% | 7.3% | 16.3% | 22.8% | -0.3% |
| Professional Services | – | – | – | – | 378 | 392 | 437 | 457 | 431 | 495 | 483 | 556 | 496 | 497 |
| Year-on-year basis (%) | – | – | – | – | – | – | – | – | 14.0% | 26.1% | 10.6% | 21.5% | 15.2% | 0.4% |
| Composition of sales | – | – | – | – | 88.7% | 84.8% | 84.3% | 87.8% | 85.8% | 85.6% | 86.9% | 91.8% | 80.4% | 86.2% |
| Contracted Development Services | – | – | – | – | 361 | 367 | 420 | 441 | 412 | 480 | 464 | 531 | 490 | 487 |
| Year-on-year basis (%) | – | – | – | – | – | – | – | – | 14.2% | 30.6% | 10.5% | 20.3% | 18.7% | 1.5% |
| Composition of sales | – | – | – | – | 84.8% | 79.4% | 80.9% | 84.8% | 82.1% | 82.9% | 83.4% | 87.7% | 79.4% | 84.6% |
| Training | – | – | – | – | 16 | 25 | 17 | 15 | 18 | 15 | 19 | 24 | 6 | 9 |
| Year-on-year basis (%) | – | – | – | – | – | – | – | – | 10.3% | -39.3% | 12.7% | 55.0% | -64.5% | -38.7% |
| Composition of sales | – | – | – | – | 3.9% | 5.4% | 3.4% | 3.1% | 3.6% | 2.6% | 3.5% | 4.1% | 1.1% | 1.6% |
| Software License Sales | – | – | – | – | 48 | 70 | 84 | 63 | 71 | 83 | 72 | 49 | 120 | 79 |
| Year-on-year basis (%) | – | – | – | – | – | – | – | – | 48.0% | 18.7% | -10.6% | -21.5% | 69.1% | -4.8% |
| Composition of sales | – | – | – | – | 11.3% | 15.2% | 15.7% | 12.2% | 14.2% | 14.4% | 13.1% | 8.2% | 19.6% | 13.8% |
| Cost of sales | 361 | 369 | 311 | 370 | 199 | 206 | 231 | 249 | 254 | 286 | 287 | 306 | 297 | 303 |
| Cost of sales margin | 74.4% | 68.2% | 64.5% | 62.3% | 46.7% | 44.4% | 44.5% | 47.8% | 50.5% | 49.5% | 51.5% | 50.5% | 48.1% | 52.5% |
| Gross profit | 125 | 171 | 171 | 224 | 227 | 258 | 288 | 271 | 248 | 294 | 269 | 300 | 320 | 274 |
| SG&A expenses | 124 | 124 | 127 | 141 | 153 | 160 | 173 | 194 | 202 | 195 | 207 | 198 | 239 | 256 |
| SG&A expenses margin | 25.6% | 22.9% | 26.3% | 23.7% | 35.9% | 34.5% | 33.3% | 37.2% | 40.2% | 33.7% | 37.2% | 32.7% | 38.7% | 44.4% |
| Operating profit | 0 | 49 | 43 | 83 | 74 | 96 | 114 | 78 | 45 | 99 | 62 | 103 | 81 | 19 |
| Year-on-year basis (%) | – | – | – | – | – | – | – | – | -38.4% | 2.7% | -46.1% | 32.1% | 76.1% | -80.8% |
| Operating profit margin (%) | 0.0% | 9.1% | 8.9% | 14.0% | 17.6% | 20.7% | 22.2% | 15.0% | 9.1% | 17.1% | 11.1% | 17.0% | 13.1% | 3.3% |
| Non-operating income | 0 | 0 | 0 | 2 | 0 | 0 | 0 | 0 | 0 | 0 | 1 | 1 | 1 | 1 |
| Non-operating expenses | 1 | 0 | 1 | 1 | 13 | 2 | 0 | 1 | 1 | 0 | 0 | 0 | 0 | 0 |
| Ordinary profit | 0 | 47 | 43 | 84 | 62 | 95 | 115 | 77 | 46 | 99 | 63 | 102 | 82 | 20 |
| Year-on-year basis (%) | – | – | – | – | – | – | – | – | -26.6% | 4.2% | -45.2% | 32.5% | 78.3% | -79.8% |
| Ordinary profit margin (%) | 0.0% | 8.7% | 8.9% | 14.1% | 14.6% | 20.5% | 22.2% | 14.8% | 9.1% | 17.1% | 11.3% | 16.8% | 13.3% | 3.5% |
| Income before income taxes | 0 | 47 | 43 | 84 | 62 | 95 | 115 | 77 | 46 | 99 | 63 | 91 | 82 | 17 |
| Total income taxes | 1 | 10 | 17 | 16 | 19 | 31 | 36 | 9 | 15 | 33 | 22 | -2 | 34 | 17 |
| Net income | -1 | 37 | 26 | 68 | 43 | 64 | 79 | 67 | 30 | 67 | 41 | 92 | 48 | 0 |
| Year-on-year basis (%) | – | – | – | – | – | – | – | – | -28.7% | 4.7% | -48.1% | 37.3% | 60.0% | -99.5% |
| Net income margin (%) | -0.2% | 6.8% | 5.4% | 11.4% | 10.1% | 13.8% | 15.2% | 12.9% | 6.0% | 11.6% | 7.4% | 15.2% | 7.8% | 0.0% |
| EBITDA | 4 | 52 | 48 | 89 | 79 | 101 | 120 | 84 | 51 | 103 | 67 | 108 | 84 | 23 |
| EBITDA margin | 0.8% | 9.6% | 10.0% | 15.0% | 18.5% | 21.8% | 23.1% | 16.1% | 10.1% | 17.8% | 12.0% | 17.8% | 13.6% | 4.0% |
| R&D expenses | 3 | 4 | 6 | 3 | 1 | 2 | 4 | 3 | 12 | 14 | 14 | 11 | 12 | 11 |
| Ratio of R&D expenses to sales | 0.6% | 0.7% | 1.2% | 0.5% | 0.2% | 0.4% | 0.8% | 0.6% | 2.4% | 2.4% | 2.5% | 1.8% | 1.9% | 1.9% |
| [Balance Sheets] | ||||||||||||||
| Current assets | 1,051 | 1,008 | 1,001 | 1,180 | 2,105 | 2,507 | 2,664 | 2,754 | 2,662 | 2,723 | 2,688 | 2,794 | 2,703 | 2,600 |
| Cash and deposits | 590 | 520 | 555 | 645 | 1,826 | 2,202 | 2,271 | 2,356 | 2,267 | 2,392 | 2,377 | 2,224 | 2,193 | 2,190 |
| Notes and accounts receivable - trade, and contract assets |
170 | 167 | 161 | 228 | 252 | 266 | 357 | 366 | 348 | 270 | 252 | 439 | 356 | 254 |
| Non-current assets | 205 | 208 | 207 | 206 | 197 | 199 | 197 | 201 | 191 | 188 | 181 | 222 | 239 | 284 |
| Property, plant and equipment | 102 | 99 | 95 | 93 | 90 | 90 | 87 | 91 | 89 | 86 | 83 | 80 | 83 | 96 |
| Intangible assets | 17 | 23 | 26 | 24 | 23 | 21 | 20 | 18 | 17 | 15 | 14 | 0 | 0 | 0 |
| Investments and other assets | 86 | 86 | 86 | 89 | 85 | 88 | 90 | 91 | 85 | 86 | 84 | 141 | 155 | 187 |
| Total assets | 1,256 | 1,216 | 1,208 | 1,386 | 2,302 | 2,707 | 2,861 | 2,956 | 2,853 | 2,911 | 2,869 | 3,016 | 2,943 | 2,885 |
| Current liabilities | 683 | 639 | 632 | 733 | 398 | 425 | 521 | 564 | 420 | 410 | 325 | 393 | 383 | 375 |
| Non-current liabilities | 215 | 183 | 155 | 129 | 104 | 79 | 53 | 37 | 37 | 37 | 37 | 36 | 36 | 51 |
| Total liabilities | 897 | 822 | 787 | 862 | 502 | 503 | 575 | 601 | 458 | 447 | 362 | 429 | 420 | 427 |
| Total net assets | 358 | 395 | 421 | 524 | 1,800 | 2,204 | 2,286 | 2,354 | 2,395 | 2,464 | 2,506 | 2,587 | 2,523 | 2,457 |
| Shareholders’ equity | 358 | 394 | 421 | 524 | 1,800 | 2,203 | 2,286 | 2,354 | 2,395 | 2,463 | 2,506 | 2,587 | 2,522 | 2,455 |
| Share capital | 189 | 189 | 189 | 206 | 790 | 959 | 962 | 962 | 967 | 968 | 969 | 970 | 970 | 971 |
| Capital surplus | 180 | 180 | 180 | 197 | 781 | 950 | 953 | 953 | 958 | 959 | 960 | 961 | 961 | 962 |
| Retained earnings | -11 | 26 | 52 | 120 | 229 | 293 | 372 | 439 | 470 | 537 | 578 | 669 | 717 | 717 |
| Treasury shares | 0 | 0 | 0 | 0 | 0 | 0 | -14 | -127 | -195 | |||||
| Total liabilities and net assets | 1,256 | 1,216 | 1,208 | 1,386 | 2,302 | 2,707 | 2,861 | 2,957 | 2,853 | 2,911 | 2,869 | 3,016 | 2,943 | 2,885 |
*: The new accounting standard for revenue recognition has been applied from FY3/2022; FY3/2021 figures are based on the old standard.
Note: Due to rounding, number of significant digits, etc., there may be minor discrepancies in figures.
Source: Omega Investment from company materials
Financial data (full-year basis)
| FY(\mn) | 2019/3 | 2020/3 | 2021/3 | 2022/3 | 2023/3 |
| [Statements of income] | |||||
| Net sales | 1,496 | 1,800 | 2,101 | 1,929 | 2,244 |
| Year-on-year basis (%) | 95.7 | 20.2 | 16.8 | – | 16.3 |
| Cost of sales | 1,036 | 1,275 | 1,410 | 885 | 1,132 |
| Gross profit | 461 | 524 | 691 | 1,044 | 1,111 |
| Gross profit margin (%) | 30.8 | 29.2 | 32.9 | 54.1 | 49.5 |
| SG&A expenses | 374 | 492 | 515 | 680 | 801 |
| Operating profit | 87 | 31 | 175 | 363 | 309 |
| Year-on-year basis (%) | – | -63.2 | 446.9 | – | -14.9 |
| Operating profit ratio (%) | 5.8 | 1.8 | 8.3 | 18.9 | 13.8 |
| Non-operating income | 0 | 0 | 2 | 0 | 1 |
| Non-operating expenses | 1 | 1 | 3 | 15 | 0 |
| Ordinary profit | 86 | 30 | 174 | 348 | 310 |
| Ordinary profit margin (%) | 5.7 | 1.7 | 8.3 | – | -11.0 |
| Extraordinary income | 0 | 0 | – | – | |
| Extraordinary expenses | 19 | – | 11 | ||
| Income before income taxes | 67 | 30 | 174 | 348 | 298 |
| Total income taxes | 6 | 20 | 44 | 95 | 68 |
| Net income | 61 | 10 | 130 | 253 | 230 |
| Year-on-year basis (%) | -82.0 | 1,081.8 | – | -9.0 | |
| Net income ratio (%) | 4.1 | 0.6 | 6.2 | 13.1 | 10.3 |
| [Balance Sheets] | |||||
| Current assets | 814 | 1,073 | 1,179 | 2,754 | 2,794 |
| Cash and deposits | 363 | 584 | 645 | 2,356 | 2,224 |
| Notes and accounts receivable – trade, and contract assets | 264 | 294 | 227 | 366 | 439 |
| Non-current assets | 202 | 199 | 206 | 201 | 222 |
| Property, plant and equipment | 116 | 105 | 92 | 91 | 80 |
| Intangible assets | 0 | 7 | 24 | 18 | 0 |
| Investments and other assets | 85 | 85 | 89 | 91 | 141 |
| Total assets | 1,016 | 1,272 | 1,386 | 2,956 | 3,016 |
| Current liabilities | 584 | 666 | 733 | 564 | 393 |
| Short-term borrowings | 235 | 135 | 116 | 96 | 1 |
| Non-current liabilities | 84 | 247 | 129 | 37 | 36 |
| Long-term borrowings | 53 | 212 | 96 | 4 | 3 |
| Total liabilities | 668 | 914 | 862 | 601 | 429 |
| Total net assets | 348 | 358 | 523 | 2,354 | 2,587 |
| Shareholders’ equity | 348 | 358 | 523 | 2,354 | 2,587 |
| Share capital | 189 | 188 | 206 | 962 | 970 |
| Capital surplus | 180 | 179 | 197 | 953 | 961 |
| Retained earnings | -21 | -10 | 120 | 439 | 669 |
| Treasury shares | -0 | -14 | |||
| Total liabilities and net assets | 1,016 | 1,272 | 1,386 | 2,956 | 3,016 |
| [Statements of cash flows] | |||||
| Cash flow from operating activities | -65 | 174 | 182 | 338 | 94 |
| Cash flow from investing activities | -148 | -13 | -21 | –9 | -46 |
| Cash flow from financing activities | 279 | 59 | -100 | 1,381 | -179 |
| Free cash flow | -213 | 162 | 162 | 328 | 48 |
| Net increase in cash and cash equiv. | 66 | 221 | 61 | 1,710 | -131 |
| Cash and cash equiv. at beginning of period | 297 | 363 | 584 | 645 | 2,356 |
| Cash and cash equiv. at end of period | 363 | 584 | 645 | 2,356 | 2,224 |