2026-07-15
Home
Japanese

Omega Investment Co., Ltd.
Digital Hearts Holdings (Company note – Full report update)

| Share price (2/22) | ¥1,025 | Dividend Yield (24/3 CE) | 2.04 % |
| 52weeks high/low | ¥1,603 / 818 | ROE | 10.1 % |
| Avg Vol (3 month) | 129.4 thou shrs | Operating margin (TTM) | 6.92 % |
| Market Cap | ¥21.6 bn | Beta (3Y Raw) | 1.10 |
| Enterprise Value | ¥22.1 bn | Shares Outstanding | 23.890 mn shrs |
| PER (24/3 CE) | 44.5 X | Listed market | TSE Prime section |
| PBR (23/3 act) | 2.59 X |
| Click here for the PDF version of this page |
| PDF Version |
AGEST Spin-off listing to chart a new growth story for both Enterprise and Entertainment Businesses
Summary
◇Digital Hearts Holdings (Hereafter, the Company) is a software service company with the mission of “SAVE the DIGITAL WORLD” and aims to provide safe and secure “quality” to the digital society. The Company provides software testing and security services for enterprise customers, as well as game debugging and global services for the entertainment industry.
◇Highlights: three main areas of focus on the Company
▷Enterprise Business has grown to become the second pillar of the Company’s business and will continue to grow at a high rate: The Company’s ancestral business was game debugging, but it entered the Enterprise Business in earnest in 2017. This business is growing rapidly against the backdrop of DX tailwinds and a chronic shortage of IT human resources. The business grew at a CAGR of +55% from 2018/3 to FY2023/3, thanks to investments in engineers and an aggressive M&A strategy, and sales reached 16.8 billion yen in FY2023/3, which accounted for 46% of total company sales. The business firmly generates operating profit now and is expected to continue to grow at a high rate.
▷Entertainment Business also has new growth potential: The Company’s Entertainment Business, which commands a dominant share in the domestic game debugging market, has consistently generated a high operating profit margin of approximately 20%. This has been the source of the Company’s solid financial base. While growth in the domestic market has been limited, new growth is expected in the overseas game market, as well as new technologies such as Metaverse and Web 3.0 (NFT). The Company plans to achieve further growth with the abundant cash generated from the debugging business.
▷The Company plans a spin-off listing of AGEST to maximise the growth potential of both businesses: In May 2023, the Company announced that it would begin preparations for a spin-off listing of AGEST, its principal subsidiary in the Enterprise Business. As mentioned above, the Company aims for further growth in both businesses. Still, the Enterprise Business and Entertainment Business have different profit models and require different management resources. The management has decided that it is more appropriate for each to operate under an independent management structure rather than the current one, considering each business’s future growth. From an investor’s perspective, separating the business entities through this spin-off listing will allow each business to be valued at an appropriate valuation.
◇Recent earnings trends: In FY2023/3, sales registered 36.5 billion yen (+25% YoY) and operating income 3.0 billion yen (+11% YoY), both achieving record highs. While the Enterprise Business aggressively strengthened its business foundation and invested in growth, operating income increased due to higher sales in the Entertainment Business and other factors. On the other hand, the Company posted an extraordinary loss of 1.2 billion yen due to an impairment loss on the goodwill of a subsidiary operating in China and other Asian countries. Net profit attributable to owners of the parent declined by 0.7 billion yen or 55%. Based on the Q2 FY2024/3 results, the Company expects full-year sales to increase by 9.5% or 40 billion yen. However, it expects operating income to decline 16.7% to 2.5 billion yen and net profit attributable to owners of the parent to fall 31.2% to 0.55 billion yen due to sluggish overseas operations and Increase in expenses due to spin-off listing preparation, etc.
◇Share price trend: After hitting 2,700 yen, the highest price since its listing, on December 17, 2021, the Company‘s share price has been on a downtrend. The share price fell 14% in the two days following the announcement of FY2024/3 Q2 results and the downward revision of the full-year forecast. In FY2023, the share price fell by 47.7% since the beginning of the year. The Company posted an extraordinary loss of approximately 1 billion yen in its overseas business, following the same suit in the previous fiscal year, significantly impacting the earnings. With the Company expecting earnings to improve in the second half of the current fiscal year and given that preparations for AGEST’s spin-off listing are progressing steadily, we would expect the Company’s share price to be revalued.
Table of contents
| Summary | 1 |
| Key financial data | 2 |
| Focus points | 3 |
| Company profile | 4 |
| History, company’s group | 4 |
| Business overview | 9 |
| Enterprise Business | 9 |
| Entertainment Business | 13 |
| Financial results | 16 |
| FY2023/3 financial results | 16 |
| FY2024/3 Q2 financial results | 18 |
| FY2024/3 full-year forecast | 18 |
| Growth strategy | 19 |
| AGEST’s spin-off listing and next stage of growth | 19 |
| Stock information, etc. | 24 |
| Share Price trend | 24 |
| Share price observation | 27 |
| Major shareholders, Shareholding by ownership, Shareholder return policy | 28 |
| Corporate governance and the top management | 29 |
| Sustainability | 31 |
| Financial data | 33 |
Key financial data
| Fiscal Year | 2018/3 | 2019/3 | 2020/3 | 2021/3 | 2022/3 | 2023/3 | 2024/3 (CE) |
| Net sales | |||||||
| Enterprise Business | 1,892 | 3,302 | 5,022 | 7,021 | 11,492 | 16,840 | 20,435 |
| Entertainment Business | 15,568 | 15,951 | 16,115 | 15,647 | 17,687 | 19,815 | 19,645 |
| Total net sales | 17,353 | 19,254 | 21,138 | 22,669 | 29,178 | 36,517 | 40,000 |
| Cost of sales | 12,394 | 13,791 | 15,566 | 16,236 | 20,787 | 25,885 | – |
| Gross profit | 4,959 | 5,463 | 5,572 | 6,434 | 8,391 | 10,632 | – |
| SG&A expenses | 3,223 | 3,858 | 4,178 | 4,525 | 5,695 | 7,631 | – |
| Operating income | 1,736 | 1,606 | 1,394 | 1,908 | 2,696 | 3,000 | 2,500 |
| Ordinary income | 1,783 | 1,651 | 1,372 | 1,975 | 2,774 | 3,152 | 2,560 |
| Net income | 1,200 | 1,575 | 792 | 974 | 1,778 | 799 | 550 |
| EBITDA | 2,010 | 1,860 | 1,733 | 2,322 | 3,430 | 4,176 | 3,460 |
| Current assets | 6,813 | 7,403 | 7,453 | 9,744 | 10,392 | 12,528 | – |
| Cash and deposits | 3,894 | 4,197 | 3,739 | 5,076 | 5,208 | 6,456 | – |
| Non-current assets | 1,761 | 2,428 | 3,183 | 4,593 | 7,217 | 7,052 | – |
| Goodwill | 150 | 481 | 1,027 | 2,467 | 4,588 | 3,468 | – |
| Total assets | 8,575 | 9,832 | 10,637 | 14,338 | 17,610 | 19,581 | – |
| Total liabilities | 5,005 | 4,819 | 5,198 | 8,024 | 10,044 | 10,107 | – |
| Total net assets | 3,570 | 5,012 | 5,438 | 6,314 | 7,566 | 9,474 | – |
| Equity ratio (%) | 39.3 | 48.7 | 46.3 | 39.7 | 39.9 | 48.3 | – |
| Cash flow from operating activities | 1,436 | 889 | 1,086 | 1,416 | 3,077 | 2,850 | – |
| Cash flow from investing activities | (618) | 62 | (1,018) | (1,813) | (2,537) | (1,903) | – |
| Cash flow from financing activities | (250) | (693) | (515) | 1,730 | (546) | 141 | – |
| Increase/decrease in cash and cash equivalents | 3,894 | 4,162 | 3,704 | 5,041 | 5,173 | 6,456 | – |
Note: In FY2023/3, the provisional accounting treatment for business combinations was finalized, and the figures for FY2022/3 reflect the details of the provisional accounting treatment finalised.
Source: Omega Investment from company materials
Focus points
Currently, there are three points of interest regarding the Company
(The AGEST spin-off listing plan will be discussed in more detail in a later chapter)
▷Enterprise Business has grown to become the second pillar of the Company’s business and will continue to grow at a high rate: As one of the leading software testing companies, the Company has been focusing on the Entertainment Business since its foundation and entered the Entertainment Business in earnest in 2017 as its second founding phase. This business has expanded rapidly against the backdrop of a tailwind from the shift to DX and a chronic shortage of IT personnel. The Company invested in engineers and implemented an aggressive M&A strategy, and sales in this business grew at a CAGR of +55% from FY2018/3 to FY2023/3, reaching 16.8 billion yen (46% of the company sales) in FY2023/3. As a result of aggressive investment in this field, profits temporarily declined company-wide. Still, since Q3 FY2021/3, this business has been profitable on an operating profit basis and has grown to become the second pillar of business alongside the Entertainment Business. In April 2022, a group restructuring was carried out, and the business was transferred to a structure centred on AGEST. The development of DX and the trend towards outsourcing software testing are expected to grow further. In response to this, by instituting measures such as differentiating itself by investing in cutting-edge quality technology, the company is expected to sustain high growth of the Enterprise Business.
▷Entertainment Business also has new growth potential: The Company commands a dominant share in the domestic game debugging market, and the Entertainment Business has been the source of the Company‘s solid financial base, consistently delivering high operating margins of around 20%. On the other hand, the high market share has limited growth in the domestic market. However, with the recent increase in the overseas development of games and the rise in content utilising new technologies such as the Metaverse and Web 3.0 (NFT), new growth is expected in this field. The new DH Group, created by spinning off its Enterprise Business, will be able to spend its ample cash on the Entertainment Business intensively, thereby achieving further growth. The new DH Group aims to transform itself from a “Domestic game debugging company” to a “Global quality partner in the entertainment industry .” It has already announced alliances with overseas companies and is steadily taking steps to realise this goal.
The new DH Group’s business model could be compared to that of Keywords Studios (KWS.L) in Ireland, which operates in more than 50 territories in 21 countries worldwide. It provides the video games industry worldwide with solutions and resources for all game business challenges, from game development to debugging, translation and customer support, and is highly regarded by its customers. Keywords Studios is listed on the London Stock Exchange and has a market capitalisation of over 200 billion yen, which exemplifies the high regard of investors.
▷AGEST spin-off listing planned to maximise the growth potential of both businesses.: In May 2023, the Company announced the start of preparations for a share distribution spin-off and listing of AGEST, the principal subsidiary of its Enterprise Business. As noted above, the Enterprise Business and Entertainment Business each have significant potential for future growth. The Enterprise Business has grown into a new pillar of the Company’s business in recent years. It is expected to grow further, driven by the development of DX and other factors. At the same time, new growth opportunities are expected for the Entertainment Business, which is the Company’s core business. However, the Enterprise Business needs to secure system engineers who can respond to cutting-edge technological trends such as agile development and test automation, while in the Entertainment Business, securing testers and translation professionals with a deep knowledge of games is a key to competitiveness. Business models and management resources differ, such as the technology and human resources required. Therefore, considering the future growth potential of each business, the Company has decided that it is more appropriate to operate each business under an independent management structure rather than combine them under the current holding company. The aim is to achieve further growth in both businesses by establishing the most suitable business structure for the new AGEST Group and the new Digital Hearts (DH) Group.
The Company aims to list the new AGEST by the end of 2025 after finalising the scheme and examination by the stock exchange on the Company, etc. Preparations for the listing appear to be progressing steadily as planned, with the reallocation of human resources and mid-career recruitment already underway to build the headquarters functions as a listed company.
Based on these next growth strategies, the Company has set high targets for FY2029/3: sales of 80 billion yen and operating profit of 8.5 billion yen for the new AGEST group, sales of 35 billion yen and operating profit of 4.5 billion yen for the new DH group. Compared to FY2023/3, the Enterprise Business is expected to grow at a CAGR of +30%, while the Entertainment Business is expected to grow at a CAGR of +10%.
Company profile*
*The future spin-off plans of AGEST have already been briefly described, but here is an overview of the Company to date.
The Company is a pure holding company whose group companies focus on system testing and debugging services that detect software defects and report them to client companies. It also provides related software development support, operation and maintenance, security and other services. Under the corporate mission of “SAVE the DIGITAL WORLD”, the Company offers comprehensive support for high-quality software development at client companies.
Segment structure and service breakdown
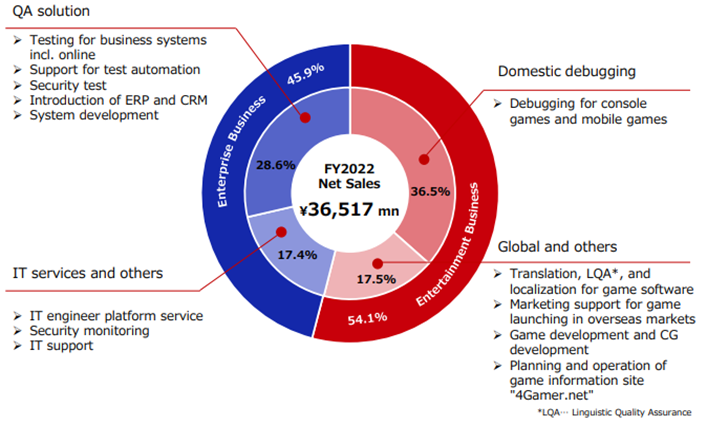
There are two business segments.
Enterprise Business: Mainly targeting enterprise systems such as web systems and business systems, QA solutions (e.g. system testing to detect faults in enterprise systems, security testing, ERP implementation support), IT services and other services (e.g. engineer dispatching, security monitoring, system maintenance and operation support, etc.). The Company focuses on differentiated services not offered by other companies, utilising shift-left support (see below, p. 10) and advanced quality technology.
Entertainment Business: Mainly for entertainment-oriented content of console games, mobile games, and others, the Company provides game debugging services (detecting game software defects from the user’s perspective and reporting them to the client company), translation and marketing support services necessary for the overseas development of game titles, contracted game development, and the operation of a comprehensive game information website. The Company’s principal business at its inception was game software debugging services. But in recent years, it has focused on expanding the enterprise sector, with the Enterprise Business accounting for approximately 46% of sales in FY2023/3 and the Entertainment Business about 54%, and the Enterprise Business has grown significantly to become the second main earnings driver. On a quarterly basis, the Enterprise Business exceeded the Entertainment Business in sales in Q1 FY2024/3.
See the graph on the next page for revenue trends over the past nine years.
Trends in sales and operating profit
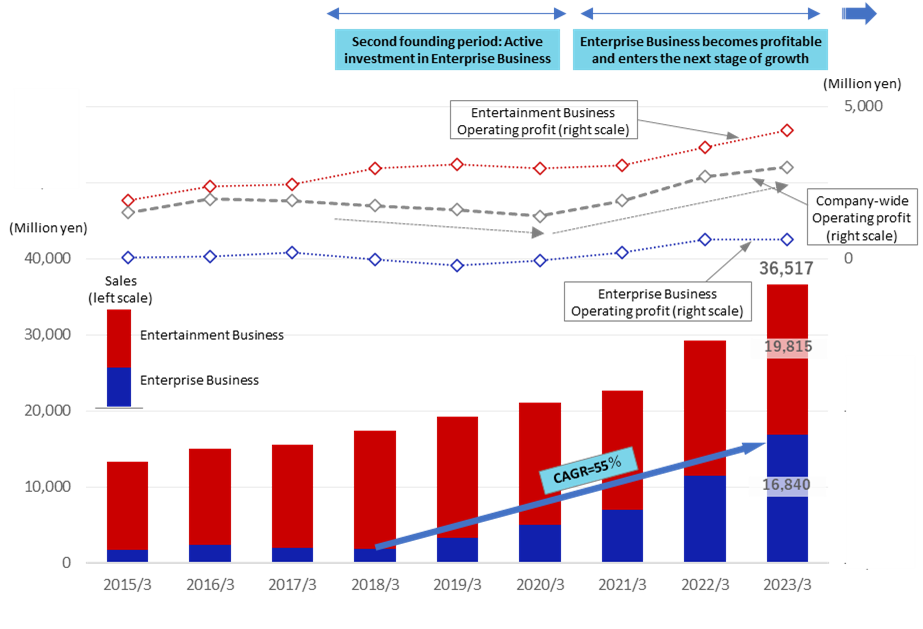
Note: Due to adjustments, the sum of the operating profit of the two businesses does not match the operating profit of the entire company.
Source: Omega Investment from company materials
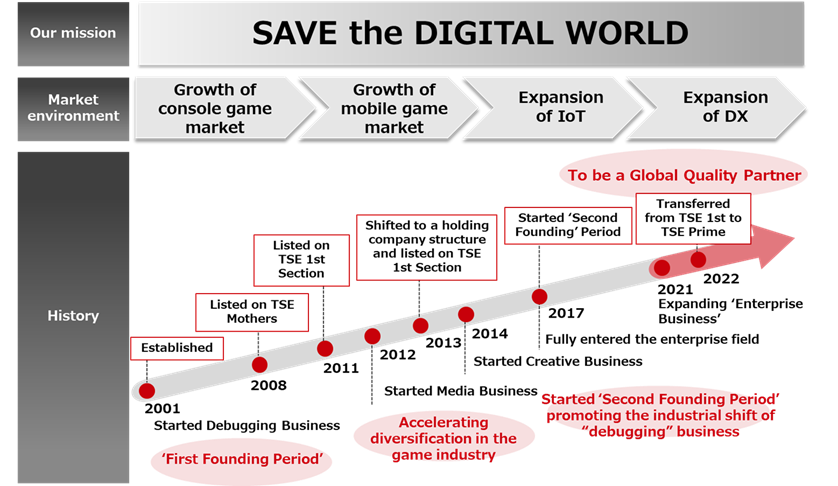
History
Founding to IPO / Becoming a holding company
The Company was founded in April 2001 when Eiichi Miyazawa, the current Director and Chairman, established DIGITAL Hearts Ltd. to provide debugging services to detect faults in the game software. The Company is one of the pioneers in the outsourced game debugging business. Mr Miyazawa’s shrewdness in spotting a business opportunity in debugging (detecting faults in game software) at the time of the rise of the video game industry is remarkable. After achieving the IPO, the Company expanded overseas. In 2013, it established Hearts United Group Co., Ltd. and shifted to a holding company structure (in July 2018, the Company changed its name to DIGITAL HEARTS HOLDINGS Co., Ltd.)
’Second Founding Period’ : Focus on Enterprise Business
Subsequently, the Company moved beyond the game debugging field to accumulate technology in the system testing and security fields and entered the enterprise field full-scale. At that time, Mr Miyazawa became Director and Chairman and invited Mr Genichi Tamatsuka, with a proven track record of managing major listed companies, etc., to become President. Under Mr Tamatsuka’s leadership, the Company invested management resources intensively in the enterprise sector as a ’Second Founding Period’. On top of recruiting personnel from outside the Company who are strong in this field, the Company actively invested in human resources and technology, including retraining and empowering internal personnel. Moreover, the Company accelerated the growth of its Enterprise Business by actively executing M&A, including the acquisition of US-based LOGIGEAR CORPORATION (‘LogiGear’), which has a proven track record in software test automation, in August 2019, as well as promoting collaboration with external parties, etc. In addition to LogiGear, the Company has since continued to undertake mergers and acquisitions, both domestically and internationally, to strengthen the human resources and technology of its Enterprise Business. In doing so, the high profits of its ancestral Entertainment Business serve as the basis of its financial strength.
Entertainment Business seeks to capture growth in overseas markets
Meanwhile, in the Entertainment Business, the Company accelerated its expansion from the domestic market, where growth is limited, to overseas operations. In March 2021, it acquired Metaps Entertainment Limited (now DIGITAL HEARTS CROSS Marketing and Solutions Limited), which provides marketing support to game manufacturers in Asia, mainly in Greater China, from Metaps Inc. While the domestic games market is maturing, the overseas games market is expected to continue to grow strongly at double-digit rates, so the Company is exploring the possibility of increasing revenues by capturing overseas business.
The new management team takes on the challenge of a period of development
In FY2021/3, with Enterprise Business achieving full-year profitability, the Company moved from its ’Second Founding’ Period to a development period. A medium-term management vision for new growth was formulated, and Yasumasa Ninomiya, who had led the Enterprise Business together with President Tamatsuka, was appointed as the new President and CEO, and Toshiya Tsukushi, who had driven several M&As as Director CFO, was appointed as Director Deputy President CFO (now Director Deputy President COO).
In April 2022, an organisational restructuring was implemented in the Enterprise Business, centred on AGEST, Inc. The Company shifted to a two-organisation structure with the Entertainment Business centred on DIGITAL HEARTS Co., Ltd.
In May 2023, the Company announced the start of preparations for a spin-off listing of AGEST, Inc. and started preparations for the establishment of AGEST’s management structure, governance and head office functions, etc. The Company aims to achieve the listing by the end of 2025.
Changes in the Company’s group
Source: Company materials
| year (e.g. AD) | month | Item |
| 2001 | Apr. | DIGITAL Hearts Ltd. established.Debugging services mainly for console games are launched. |
| 2003 | Oct. | Reorganised as a joint stock company. |
| 2007 | Sep. | First Japanese company to be accredited by Microsoft Corp. as a recommended game testing company (AXTP) for Xbox 360R. |
| 2008 | Feb. | Listed on the Mothers market of the Tokyo Stock Exchange. |
| 2011 | Feb. | Listed on the First Section of the Tokyo Stock Exchange. |
| Jul. | DIGITAL Hearts Korea Co., Ltd. is established as a consolidated subsidiary in South Korea. | |
| Oct. | DIGITAL Hearts USA Inc. is established as a consolidated subsidiary in the USA. | |
| Dec. | DIGITAL Hearts (Thailand) Co., Ltd. is established as a consolidated subsidiary in Thailand. | |
| 2012 | Mar. | G & D Co., Ltd. is established as a consolidated subsidiary. Starts providing outsourcing services for game software development. |
| May. | DIGITAL Hearts Visual Co., Ltd. is established as a consolidated subsidiary, separating 3D content production and related operations from the Company. | |
| Nov. | Acquired shares in Aetas, Inc. and made it a consolidated subsidiary. Start of media business operating the comprehensive game information website 4Gamer.nets. | |
| 2013 | Oct. | Transition to a pure holding company structure with the establishment of a pure holding company, Hearts United Group Co., Ltd. through a share transfer. |
| Nov. | Acquired shares in NetWork21 Co.,Ltd., a systems development business, and made it a consolidated subsidiary. | |
| 2014 | Apr. | Premium Agency Inc., a commissioned game developer, becomes a consolidated subsidiary through the acquisition of shares and subscription to a third-party allocation of new shares. |
| 2016 | Jan. | G & D Co., Ltd. , DIGITAL Hearts Visual Co., Ltd. and Premium Agency Inc. merged to form FLAME Hearts Co.,Ltd. |
| Jul. | DIGITAL Hearts (Shanghai) Co., Ltd. is established as a consolidated subsidiary in Shanghai, China. | |
| 2017 | Jun. | Changes to the management structure, including a change of representative directors. Start of ’Second Founding’ Period to accelerate business expansion in the enterprise domain. |
| Oct. | Merged with NetWork21 Co.,Ltd. with DIGITAL Hearts Co., Ltd. as the surviving company. | |
| 2018 | Jun. | Started working with US security venture Syack, Inc. Full-scale entry into the security business. |
| July. | Company name changed from Hearts United Group co., Ltd. to DIGITAL HEARTS HOLDINGS Co., Ltd. | |
| Aug. | Acquisition of shares in ANET Corporation, a system testing business, making it a consolidated subsidiary. | |
| Nov. | The Company has the largest number of qualified software testers in Japan and has been accredited as a Platinum Partner in the partnership programme of the International Software Testing Qualification Board (ISTQB), an international certification body for software testing. Platinum Partner accreditation | |
| 2019 | Jan. | Orgosoft Co., Ltd, which provides game debugging and localisation services in South Korea, becomes a consolidated subsidiary. |
| Aug. | LOGIGEAR CORPORATION, which has extensive test automation know-how and test engineers, becomes a consolidated subsidiary through the acquisition of shares and subscription to a third-party allocation of new shares. | |
| Nov. | Red Team Technologies Co., Ltd. established to provide penetration testing. | |
| Dec. | The Company’s consolidated subsidiary DIGITAL HEARTS Co., Ltd. establishes Digital Hearts Linguitronics Taiwan Co., Ltd. in Taiwan as a joint venture with LINGUITRONICS Co.Ltd. | |
| 2021 | Mar. | Acquisition of shares in Metaps Entertainment Limited, which provides marketing support to Chinese game makers in Asia, making a total of eight companies, including subsidiaries, consolidated subsidiaries. |
| Mar. | The Company’s consolidated subsidiary LOGIGEAR CORPORATION acquired shares in MK Partners, Inc., a system consulting company that focuses on Salesforce implementation, maintenance and operation, and made it a consolidated subsidiary. | |
| Mar. | The Company’s consolidated subsidiary LOGI GEAR VIETNAM CO, LTD. establishes TPP Soft, JSC in Vietnam as a joint venture with TP&P Technology Company, Ltd. | |
| Jun. | identity Inc., which operates an IT human resources support business, is acquired and made a consolidated subsidiary. | |
| Jul. | Achieved Global Partner accreditation, the highest level of the ISTQB Partner Programme, with an industry-leading number of qualified software testers. | |
| 2022. | Jan. | LOGIGEAR CORPORATION, a consolidated subsidiary of the Company, acquired shares in DEVELOPING WORLD SYSTEMS LIMITED, which provides support for the introduction, maintenance and operation of ORACLE products, and made it a consolidated subsidiary. |
| Mar. | CEGB Ltd, which has a proven track record in SAP implementation and operation consulting, becomes a consolidated subsidiary. | |
| Apr. | Business restructuring to integrate the Company’s Enterprise Business into AGEST, Inc. (formerly Digital Hearts Networks Inc.). | |
| Apr. | Transferred from the First Section of the Tokyo Stock Exchange to the Prime Market as a result of a review of the market classification of the Tokyo Stock Exchange. | |
| Jun. | Capital and business alliance with GameWith, Inc. to strengthen the entertainment sector. | |
| Aug. | AGEST, a consolidated subsidiary of the Company, absorbed the software testing business of Sobal Corporation. | |
| Nov. | For the purpose of unifying the Group branding, the trade name of the consolidated subsidiary, Orgosoft Co., Ltd., is changed to DIGITAL HEARTS Seoul Co., Ltd. | |
| 2023 | Apr. | GPC Corporation, which has a proven track record in SAP implementation, became a consolidated subsidiary. |
| May. | AGEST Corporation, a consolidated subsidiary, announced the start of preparations for a share-distribution spin-off of AGEST and the beginning of preparations for its spin-off listing. | |
| Jul. | AGEST, Inc. established AGEST AI Lab. to promote AI-based software testing services. | |
| Aug. | The Company’s consolidated subsidiary, DIGITAL HEARTS Co., Ltd. entered into a business alliance with Localsoft, S.L. of Spain to expand services and strengthen its sales structure in Europe and the Middle East’s games sector. | |
| Sep. | The Company’s consolidated subsidiary, DIGITAL HEARTS Co., Ltd., signed a joint development agreement with Rozetta Corp. for an AI translation engine for games using generative AI. | |
| Dec. | AGEST, Inc., a consolidated subsidiary of the Company, entered into a business alliance with GLOBALSECURITY EXPERTS Inc. | |
| 2024 | Jan. | The Company established a debugging joint venture with JetSynthesys Private Limited (JS, India) and entered into a capital and business alliance with the JS Group. |
Source: prepared by Omega Investment from company data and other sources (history of Digital Hearts Inc. until September 2013).
Group Overview
Group restructuring: AGEST, responsible for Enterprise Business, is now in place.
The group consists of 24 consolidated subsidiaries (7 domestic and 17 overseas) and one non-consolidated subsidiary under the pure holding company DIGITAL HEARTS HOLDINGS Co., Ltd. (as of end-March 2023). In April 2022, the Company reorganised itself into a structure centred on AGEST, Inc. (which took over the Enterprise Business of the former DIGITAL HEARTS NETWORKS and DIGITAL HEARTS Co., Ltd.), which is responsible for Enterprise Business, and DIGITAL HEARTS Co., Ltd., which is responsible for Entertainment Business. The structure was designed to enhance expertise further and vigorously promote new value creation in each of these business domains.
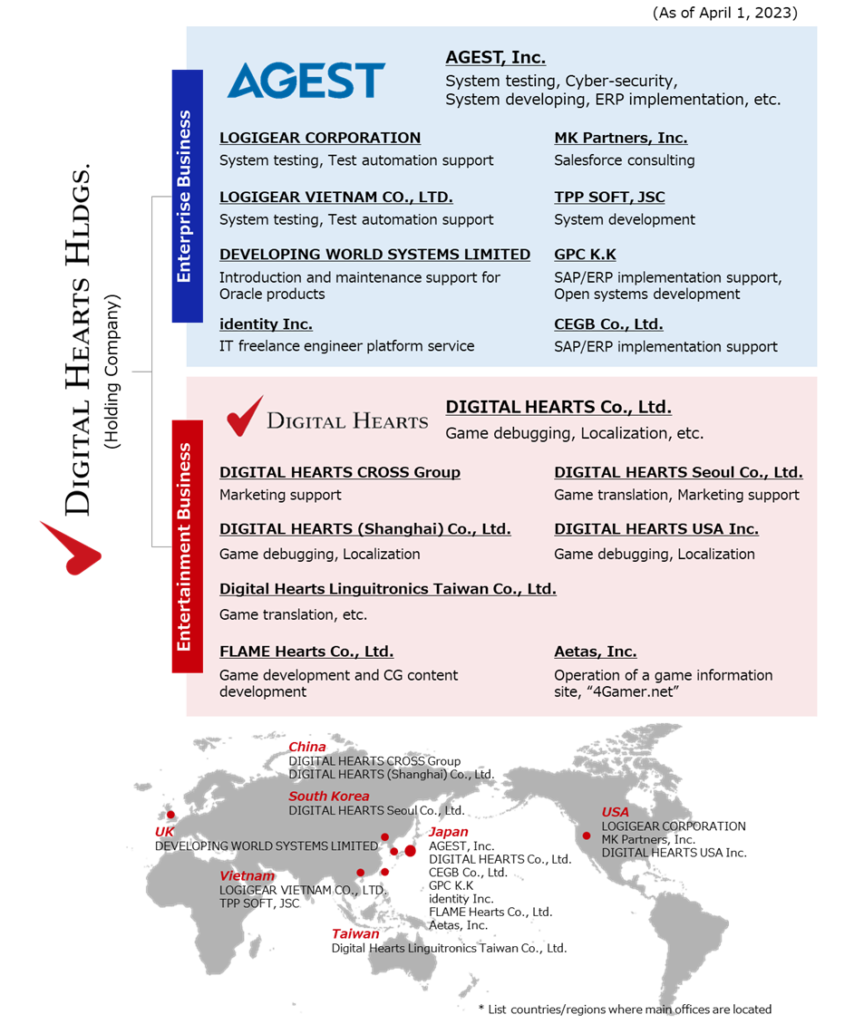
Source: Company Fact Book 2023.
Business overview
Enterprise Business
Enterprise software testing market with significant and expanding growth potential
Ensuring software quality is a key issue in the development of DX*
As society and business become increasingly ICT-oriented**, as typified by the term DX, information systems have become a vital management resource that determines corporate competitiveness. As information systems become more important than ever before, it has become critical to find and solve problems inherent in software in advance and provide systems with a high degree of completeness. Modern systems are becoming ever more expansive and complex, and network connectivity is constant, so ensuring system quality, including security, is not easy. As already witnessed, system failures in various fields, such as finance and telecommunications, have significantly impacted social life.
Outsourcing of software testing is underway
Traditionally, software development in Japan has been a relatively closed system, with vendors such as major system developers and system integrators taking on bulk orders and delivering to customers in a ‘requirements definition → design → implementation → testing → operation’ (waterfall-type development). One of the characteristics of the Japanese information services industry is that most system engineers (around 70%) belong to vendors, and system testing has been carried out in-house by vendors. On the other hand, as society becomes increasingly ICT-oriented, the shortage of IT personnel, such as system engineers and programmers, is becoming more severe in Japan, partly due to a mismatch of skills among IT personnel. Some estimates suggest a shortage of up to 800,000 personnel (according to the Ministry of Economy, Trade and Industry). As a result, major system developers maintain their development capabilities by using their engineers for key development tasks and outsourcing system testing. In addition, the skill sets required for software quality assurance differ from those needed for system development, and to ensure high quality, it is more effective to verify software from the eyes of a third party skilled in software testing. Furthermore, the recent shift from legacy software development to agile development methods has increased the expertise required for software testing. As a result, a major trend is outsourcing software testing, which used to be carried out in-house, to specialist testing companies.
The software testing market is worth approximately 6 trillion yen
The software industry in Japan is worth sales of 15,998.2 billion yen (source: “Current Survey of Selected Service Industries”, Ministry of Economy, Trade and Industry). Of this, the ratio of the testing process to the development process is estimated to be around 37.4% (source: calculated from the ratio of actual person-hours by process in the “Software Development Data Analysis Data Collection 2022” by the Information-technology Promotion Agency (IPA)). Multiplying software industry sales by the ratio of testing processes, the software testing market is estimated to be worth just under 6 trillion yen. As mentioned above, most of this testing process is currently carried out in-house, and even if only part of this is outsourced, the market potential is enormous for companies specialising in software testing. Now, there are four listed software testing specialists in the enterprise business sector, including the Company, and the combined recent sales of the four companies (enterprise business only) are around 110 billion yen, which is only 1% of the estimated market. According to a survey conducted in the US, where software testing outsourcing has been progressing, a certain amount of in-house software testing will remain, and the outsourcing ratio is estimated to be around 30-40%. Nevertheless, a significant growth market (blue ocean) awaits software testing providers and the Company.
* DX: Digital Transformation; the use of new digital technologies to create and flexibly modify new business models and ensure competitiveness in the marketplace.
** ICT: Information and Communication Technology
Estimated software testing market size
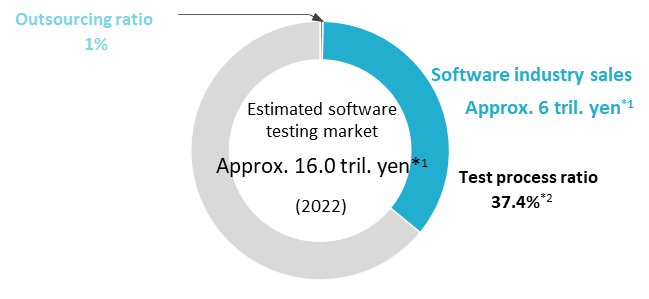
Source: *1 Ministry of Economy, Trade and Industry, ‘Current Survey of Selected Service Industries’.
*2 Information-technology Promotion Agency (IPA), ‘Software Development Analysis Data Collection 2022’.
The Company’s strengths in the enterprise market
Differentiation through investment in leading-edge quality technology
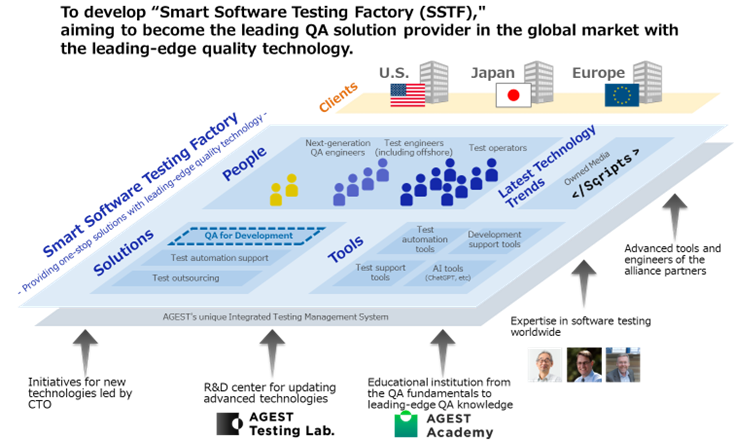
In realising growth in its Enterprise Business, the Company has set the goal of becoming the Global No.1 QA company. It aims to differentiate itself from its competitors by improving its competitiveness by introducing state-of-the-art quality technology. To this end, the Company has established the AGEST Academy and AGEST Testing Lab. These courses condense the knowledge of global experts and provide places where students can systematically learn everything from the fundamentals of testing to specialised content, such as test automation and advanced QA technology, and focus on training the next generation of QA engineers*. The Company also promotes the acquisition of ISTQB (International Software Testing Qualifications Board) certification and is one of only three Global Partners of the ISTQB in Japan.
These proactive measures have enabled the Company to respond to the recent strong demand for shift-left QA (software testing and verification from the system development and design stage rather than after the system has been developed, to increase development efficiency, improve quality and shorten development times) from advanced IT companies, etc., and to start offering “QA for Development”, which no other company can imitate.
* Next-generation QA engineers: Top-level QA engineers with knowledge of software development and testing and can optimise total quality improvement from development to post-release.
“QA for Development” with shift-left support
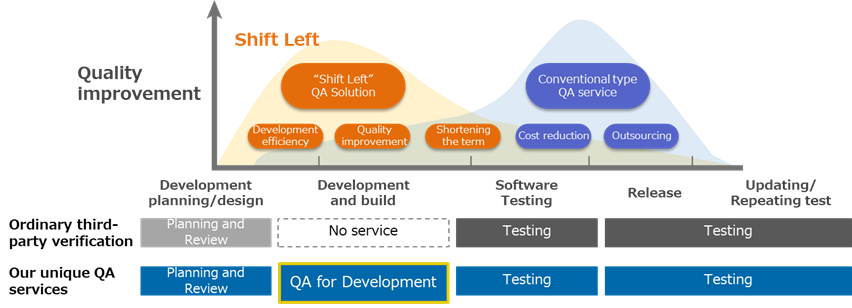
Source: Company materials
In order to provide this “QA for Development”, PP&T (People, Process and Technology) is being accelerated through the following various measures.
“QA for development“ – PP&T –
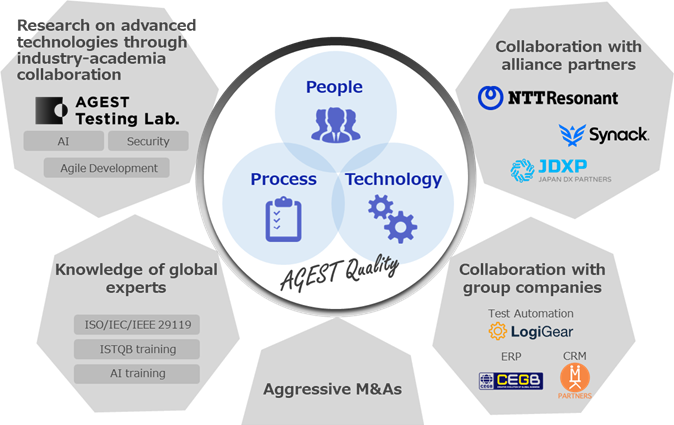
Source: Company materials
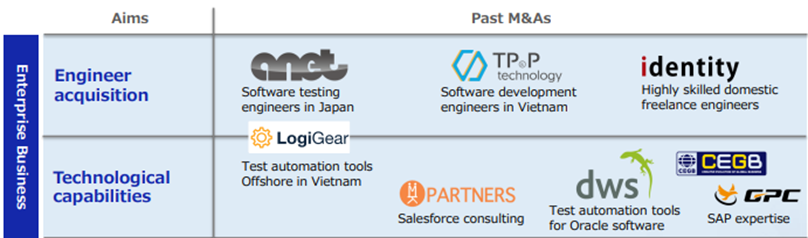
Enterprise Business’s M&A aims and achievements
Entertainment Business: Operating profit and CF
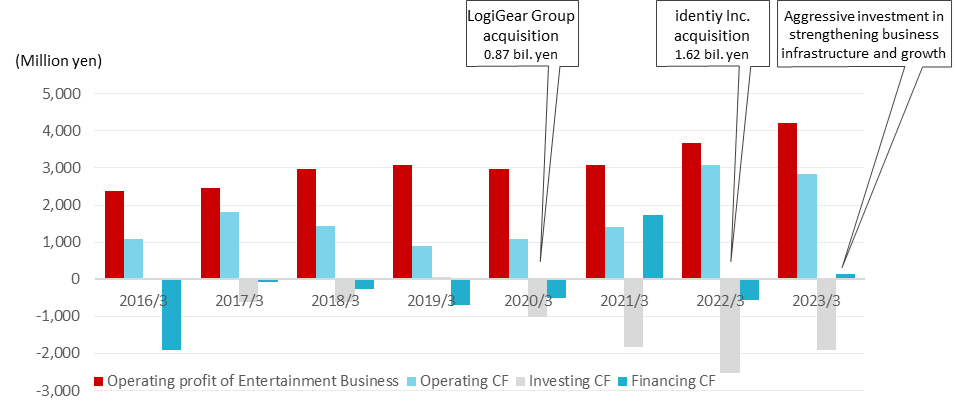
Solid financial base to support M&A strategy
To realise the aforementioned technological advantages quickly, the Company has secured human resources and acquired technological capabilities and know-how in Enterprise Business through aggressive mergers and acquisitions. This is made possible by the Company’s solid financial base. The Entertainment Business, the Company’s cash cow with domestic debugging, has maintained an operating margin of around 20% and has generated operating profits of 3 billion yen or more every year. As a result, the Company generates operating cash flow in the range of 1-3 billion yen every year, and this cash flow and the 5 billion yen or more in cash and deposits accumulated in the balance sheet have made it possible to invest in the Enterprise Business and pursue M&A strategies.
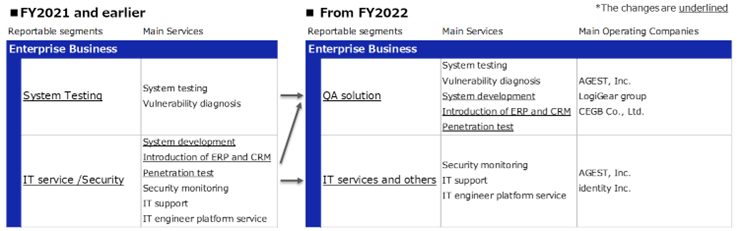
Enterprise Business – Sub-segment trends
The Enterprise Business consists of two sub-segments: a) QA solution, which mainly includes system testing, security testing and ERP implementation support; and b) IT services and others, which includes engineer dispatching, system maintenance and operation support and security monitoring. (The sub-segments have been changed from FY2023/3. Contract development, ERP/CRM implementation support and security testing, previously included in IT services and security, have been transferred to the existing system testing segment, which has been renamed QA solution. In addition, IT Services and Security, from which contracted development, ERP/CRM implementation support and security testing were removed, was changed to IT Services and Others).
As noted in the history, the Company has been actively investing in its Enterprise Business since 2017 during the ‘Second founding period’. It has focused on and developed this business as a growth driver for the next generation. As a result, the Enterprise Business recorded high sales growth with a CAGR of +54.8% from FY2018/3 to FY2023/3. The segment remained in the red (unprofitable) from FY2018/3 to FY2020/3 due to upfront investment in business expansion but achieved profitability in FY2021/3. The operating margin in FY2023/3 was 3.8%, but profitability has improved to a level where it records around 7% by quarters. The number of employees in the business increased at a CAGR of more than +50% over the same period, partly due to an increase in the number of employees due to M&A. At the end of FY2023/3, the business had 1,034 employees, comprising most of the workforce (see table, next page).
Enterprise Business revenue trends
| Financial year | 2018/3 | 2019/3 | 2020/3 | 2021/3 | 2022/3 | 2023/3 | CAGR 18/3〜 23/3 |
| Net sales (all company) | 17,353 | 19,254 | 21,138 | 22,669 | 29,178 | 36,517 | 16.0% |
| YoY | 12.4% | 11.0% | 9.8% | 7.2% | 28.7% | 25.2% | – |
| Enterprise Business | 1,892 | 3,302 | 5,022 | 7,021 | 11,491 | 16,840 | 54.8% |
| YoY | -3.8% | 75.8% | 52.1% | 39.8% | 63.7% | 46.5% | – |
| Composition of sales | 10.8% | 17.1% | 23.8% | 31.0% | 39.4% | 46.1% | – |
| QA Solution | 1,084 | 2,556 | 3,446 | 5,157 | 6,861 | 10,480 | 42.3% |
| YoY | 39.3% | – | 34.8% | 49.7% | 33.0% | 52.7% | – |
| Composition of sales | 6.2% | 13.3% | 16.3% | 22.7% | 23.5% | 28.7% | – |
| IT services and others** | 808 | 746 | 1,575 | 1,864 | 4,629 | 6,360 | 70.9% |
| YoY | -32.3% | – | 111.1% | 18.3% | 148.3 | 37.4% | – |
| Composition of sales | 4.7% | 3.9% | 7.5% | 8.2% | 15.9% | 17.4% | – |
| Operating profit (Corporate-wide) | 1,735 | 1,605 | 1,394 | 1,908 | 2,696 | 3,000 | 11.6% |
| YoY | -9.0% | -7.5% | -13.1% | 36.9% | 41.5% | 11.3% | – |
| Operating profit margin | 10.0% | 8.3% | 6.6% | 8.4% | 9.3% | 8.2% | – |
| Enterprise Business | (14) | (226) | (67) | 188 | 645 | 639 | – |
| YoY | – | – | – | – | 244.8% | -0.9% | – |
| Segment profit margin | -0.7% | -6.8% | -1.3% | 2.7% | 5.6% | 3.8% | – |
| No. of employees (all company, persons) | 750 | 862 | 1,330 | 1,431 | 1,683 | 1,746 | 18.4% |
| No. of employees (Enterprise Biz, persons) | 131 | 213 | 619 | 709 | 929 | 1,034 | 51.2% |
| [Temporary employees] (persons) | 7 | 45 | 103 | 123 | 130 | 143 | 82.8% |
| No. of employees (incl. temporary employees) | 138 | 258 | 721 | 832 | 1,059 | 1,177 | 53.5% |
Note: In FY2023/3, the provisional accounting treatment for business combinations was finalised, and the respective figures for FY2022/3 reflect the details of the provisional accounting treatment finalised.
*, ** Sub-segments have been changed as shown in the table below on this page, with retrospective adjustments to the new sub-segments from FY2019/3 onward. Only FY2018/3 is for the previous sub-segments; CAGR is calculated for FY2019/3 to FY2022/3.
Source: Omega Investment from company materials
(a) QA solution
QA solution is a service that detects defects in a wide range of business software, including web systems, business systems or business applications used by the enterprise. The service is provided mainly by AGEST, an Enterprise Business company, and other group companies, including the LogiGear Group, MK Partners, TPP SOFT, DEVELOPING WORLD SYSTEMS, CEGB and GPC. Specific services include web system and business system verification, test automation support, security testing, ERP implementation support, and contracted system development. QA solution’s sales grew at a CAGR of +42.3% during FY2019/3-FY2023/3, partly benefiting from M&A.
(b) IT services and others
In 2021, this included the temporary engineer staffing (SES) services provided by identity Inc., which became a subsidiary through M&A, and the security monitoring, maintenance and operational support services provided by AGEST.
identity Inc. provides freelance matching, placement and temporary staffing services for freelance engineers and other IT personnel to client companies. The addition of identity Inc. to the group has added approximately 13,000 new high-level IT engineers (on a registered basis at the time of acquisition) and significantly expanded capacity in the Enterprise Business.
*, **Changes to sub-segments
The Company has changed the sub-segments of its Enterprise Business as follows from FY2023/3.
Entertainment Business
The domestic market has become an oligopoly and is growing steadily. In overseas markets, high growth is expected to continue.
The domestic games market has matured, and the growth is stable
Entertainment Business is the Company’s ancestral business, based on debugging services for game consoles. Currently, the two main areas of entertainment debugging are game consoles (Sony PlayStation, Nintendo Switch, Microsoft Xbox and other home consoles) and mobile games. Basically, debugging revenues do not correlate to the sales value of individual software titles but depend on the number of game titles released according to the respective market trends. A look at the current size of the respective markets in Japan is as follows.
1) Domestic game market: In 2022, the Japanese domestic game market (total of home video game hardware, home video game software and online platforms) increased by 1.4% to 2,031.6 billion yen, showing some growth, unlike overseas markets. The domestic game market was flat in 2021, but hardware and software grew in 2022. The home video game hardware market grew to 209.8 billion yen (up 3.4%), and the home video game content (software) market grew to 389.3 billion yen (up 5.9%), driving growth. This was mainly due to the strong sales of large-size titles for Nintendo Switch and the increasing popularity of PlayStation 5 (PS5) and Xbox Series X/S (source: Famitsu Game White Paper 2023).
2) Mobile games: The market size in Japan in 2021 is 1,212.9 billion yen. It grew at a CAGR of +34% when smartphones were introduced, but growth has recently slowed (source: Famitsu Mobile Game White Paper 2023).
As shown, each market is maturing and can be expected to remain stable. In the case of game consoles, when a new console model goes on sale, new titles are produced around that time, which also generates demand for debugging.
In the past two years or so, the need for debugging has increased due to the introduction of many titles for game console games due to the spread of COVID-19 and stay-at-home demand.
Debugging markets: High barriers to entry
Unlike enterprise software, debugging of software in the entertainment market is commonly outsourced. While the development schedule for game production is often fluid, debugging work is not a constant occurrence, which is thought to have led to outsourcing by specialised companies that can flexibly provide debugging personnel. On the other hand, the game debugging business is also characterised by high barriers to entry. The reasons include the need to prepare verification equipment certified by hardware companies and to have a variety of verification equipment to meet customer needs, the need for a large number of testers over a short time to coincide with the launch of a new game, and the strict security management required by clients to maintain the confidentiality of pre-launch titles.
Debugging market: Increasingly oligopolistic, market size estimated at around 30-40 billion yen
The Japanese debugging market is an oligopoly, with the Company and Pole To Win Holdings (TSE: 3657; debugging is conducted by the operating company Pole To Win Corporation) almost bisecting the market. SHIFT (TSE: 3697) also entered the market in 2013. Based on the three companies’ annual reports, the market size of debugging in 2022 is estimated to be around 30-40 billion yen (however, Pole To Win may include services such as translation. Also, companies other than the three need to be considered). The market has grown at a steady single-digit rate every year for the past five years or so.
Debugging services enjoy relatively high profit margins
Due to the high barriers to entry, which have led to oligopoly, and the fact that this is an essential service for clients, debugging companies enjoy relatively high profit margins. The Company has consistently generated operating profit margins of around 20%, while competitor Pole to Win Holdings’ debugging and verification business has generated an average operating profit margin of approximately 13% (FY2020/1 to FY2022/1), making it a highly profitable business.
The global games market continues to grow strongly
The Japanese games market is mature but continues to grow at a high rate globally. The global games market was worth 208.6 billion dollars in 2022. It is expected to grow at a CAGR of +7.9%, reaching 304.7 billion dollars by 2027. Growth is particularly significant in the Asian region, represented by China, and the market size is expected to grow from 118.3 billion dollars in 2022 to 175.3 billion dollars in 2027, at a CAGR of +8.3% (source: Statista). The size of the game debugging market is not known, but with the increasing overseas expansion of game titles in recent years, demand is expected to be high for the translation and other market support services provided by the Company’s group.
The Company’s strengths in the entertainment market
High debugging share
The Company boasts a high debugging involvement rate of approximately 84% of the top 100 new console game titles (FY2023/3, the Company’s survey). It has long-standing business relationships with game developers through game titles (e.g., series titles) and has accumulated mutual know-how. Switching costs are also high for clients, so once a client is acquired, the Company receives debugging orders on an ongoing basis.
Diverse verification equipment
Verification equipment certified by hardware companies is essential for console game debugging. Mobile game debugging also requires a wide variety of verification equipment, and the Company has an extensive collection of such equipment thanks to its many years of experience. As of the end of March 2023, the Company had secured 3,019 console games and 7,169 smart devices (smartphones, etc.), enabling it to respond to various customer needs.
The Company has a pool of approximately 8,000 testers in 13 domestic labs
The Company’s major strength in the entertainment sector is its approximately 8,000 registered testers. The skills required for debugging games differ according to the type of game, e.g., shooting games, sports games, car racing, etc. To respond accurately to customer needs in a short time, it is necessary to secure experienced testers, and the Company has the industry’s top-level tester workforce. In addition to testers, more than 300 professionals from more than 30 nationalities and a diverse workforce are involved in game translation, etc. Labs have been established in 13 locations in Japan as bases for these personnel to work. Labs are equipped with all possible security measures to enable work to be carried out in them. As a measure against COVID-19, some work can also be carried out remotely.
Strong cash-generation ability
As noted regarding the enterprise field, the Company’s Entertainment Business is strong in generating stable cash. It enjoys high profit margins due to its oligopoly in this market, backed by a stable domestic demand. The business generates an operating profit of approximately 3 billion yen every year. The cash generated by the business has consequently enabled Enterprise Business to achieve rapid growth.
Entertainment Business – Sub-segment Trends
Mainly targeting console games, mobile games and other entertainment content, this segment comprises: a) Domestic debugging, a service that detects software defects from the user’s perspective and reports them to client companies; and b) Global and others, a global service that provides translation, LQA (Linguistic Quality Assurance; checking the quality of translated text and structure) and global services for marketing support, as well as creative services for contracted game development and 2D/3D graphic production, and media services such as the operation of the comprehensive game information website “4Gamer. net”, a comprehensive game information website.
As mentioned, the Entertainment Business generates stable profits due to its high market share in Japan. Over the last five years, sales in this business have grown at a CAGR of +4.9%, with an average operating margin of 20.0% over the same period.
Meanwhile, while the domestic market matures, overseas markets, including China and Asia, are growing remarkably. The Company has focused on overseas markets as a future growth target for its Entertainment Business. It acquired shares in Metaps Entertainment Limited, which provides marketing support to Chinese game makers in the Asian region, making a total of eight companies consolidated subsidiaries. In June 2021, the Company changed its name to DIGITAL HEARTS CROSS Marketing & Solutions (DHX). It is expected to take time for DHX to contribute to profits, but the Company plans to play a role in its global expansion.
In strengthening its overseas business, the Company is promoting overseas alliances to build a global network, including strengthening marketing personnel for its South Korean business and developing localisation business in Europe and the US. In August 2023, it announced a business alliance with Localsoft of Spain, aiming to expand services and strengthen its sales structure in the gaming field in Europe and the Middle East.
Entertainment Business revenue trends
| Financial year | 2018/3 | 2019/3 | 2020/3 | 2021/3 | 2022/3 | 2023/3 | CAGR 18/3〜 23/3 |
| Net sales (Corporate-wide) | 17,353 | 19,254 | 21,138 | 22,669 | 29,178 | 36,517 | 16.0% |
| YoY | 12.4% | 11.0% | 9.8% | 7.2% | 28.7% | 25.2% | – |
| Entertainment Business | 15,568 | 15,951 | 16,115 | 15,647 | 17,687 | 19,815 | 4.9% |
| YoY | 14.9% | 2.5% | 1.0% | -2.9% | 13.0% | 12.0% | – |
| Composition of sales | 89.7% | 82.8% | 76.2% | 69.0% | 60.6% | 54.2% | – |
| New sub-segments | |||||||
| Domestic debugging | – | 12,012 | 12,356 | 11,536 | 12,123 | 13,386 | 2.7% |
| YoY | – | – | 2.9% | -6.6% | 5.1% | 10.4% | – |
| Composition of sales | – | 62.4% | 58.5% | 50.9% | 41.5% | 36.7% | – |
| Global and others | – | 3,939 | 3,759 | 4,111 | 5,563 | 6,429 | 13.0% |
| YoY | – | – | -4.6% | 9.4% | 19.2% | 15.6% | – |
| Composition of sales | – | 20.5% | 17.8% | 18.1% | 19.1% | 17.6% | – |
| Old sub-segments | |||||||
| Debugging | 13,186 | 13,103 | 13,823 | 13,058 | – | – | – |
| YoY | 14.4% | -0.6% | 5.5% | -5.5% | – | – | – |
| Composition of sales | 76.0% | 68.1% | 65.4% | 57.6% | – | – | – |
| Game Consoles | 4,174 | 4,356 | 4,709 | 4,830 | – | – | – |
| YoY | 19.8% | 4.4% | 8.1% | 2.6% | – | – | – |
| Composition of sales | 24.1% | 22.6% | 22.3% | 21.3% | – | – | – |
| Mobile solutions | 7,399 | 8,172 | 8,173 | 7,653 | – | – | – |
| YoY | 18.2% | 10.4% | 0.0% | -6.4% | – | – | – |
| Composition of sales | 42.6% | 42.4% | 38.7% | 33.8% | – | – | – |
| Amusement | 1,612 | 775 | 939 | 573 | – | – | – |
| YoY | -9.3% | -51.9% | 21.2% | -38.9% | – | – | – |
| Composition of sales | 9.3% | 4.0% | 4.4% | 2.5% | – | – | – |
| Creative | 1,743 | 1,891 | 1,226 | 1,449 | – | – | – |
| YoY | 19.0% | 8.5% | -35.2% | 18.2% | – | – | – |
| Composition of sales | 10.0% | 9.8% | 5.8% | 6.4% | – | – | – |
| Media and others | 638 | 956 | 1,066 | 1,139 | – | – | – |
| YoY | 15.2% | 49.8% | 11.5% | 6.9% | – | – | – |
| Composition of sales | 3.7% | 5.0% | 5.0% | 5.0% | – | – | – |
| Operating profit (Corporate-wide) | 1,735 | 1,605 | 1,394 | 1,908 | 2,701 | 3,000 | 11.6% |
| YoY | -9.0% | -7.5% | -13.1% | 36.9% | 41.5% | 11.3% | – |
| Operating profit margin | 10.0% | 8.3% | 6.6% | 8.4% | 9.3% | 8.2% | – |
| Entertainment Business | 2,966 | 3,086 | 2,964 | 3,077 | 3,668 | 4,214 | 7.3% |
| YoY | 20.9% | 4.0% | -4.0% | 3.8% | 19.2% | 14.9% | – |
| Segment profit margin | 19.1% | 19.3% | 18.4% | 19.7% | 20.7% | 21.3% | – |
| No. of employees (all company, persons) | 750 | 862 | 1,330 | 1,431 | 1,683 | 1,746 | 18.4% |
| No. of employees (Entertainment Biz, persons) | 558 | 555 | 552 | 567 | 525 | 471 | -3.3% |
| [Temporary employees] (persons) | 3,170 | 3,261 | 3,416 | 3,288 | 3,466 | 3,570 | 2.4% |
| No. of employees (incl. temporary employees) | 3,728 | 3,816 | 3,968 | 3,855 | 3,991 | 4,041 | 1.6% |
Note: New sub-segments carry retroactively revised figures for FY2019/3; CAGR figures are for FY2019/3 to FY2023/3.
Source: Omega Investment from company materials
Financial results
Full year consolidated sales / operating profit trend

Source: the Company handout for the fiscal year results for FY2023/3 (published on May 11, 2023)
FY2023/3 financial results
SUMMARY: Sales and operating profit both hit record highs despite continued growth investment
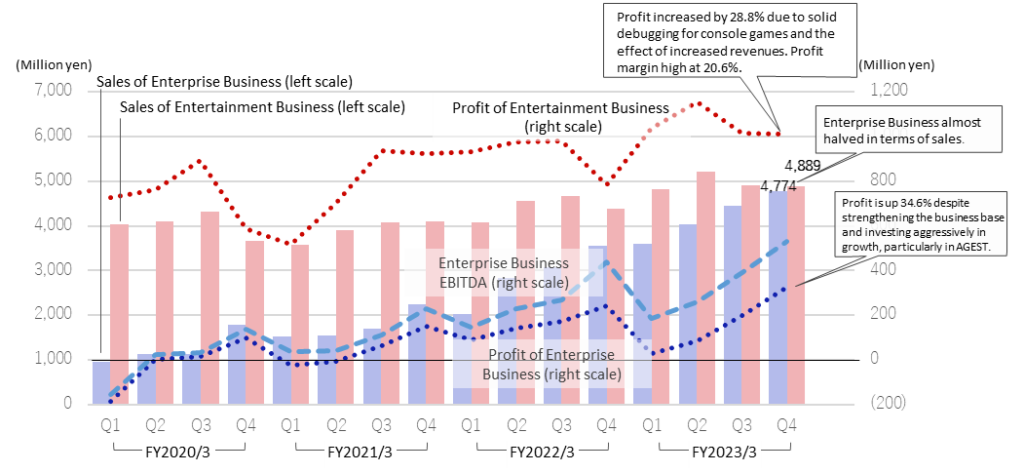
The Company’s full-year results for FY2023/3 showed a double-digit increase in sales, with record sales of 36.5 billion yen, up 25.2% YoY, thanks to solid growth in both the Enterprise Business and Entertainment Business. Despite accelerated growth investment in the Enterprise Business, operating profit rose 11.3% to a record high of 3 billion yen, supported by robust Entertainment Business revenues. On the other hand, net profit attributable to owners of the parent fell by approximately 0.8 billion yen, or 55%, due to extraordinary losses that included an impairment loss on the goodwill of a subsidiary.
FY2023/3 full-year results: Both businesses performed well and achieved record-high sales
The Company’s full-year results for FY2023/3 showed that the Enterprise Business secured profits almost on par with the previous year despite strategic investment in AGEST. Meanwhile, the Entertainment Business generated a segment profit of 4.2 billion yen thanks to double-digit sales growth in Domestic debugging and Global and others. As a result, sales rose to 36,517 million yen (+25.2%) and operating profit to 3,000 million yen (+11.3%), while EBITDA increased to 4,176 million yen or 21.8%.
On the other hand, an impairment loss on goodwill of DIGITAL HEARTS CROSS Marketing and Solutions Limited (1,045 million yen) was recorded due to the aftermath of the infection expansion in China and changes in the Chinese games market environment. Together with losses on the transfer of businesses in other Asian regions, extraordinary losses of 1,231 million yen were recorded, resulting in a net profit attributable to owners of the parent of 799 million yen, a 55% YoY decrease.
| JPY, mn, % | Net sales | YoY % |
Oper. profit |
YoY % |
Ord. profit |
YoY % |
Profit ATOP |
YoY % |
EPS (¥) |
DPS (¥) |
| 2020/3 | 21,138 | 9.8 | 1,394 | -13.2 | 1,372 | -16.9 | 792 | -49.7 | 36.31 | 14.00 |
| 2021/3 | 22,669 | 7.2 | 1,908 | 36.9 | 1,975 | 43.9 | 974 | 23.0 | 45.15 | 14.00 |
| 2022/3 | 29,178 | 28.7 | 2,696 | 41.3 | 2,774 | 40.4 | 1,778 | 82.5 | 82.25 | 15.00 |
| 2023/3 | 36,517 | 25.2 | 3,000 | 11.3 | 3,152 | 13.6 | 799 | -55.0 | 36.50 | 21.00 |
| 2024/3 (Prev. CE) | 40,750 | 11.6 | 3,120 | 4.0 | 3,160 | 0.2 | 2,100 | 162.6 | 95.86 | 21.00 |
| 2024/3 (New. CE) | 40,000 | 9.5 | 2,500 | -16.7 | 2,560 | -18.8 | 550 | -31.2 | 24.69 | 21.00 |
| 2023/3 Q2 | 17,562 | 30.1 | 1,372 | 0.2 | 1,517 | 6.0 | 945 | 3.1 | 43.70 | 10.50 |
| 2024/3 Q2 | 18,669 | 6.3 | 729 | -46.8 | 792 | -47.8 | -436 | – | -19.61 | 10.50 |
Sales/Profit by Segment
Source: Omega Investment from company materials
An analysis of changes in EBITDA shows that the Enterprise Business contributed to an increase in gross profit (877 million yen) and improved gross margin (139 million yen) as a result of higher revenue, but the negative factor was an increase in SG&A expenses (-952 million yen) due to strategic investments made mainly in AGEST. The positive factor was the impact of a newly consolidated subsidiary (218 million yen). On the other hand, the Entertainment Business saw an increase in gross profit (604 million yen) and improved gross margin (99 million yen) due to increased revenue, while an increase in SG&A expenses (23 million yen) was a negative factor. There was the impact of newly consolidated subsidiaries (1 million yen). Therefore, deciphering the attribution of the increase in EBITDA of 964 million yen, excluding the negative contribution of the rise in company-wide common expenses, the contribution of EBITDA in the Entertainment Business is significant at 70%. On the other hand, while Enterprise Business continues to invest in strengthening its operating base and growth, its cash-generation capacity has also grown significantly.
The annual dividend for FY2023/3 is 21.00 yen per share. The dividend payout ratio is 57.5%.
Segment trends
1) Enterprise Business: Sales: 16,840 million yen, +46.5%; operating profit: 639 million yen, -0.9%.
In addition to continued double-digit revenue growth in existing businesses, the business as a whole achieved growth of close to 50% YoY, partly due to the added effect of M&As carried out in the previous year.
In addition, the Company accelerated strategic investments centred on AGEST, which was formed as the core company of the Enterprise Business following the Group’s reorganisation in April 2022. AGEST led the Enterprise Business as a whole, and sales growth exceeded the initial plan. While focusing on strengthening the business base and investing in growth, SG&A expenses are under control, segment profit has increased steadily, and profit margins have also improved significantly, from 24 million yen in Q1 (profit margin 0.7%) to 79 million yen in Q2 (2.0%) to 194 million yen in Q3 (4.4%) to 340 million yen in Q4 (record high, 7.1% on a quarterly basis). Profit margins have also improved significantly. The Company secured almost the same operating profit level as the previous year for the full year, having invested heavily in growth in the first half of the year.
AGEST’s KPIs include steady growth in the number of QA engineers from 361 at the end of FY2022/3 to 508 at the end of FY2023/3 and in the number of customers with orders from 475 at the end of FY2022/3 to 558 at the end of FY2023/3. AGEST’s non-consolidated sales increased 23% from 7.5 billion yen in FY2022/3 to 9.2 billion yen in FY2023/3. High growth has been achieved in the first year of the formation of AGEST.
Trends in the sub-segments are as follows.
-QA Solution: Sales: 10,480 million yen (+52.7%). The Company continues to enjoy strong growth, particularly in Japan, driven by the DX drive of recent years, and achieved a significant YoY increase of 34.3% in existing business, excluding M&A. The scale of transactions per company is also increasing as the Company continues to strengthen its cross-selling, which it has been striving to do in recent years. In addition, it is expanding services that utilise its specialist knowledge, such as mutation testing, and increasing the number of test engineers in the QA business, which it took over from Sobal Corporation in Q2.
As a result, QA solution’s sales increased by more than double digits in the QoQ, from 2,102 million yen in Q1 to 2,481 million yen in Q2 to 2,730 million yen in Q3 to 3,165 million yen in Q4. The gross profit margin also temporarily declined in Q3 due to deteriorating earnings at overseas subsidiaries, but in Q4, the gross profit margin was again at a high level of around 35%.
QA solution’s KPIs include: number of customers with orders: 748 at end-3/2022 → 808 at end-3/2023; average customer unit price: 10 million yen at end-3/2022 → 13 million yen at end-3/2023; number of engineers: 924 at end-3/2022 → 1,009 at end-3/2023; Advanced testing and next-generation QA composition ratio 28.9% at end-3/2022 → 34.9% at the end of FY2023/3, showing steady expansion and growth.
-IT services and others: Sales: 6,360 million yen (+37.4%). The business base has expanded steadily, with the number of registered engineers at identity Inc., which became a subsidiary in June 2021, reaching 27,000. Security monitoring services are also growing steadily against a backdrop of the introduction of remote working following the spread of COVID-19.
2) Entertainment Business: Sales: 19,815 million yen, +12.0%; operating profit: 4,214 million yen,
+14.9%.
The booming console games market and the accelerated overseas content development ensure that the Company can meet increasing demand. Domestic debugging, Global and others both achieved sales growth in excess of 10%. Segment profit increased by 14.9% due to higher sales and improved gross margins in Domestic debugging. The profit margin remained high at 21.3%.
–Domestic debugging: Sales: 13,386 million yen (+10.4%). The development of new titles in the console games market has become more active. The Company received many orders for new major titles, and sales to consoles increased significantly, up 1.4 times YoY. Following a busy first half, sales remained high in the year’s second half, with a high gross margin of over 30%. In response to rising prices, the Company plans to increase hourly wages from April 2023 and focus on securing excellent human resources, aiming to strengthen service quality and increase the unit price of orders.
–Global and others: Sales: 6,429 million yen (+15.6%). Although the outlook for the Chinese market is becoming uncertain due to COVID-19 and gaming regulations in China, the Company will further strengthen its global solution capabilities by strengthening its marketing personnel in South Korean businesses and localisation in Europe and the US. The Company achieved revenue growth in all services by promoting cross-selling to existing major customers and expanding the number of languages that support localisation.
FY2024/3 Q2 results
SUMMARY: A 6% increase in revenue, but impairment charges on overseas subsidiaries led to a bottom-line loss. Full-year forecasts revised downwards. The Company plans to recover to a trend of higher revenues and profits over the second half of the year.
In the Q2 results for FY2024/3, sales increased by 6.3% YoY to 18,669 million yen, driven by the Enterprise Business. On the other hand, operating profit declined by 46.8% to 729 million yen due to lower sales in the Entertainment Business, deteriorating profitability of overseas subsidiaries in the Enterprise Business, and growth investment and AGEST’s spin-off listing costs. An extraordinary loss of approximately 1 billion yen was recorded due to goodwill impairment in overseas subsidiaries, resulting in a net loss attributable to owners of the parent of 436 million yen.
The Company has revised its full-year forecasts downwards in line with these changes. Sales were reduced from 40.75 billion yen to 40 billion yen, and operating profit was reduced from 3.12 billion yen to 2.5 billion yen. Net profit attributable to owners of the parent was decreased from 2.1 billion yen to 0.55 billion yen. For the second half of the year, the Company aims to return to the trend of higher sales and profits and achieve record-high sales and operating profit on a half-year basis.
By segment, the Enterprise Business recorded sales of 9,429 million yen (+23.8%) and operating profit of 35 million yen (-66.5%). In response to a tailwind of increased domestic IT investment, the Company recruited engineers, strengthened its technological capabilities and expanded its services, resulting in a 23.8% increase in sales, including the effect of M&As. On the profit front, segment profit fell by 66.5% to 35 million yen due to the deterioration of profitability in overseas subsidiaries, restructuring group subsidiaries in preparation for the spin-off listing of AGEST, increased headcount and expenses related to the relocation of head office functions.
Meanwhile, the Entertainment Business recorded sales of 9,299 million yen (-7.2%) and operating profit of 1,618 million yen (-26.2%). Domestic debugging maintained a high level of sales, but sales declined due to the impact of a backlash from the high sales in the previous year. Meanwhile, Global and others also experienced sluggish growth, resulting in an overall sales decline of 7.2%. Profits fell by 26.2% due to decreased sales and the impact of higher personnel costs, including an increase in tester hourly wages to secure talented personnel.
FY2024/3 full-year company forecast: Sales revised down to 40 billion yen, operating profit to 2.5 billion yen
As of the end of Q2, progress against the revised full-year forecasts for FY2024/3 of 40 billion yen in sales and 2.5 billion yen in operating profit was 46.7% and 29.2%, respectively. However, in the second half of the year, the Entertainment Business is expected to return to the trend of higher sales and profits due to the recovery of the domestic games market. At the same time, the Enterprise Business is also likely to improve profitability due to the restructuring of overseas subsidiaries (cost reductions due to changes in growth strategy and management restructuring, reduced goodwill amortisation burden, etc.). The Company has announced that it aims for sales of 21,330 million yen and operating profit of 1,770 million yen on a half-year basis, with profitability expected to improve due to increased domestic sales.
Growth strategy
AGEST’s spin-off listing and next stage of growth
In May 2023, the Company announced the start of preparations for the spin-off listing and listing of AGEST, Inc.
In conjunction with the disclosure of its FY2023/3 results, the Company announced that it had started preparations for the spin-off listing of AGEST, Inc. The Company entered the Enterprise Business substantially as its second venture in 2017. Initially, upfront investments weighed on the overall earnings. However, the Enterprise Business has accumulated sales on par with the Entertainment Business in recent years, and profitability has also been firmly established. In April 2022, the Enterprise Business shifted to an organisational structure centred on the core company AGEST, Inc. as part of a group reorganisation. The spin-off listing will take the group to a new stage of growth.
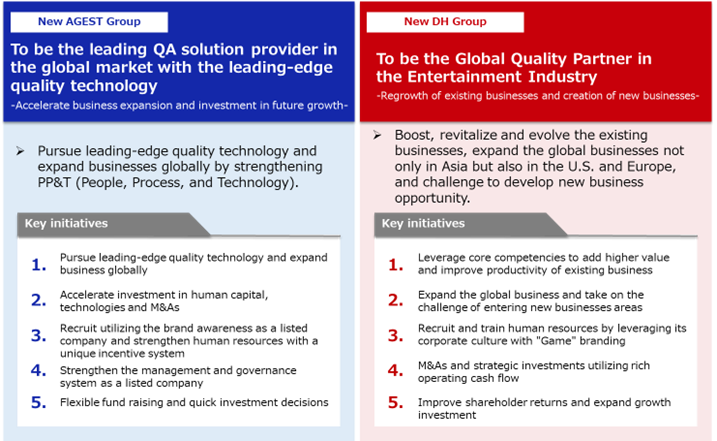
The Company’s growth image after AGEST’s spin-off listing is shown in the diagram below. The Enterprise Business will accelerate its business expansion and investment in growth to become the global No. 1 QA company, pursuing advanced quality technology. Meanwhile, the Entertainment Business, which already occupies a dominant position as one of the major players in the domestic market, plans to develop its global business with a view to non-gaming fields and new technology-related fields in Japan, as well as Asia, Europe and the US, and to grow as a global quality partner in the entertainment industry.
Image of AGEST spin-off listing
Source: the Company handout for the 1st quarter results for FY2024/3 (published on August 10, 2023)
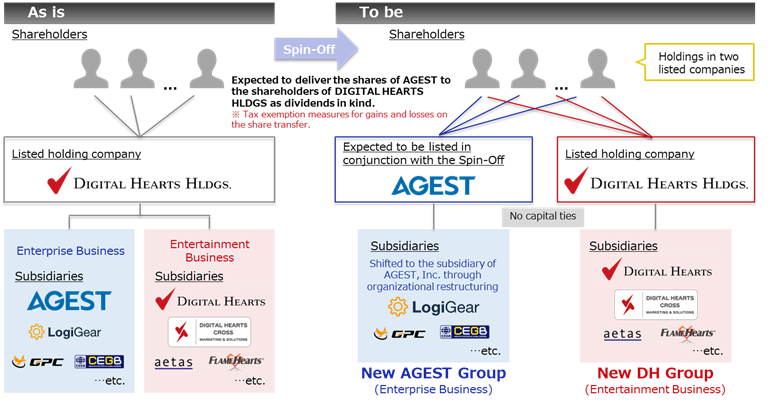
If the growth of the new AGEST Group, which has reorganised the Enterprise Subsidiaries under AGEST as well as spinning off AGEST, is further accelerated, the new AGEST will be valued at enterprise business valuations after listing. the Company describes the scheme of the spin-off listing in the diagram on the following page. On the spin-off listing, the Enterprise Business subsidiaries are reorganised under AGEST (as of 1 January 2024). On top of this, the current listed holding company, Digital Hearts Holdings, distributes AGEST shares to shareholders in kind. As a result, the capital relationship between AGEST and Digital Hearts Holdings will be dissolved, and a form of parent-subsidiary listing will be avoided. After the spin-off listing, the Company’s shareholders will then own shares in AGEST, Digital Hearts Holdings and both companies.
The details will be finalised over the next few years through preparation, scheme finalisation and examination by securities companies, auditing firms and the stock exchange, and a lead managing securities company and auditing firm will be appointed to achieve a listing by the end of 2025. In addition, the Company has been reallocating human resources and conducting mid-career recruitment to build up its head office functions as a listed company. Preparations for the listing are progressing steadily as planned.
The Company states that the expected effect of the spin-off listing is to maximise the growth potential of both businesses through the separation and independence of management, capital and human resources. To make the benefits of the spin-off listing known to shareholders, it is considered adequate to continue disseminating accurate information on the project’s progress.
Scheme of Spin-Off Listing
Source: the Company handout for the 2nd quarter results for FY2024/3 (published on November 9, 2023)
Progress of AGEST’s Spin-Off schedule

Source: the Company handout for the 2nd quarter results for FY2024/3 (published on November 9, 2023)
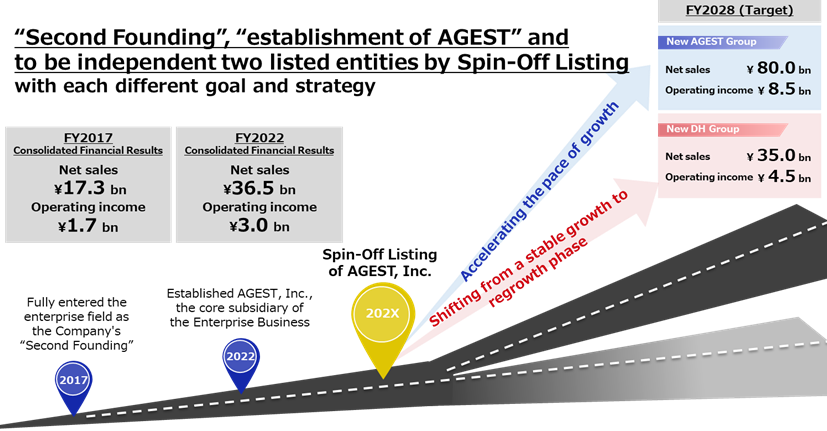
Aims of Spin-Off Listing
Source: The Company handout for the full-year results for FY2023/3 (published on May 11, 2023)
Growth strategy after spin-off listing
The Company lists the goals of the new AGEST Group and the new DH Group after the spin-off listing of AGEST and the specific measures to achieve them, as follows.
1. New AGEST Group
The Digital Hearts brand is firmly established in the Entertainment Business, but in the Enterprise Business of software testing, a new brand has been built at AGEST because of the need to appeal to engineers. If the spin-off listing is achieved, the Company will take a further step forward as an independent listed IT company to become a QA company offering advanced quality technology on a global level. The Company’s Enterprise Business mission is to become the ‘Global No.1 QA Company’ and aims to provide unparalleled ‘QA for Development’ by utilising cutting-edge quality technology.
Specifically, the Company will strengthen shift-left support (supporting quality improvement from the development and build process rather than just testing in the final development process), which has been promoted up to now, and actively invest in people, processes and technology needed for this (see also diagram on page 10). Regarding the training of next-generation QA engineers, the key personnel, the Company will accelerate the pace of the increase in the number.
Vision of the New AGEST Group
Source: the Company handout for the full-year results for FY2023/3 (published on May 11, 2023)
Targets of New AGEST Group
Source: the Company handout for the full-year results for FY2023/3 (published on May 11, 2023)
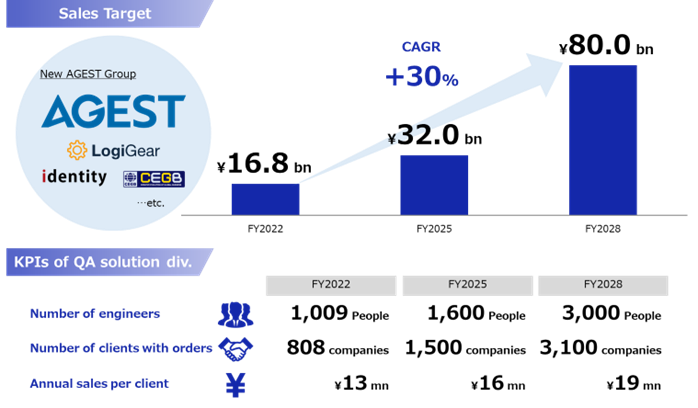
The target is to increase the number of next-generation QA engineers from 24 at the end of FY2023/3 to 500 by the end of FY2029/3 (including overseas subsidiaries). Regarding M&A, which has been actively pursued in the past, the Company is targeting companies with cutting-edge quality technology and excellent human resources to acquire companies worth several billion yen to 10 billion yen. The basic M&A policy is: 1) to maintain high investment efficiency and profitability by applying strict ROIC standards, 2) to target growing companies that are profitable on a stand-alone basis, and 3) to target companies with a balanced PMI plan between independent growth and synergy effects. The Company expects to close two to three deals per year. Promoting these initiatives, it aims to build a “Smart Software Testing Factory” on a global level.
As a result, the new AGEST Group has set out numerical targets for each of the figures in the above chart as numerical targets for the new AGEST Group. The comparison base is high because of the 50% CAGR in the last three years. However, the anticipated growth of about +30% is well within the achievable range, given 1) the recent increase in IT investment in line with DX development and 2) the increase in outsourcing needs due to the shortage of IT personnel and the need for more sophisticated and specialised testing.
2. The new DH Group
While attention tends to focus on the new AGEST in the AGEST spin-off listing, we would also like to focus on the growth strategy of the new DH Group. Until now, the Company (DHH Group as a whole) has tended to see its growth strategy as being the Enterprise Business, and the Entertainment Business has often been regarded as a cash cow for stable growth. By spinning off AGEST this time, the Company aims to pursue a new growth strategy as an Entertainment Business, which is also considered a major point of this spin-off listing.
New DH Group

Source: the Company handout for the full-year results for FY2023/3 (published on May 11, 2023)
Growth Strategy
Source: The Company handout for the full-year results for FY2023/3 (published on May 11, 2023)
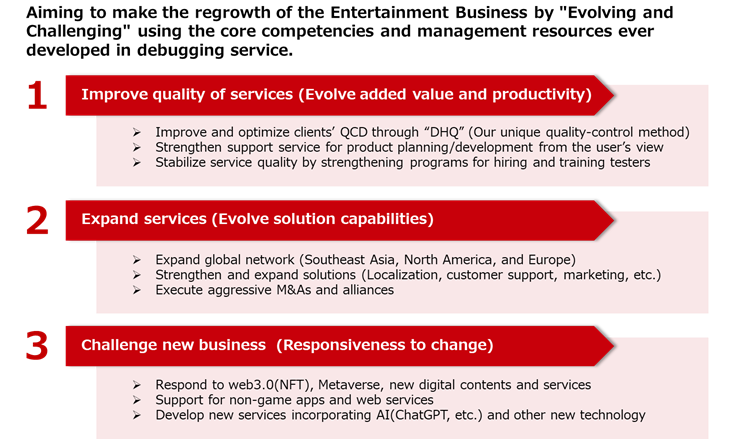
The Company has a high share of the domestic debugging market and is positioned as overwhelmingly dominant (see diagram below). In terms of infrastructure, such as hardware power and people power, it is also outstanding. However, it is also true that the domestic debugging market’s medium- to long-term growth potential is not particularly high. Therefore, the new DH Group aims to move from being a ‘Domestic game debugging company’ to a ‘Global quality partner company in the entertainment industry’. The new DH Group will focus on its business strategy by spinning off AGEST. By promoting its quality assurance service, DHQ (Digital Hearts Quality), the Company will strengthen its service quality by providing customers with the best possible QCD. In terms of service expansion, the Company will expand into new markets, including North America, Europe, and other overseas markets, by expanding its global bases. In addition, it intends to actively invest in new technology fields, such as Web 3.0 (NFT), metaverse and generative AI support, as a challenge to new domains.
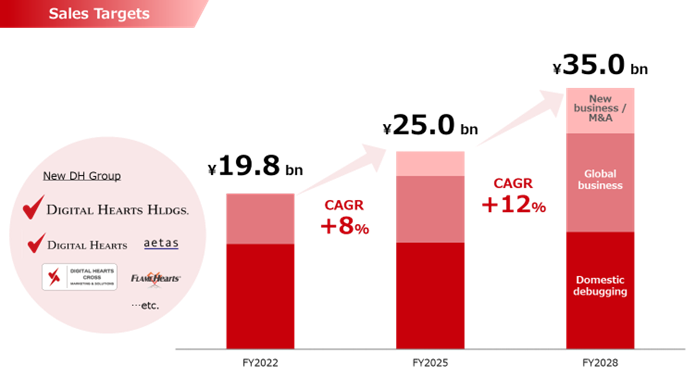
Through these measures, the new DH Group targets sales of 35 billion yen and operating profit of 4.5 billion yen in FY2029/3, with a CAGR of around +10% from FY2023/3 to FY2029/3.
Targets of New DH Group
Source: the Company handout for the full-year results for FY2023/3 (published on May 11, 2023)
Valuations of the spin-off listing
A critical point of the spin-off is that the new AGEST will be valued at a value appropriate to its Enterprise Business by spinning off AGEST as a dedicated enterprise software testing company. Until now, AGEST has been valued in tandem with the Entertainment Business, and it has not been easy to see the valuation of the Enterprise Business, even though it does not deserve a conglomerate discount very much.
A comparison of the four software testing companies (see table on p. 26 and graph on p. 25) shows that the two enterprise-specialised or near-specialised companies have superior growth, profitability and share price performance and are well regarded in the market. SHIFT (3697) has grown significantly under the leadership of its founder through aggressive mergers and acquisitions and expansion of its workforce. Also, VALTES Holdings (4442) has achieved sales growth of 22.9% in the last three years, as well as high ROE and ROA.
In the software testing business, headcount multiplied by the unit cost is one of the critical factors for growth. Still, in addition to expanding its corporate scale through M&A, the Company is also trying to differentiate itself through QA quality by pursuing cutting-edge technology, as mentioned above. If these strategies steadily progress and, in addition to the top-line growth achieved to date, results are also achieved on the bottom line, and valuations comparable to those of peers can be expected.
On the other hand, we would like to mention Keywords Studios (KWS.L) as a benchmark for the new DH Group. Keywords Studios was founded in 1998. Headquartered in Dublin, Ireland, it has over 50 studios and 7,000 staff in 21 countries and territories, providing creative and technical services to the video games industry worldwide. Its customers highly regard it for providing solutions and resources for all game business challenges, from game development to game debugging, translation and customer support. In 12/2022, it delivered sales of 690 million euros, an operating profit of 71 million euros and a net profit of 47 million euros. Keywords Studios is listed on the London Stock Exchange and has a market capitalisation of 1.31 billion GBPs (approx. 240 billion yen) as of 8 January 2024.
Keywords Studios’ business model will be an excellent reference for the new DH Group as it aims to become a global quality partner in the entertainment industry, targeting not only the domestic but also the global market.
Stock information, etc.
Digital Hearts Holdings (3676) Share Price Trend (5Year-to-date)
Share price observation
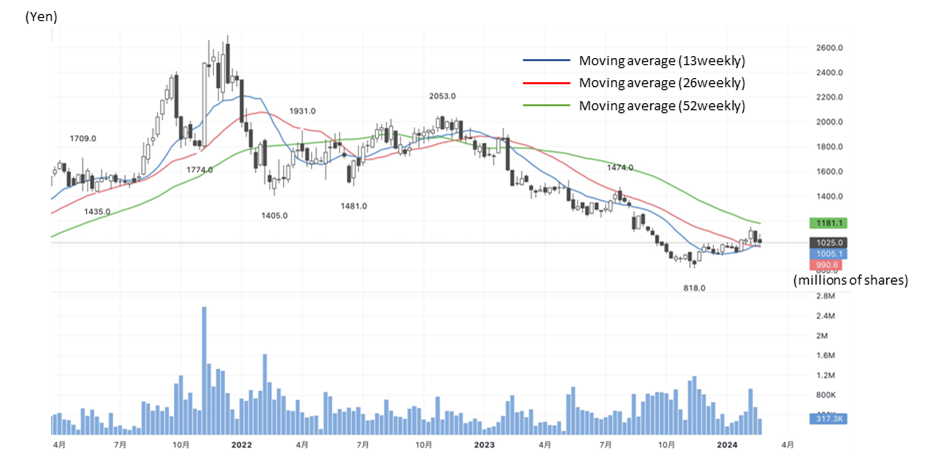
The adjustment phase continues. Is the realisation of the benefits of spin-off listing the turning point?
The Company’s share price hit 2,700 yen, the highest price since listing, on 17 December 2021, and has been on a downward trend ever since. Following the announcement of FY2024/3 Q2 results and the downward revision of its full-year forecasts, the share price fell 14% in the two days following the results announcement. The decline since the beginning of the year has been 47.7%. Since the previous year’s performance was extremely strong, some pullback was expected. However, following the extraordinary loss in FY2023/3 due to the impairment of goodwill of an overseas subsidiary in the Entertainment Business (about 1 billion yen), the Company announced an impairment loss of about the same amount at an overseas subsidiary in the Enterprise Business this fiscal year, so the surprise was probably significant.
On the other hand, the change in strategy is expected to positively result in the overseas business, which has been unprofitable on several occasions since last year, returning to profitability, and the booking of impairment charges will lighten the burden of amortisation. As seen above, preparations for the spin-off listing are progressing steadily, and we will keep a close eye on the progress, including the future recovery in financial performance.
See the table on the next page for a comparison of the financials and other data of the four software testing companies. Enterprise specialists SHIFT (3697) and VALTES Holdings (4442) outperform the Company and Pole To Win Holdings (3657) in terms of growth and profitability. As a result, the share price performance of SHIFT and VALTES has been on an upward trend over the past year, while that of the Company and Pole To Win Holdings has been on a downward trend, underperforming TOPIX. As mentioned earlier, if AGEST’s spin-off listing is realised, the share price of the new AGEST is likely to be valued at comparable valuations to those of SHIFT and VALTES Holdings, whose primary business is enterprise software testing.
Share price performance (four software testing companies, TOPIX, TSE Mothers Index)
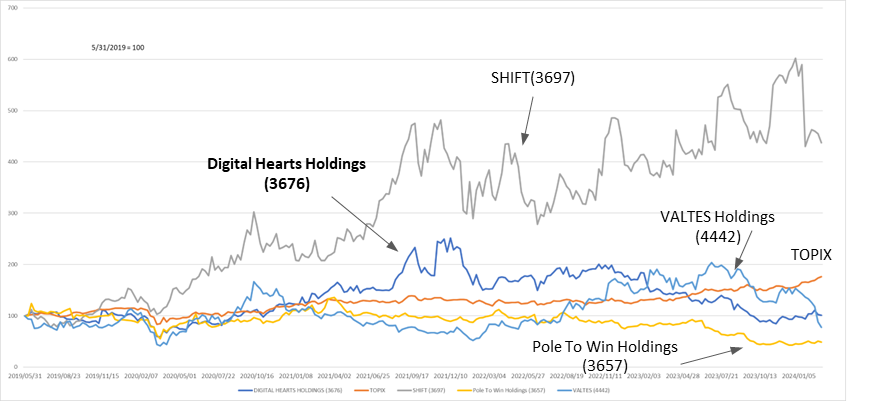
Historical PER/PBR (last five years)
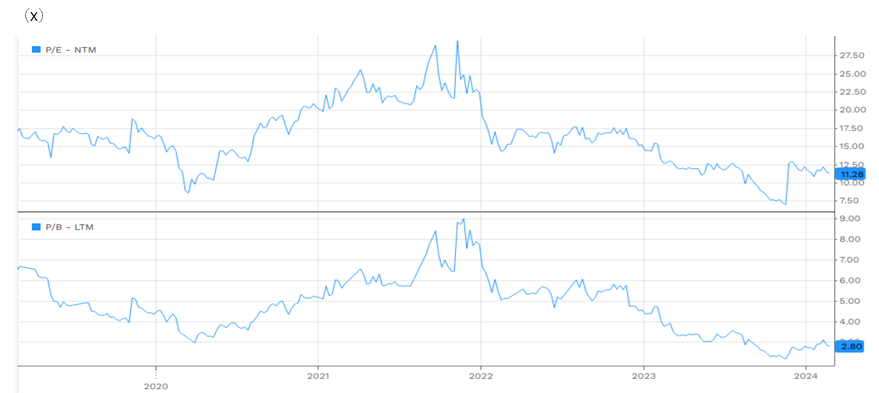
Note: PER is based on company forecasts; PBR is LTM; company forecasts for 19 May 2020 – 10 August 2020 were undetermined due to COVID-19, so figures announced on 11 August have been applied retrospectively.
Software Testing four Companies Comparison
| Code | 3676 | 3657 | 3697 | 4442 | |
| Company name | DIGITAL HEARTS HOLDINGS |
Pole To Win Holdings |
SHIFT | VALTES Holdings |
|
| Financial year | March, 2023 | January, 2023 | August, 2023 | March, 2023 | |
| Share price (2/22/2024) | 1,025 | 515 | 26,005 | 488 | |
| Market capitalisation (milion yen) | 21,633 | 18,210 | 458,390 | 10,361 | |
| PER (x: co-est basis) | 44.5 | – | 51.8 | 13.1 | |
| PBR (x: actual basis) | 2.59 | 1.12 | 16.40 | 4.33 | |
| Dividend yield (%: co-est) | 2.04 | 3.01 | – | 0.78 | |
| YTD share price change | 3.7% | 10.6% | -24.7% | -47.3% | |
| High (Since 1/1/2023) | 1,950 (2/1/23) | 993 (5/23/23) | 36,090 (12/27/23) | 1,361 (7/4/23) | |
| Low (Since 1/1/2023) | 818 (11/13/23) | 435 (12/14/23) | 21,450 (2/22/23) | 486 (2/22/24) | |
| 10-year high | 2,700 (12/13/21) | 1,585 (9/27/18) | 36,090 (12/27/23) | 1,361 (7/4/23) | |
| 10-year low | 552 (3/23/20) | 342 (8/29/16) | 640 (2/12/16) | 250 (3/23/20) | |
| Financial indicators (%) | |||||
| ROE | 10.12% | 4.50% | 22.81% | 31.63% | |
| ROA | 4.30% | 3.18% | 13.82% | 18.41% | |
| ROIC | 10.00% | 4.41% | 21.37% | 30.95% | |
| Equity Ratio | 45.0% | 64.4% | 58.5% | 58.9% | |
| Per Share Indicators | |||||
| Number of shares outstanding at end of period (thousand shares) |
23,890 | 38,156 | 17,811 | 21,450 | |
| EPS (yen: actual) | 36.50 | 21.18 | 162.71 | 95.83 | |
| BPS (yen: actual) | 395.65 | 473.76 | 1,277.48 | 9.059 | |
| DPS (yen: co-est) | 21.00 | 16.00 | 0.00 | 4.00 | |
| Financial data | |||||
| Net sales | 36,517 | 39,929 | 88,030 | 9,059 | |
| Three-year growth rate | 20.0% | 15.2% | 45.3% | 22.9% | |
| Gross profit | 10,632 | 11,051 | 29,944 | 2,703 | |
| Gross profit margin | 29.1% | 27.7% | 34.0% | 29.8% | |
| Operating profit | 3,000 | 2,724 | 11,565 | 970 | |
| Three-year growth rate | 29.1% | -8.3% | 70.0% | 44.4% | |
| Operating profit margin | 8.2% | 6.8% | 13.1% | 10.7% | |
| Net profit attributable to owners of the parent | 799 | 795 | 6,245 | 651 | |
| Three-year growth rate | 0.3% | -23.7% | 55.9% | 42.7% | |
| Net profit margin | 2.2% | 2.0% | 7.1% | 7.2% | |
| Number of employees at end of term | 1,746 | 2,998 | 6,208* | 640 | |
| Three-year growth rate | 9.5% | 18.3% | 45.1% | 18.7% | |
| Sales per Employee (thousand yen) | 20,915 | 13,318 | 10,449 | 14,154 | |
| EBITDA | 4,176 | 3,761 | 13,285 | 1,078 | |
| EBITDA margin | 11.4% | 9.4% | 15.1% | 11.9% | |
| Statements of Cash Flows | |||||
| Cash flow from operating activities | 2,850 | 1,920 | 10,167 | 846 | |
| Cash flow from investing activities | -1,903 | -2,563 | -3,721 | -639 | |
| Cash flow from financing activities | 141 | 2,011 | -1,797 | -29 | |
| Free cash flow | 948 | -643 | 6,446 | 207 | |
| Sales Composition | |||||
| Enterprise | 46.1% | – | 90.7%** | 100.0% | |
| Entertainment | 53.9% | – | 9.3%** | 0.0% | |
* The number of employees of SHIFT is based on figures as of the end of August 2022.
** SHIFT’s sales composition is based on FY8/2022 and is for reference only; from FY2023/8, the segment disclosure has been changed, and the Enterprise and Entertainment markets are no longer disclosed.
Source: Omega Investment, based on company data.
Consideration of valuations from the investor’s point of view
Consideration of the impact aspects of this restructuring of the business structure (= spin-off listing of AGEST) for investors.
The spin-off listing of AGEST, Inc. will create the new AGEST Group and the new DH Group, enabling the two companies to manage their businesses in line with their respective growth strategies going forward. A view of the valuations of each is provided below. Still, investors are expected to be more interested in the new stocks as they will allow for more precise adjustment of portfolio exposure. The nature of the businesses of both companies will become more apparent. This will result in a suitable shareholder list for each of the stocks.
As a result of the focus on the two companies’ businesses, the business value will be scrutinised, and the share price will be elaborately revalued after the spin-off. The share price of the new AGEST Group will be determined by trading by investors with high growth expectations over a short to medium time span, who pay a high multiple for risk and are willing to accept share price volatility. On the other hand, the new DH Group’s share price is expected to be priced by investors who also expect the next growth stage, in addition to the high return on equity and business predictability that have traditionally characterised the Entertainment Business.
At present, the composition of the balance sheets of both companies has not yet been determined, making it difficult to make specific calculations. However, more accurate valuations will become possible in clarifying various information, including this information, in the future.
a) A View on the valuation of new AGEST Group
The Enterprise Business’s high growth potential and profitability, which was previously integrated with the Entertainment Business and therefore difficult to value, will become more apparent as an investment target, which should significantly impact the valuations of the new AGEST Group. There are concerns that the amortisation burden of goodwill from M&As will drag on profit growth in this business, but this should be a manageable problem for investors with growth expectations.
In terms of cash flow, although the Company will no longer be able to utilise the CF generated by the Entertainment Business as it currently does, it is expected to expand investment to accelerate the growth of the Enterprise Business under a different capital policy than in the past. The new AGEST Group will be a growth stock focused on a growth strategy. The characteristics of the Company as a stock will become more easily recognisable.
b) Valuation of the new DH Group.
After the spin-off of AGEST, Inc., the following valuation premiums are expected for the new DH Group: 1) clear CF generation capability, 2) high return on capital, and 3) clear business as an investment target. On the other hand, 1) saturation or expected contraction of the game debugging market, 2) increased business risk due to overseas business expansion, and 3) rising costs in an inflationary economy are discount factors. Eliminating the amortisation burden associated with the Enterprise Business is expected to reveal solid EPS growth and expand the market capitalisation.
Furthermore, suppose the need to provide CF to the Enterprise Business is eliminated. In that case, the ample CF will enable further investment in growth areas and ensure the renewed growth of the Entertainment Business. In addition, investors will expect the same or better shareholder returns than before, which will be a significant attraction for the new DH Group shares.
In summary, the spin-off listing of the Enterprise Business is generally favourable for investors. The new AGEST Group and the new DH Group, becoming separate companies, will clarify and focus their respective business strategies, resulting in a more transparent and feasible growth path for the future. As a result, investors can consider the two companies as suitable investment targets for their respective stances. If we had to point out an immediate solid challenge, it would be that the spin-off listing is not expected to be realised until 2025. Until then, uncertainties make determining the right investment decision time difficult. The Company plans to provide more specific information as the spin-off project progresses, which should gradually dispel this uncertainty for investors.
Major shareholders
| Name | Number of shares owned |
Shareholding ratio (%) |
Change from end-March 2022 |
| Eiichi Miyazawa | 8,878,590 | 39.89 | -306,124 |
| The Master Trust Bank of Japan (Trust Account) | 2,352,600 | 10.57 | +514,700 |
| NORTHERN TRUST CO. (AVFC) RE FIDELITY FUNDS | 1,886,764 | 8.48 | +4,608 |
| Custody Bank of Japan, Ltd. (Trust Account) | 1,348,600 | 6.06 | -34,800 |
| A-1 LLC | 1,324,900 | 5.95 | 0 |
| FIDELITY INVESTMENT TRUST: FIDELITY JAPAN FUND | 306,492 | 1.38 | -1,200 |
| STATE STREET BANK AND TRUST COMPANY 505103 | 235,400 | 1.06 | +4,400 |
| J.P.MORGAN BANK LUXEMBOURG S.A. 381593 | 196,800 | 0.88 | – |
| FIDELITY INVESTMENT TRUST: FIDELITY PACIFIC BASIN FUND | 192,200 | 0.86 | -800 |
| NORTHERN TRUST CO. (AVFC) SUB A/C NON TREATY | 191,300 | 0.86 | +44,300 |
| Total | 16,913,646 | 75.99 | +201,584 |
| Number of shares issued and outstanding | 23,890,800 | 0 |
Note: The Company holds 1,632,090 treasury shares but is excluded from the above major shareholders. The percentage of shares held to the total number of shares issued (%) excludes treasury shares.
Source: Company Fact Book 2023.
The Company had 23,890,800 shares in issue and 6,837 shareholders at the end of March 2023. the Company’s founder, Eiichi Miyazawa, and his asset management company, A-1 LLC, together hold 45.84% of the Company’s shares, making them stable major shareholders. The diagram below shows shareholding by ownership. The shareholding of foreign corporations has increased in recent years, and foreign funds are among the top shareholders.
Shareholding by ownership
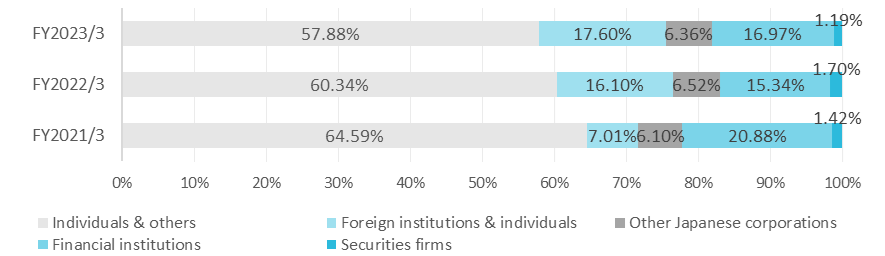
Source: Company Fact Book 2023.
Shareholder return policy
The Company regards the continuous and stable return of profits as one of its critical management tasks. It has a fundamental policy of paying dividends with a minimum dividend payout ratio of 20% while retaining the necessary internal reserves to invest in business growth and strengthen the management structure. The Company has primarily continued to pay dividends in line with this policy, with a significant increase in FY2023/3. It plans to pay the same amount in FY2024/3 (the dividend payout ratio was temporarily increased due to extraordinary losses in FY2023/3 and FY2024/3).
Dividends

Source: Omega Investment from company materials
Corporate governance and the top management
The Company is a company with a board of auditors and has one full-time auditor. 6 directors were elected at the General Meeting of Shareholders in June 2023. Half (three) of them are outside directors. Two of the outside directors are designated as independent directors. Of the 10 directors and auditors, eight are male, and two are female. All nationalities are Japanese (see next page, references). The new corporate governance code requires diversity, including gender and internationality, as a prerequisite for ensuring the effectiveness of the board of directors and board of auditors. Due to repeated mergers and acquisitions, including overseas, of the 1,746 employees (end-March 2023), there are 114 overseas employees, representing 7.8% of the total workforce. In the future, especially in the new Digital Hearts, growth strategies in the global market are expected to occupy an important position, and further diversification of the management team is expected.
The Company has also established a voluntary Nomination and Remuneration Committee as an advisory body to the Board of Directors to ensure fairness and objectivity in decision-making on management nominations and remuneration, including for group companies, and to strengthen corporate governance functions. The committee comprises three outside directors, the President and CEO and Director and Chairman, and is chaired by an outside director.
The company’s corporate governance structure
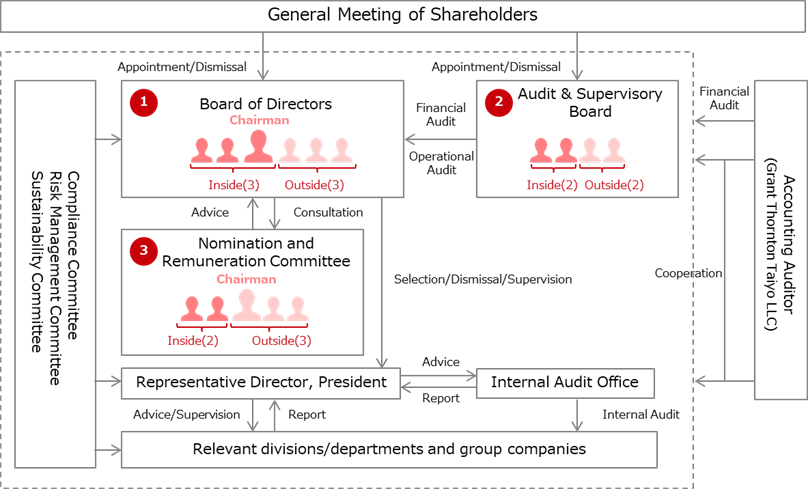
Source: Company Fact Book 2023.
❶ Board of Directors
It consists of members with diverse backgrounds, such as founders, people with experience in corporate management in various industries, certified public accountants, lawyers, etc., and discusses issues from a multifaceted perspective.
❷ Board of Auditors
Members with specialist knowledge and experience in areas such as accounting and compliance audit the directors’ performance of their duties.
❸ Nomination and Remuneration Committee
Ensures fairness and objectivity in decision-making on executive remuneration, etc. The Nomination and Remuneration Committee is consulted on important personnel matters not only for the Company but also for its subsidiaries, and the Board of Directors resolves/reports on these matters.
See the next page for the Company’s top management. As mentioned, a new management structure has been in place since June 2021, with Mr Ninomiya as President and CEO and Mr Tsukushi as Executive Vice President and CFO. Mr Tsukushi was appointed Director and Deputy President COO from April 2023. Director and Chairman Miyazawa will support both from the position of founder.
Management
Representative Director, President and CEO: Yasumasa Ninomiya

Born in 1972.
He served as a director of U-NEXT Co., Ltd. (currently USEN-NEXT Holdings) and executives of its group companies. Joined us in 2017 and promoted the launch of Enterprise Business as a director in charge of this division.
Appointed Representative Director, President and CEO in 2021. (to present)
Director and Chairman: Eiichi Miyazawa

Born in 1972.
He established the original business of DIGITAL HEARTS in 2001 and rapidly expanded it by launching a unique business model utilizing diverse human resources such as core gamers.
In 2013, shifting to a holding company structure, he became its Representative Director, President and CEO, and in 2017 he was appointed Director and Chairman. (to present)
Director, Executive Vice President and CFO: Toshiya Tsukushi
Born in 1965.
After working for a consulting company and a financial institution, he promoted the formulation of growth strategies as a director, executive officer and CFO of Nissen Holdings Co., Ltd.
Joined us in 2017 and promoted M&A deals as Director and CFO.
Appointed Director, Executive Vice President and CFO in 2021.
Appointed Executive Vice President COO in April 2022. (to present)
Outside Director: Takashi Yanagiya

Born in 1951.
At Nomura Securities Co., Ltd., he served as Representative Director, Senior Managing Director and as other titles of officers. Appointed as our Outside Director in 2014. (to present)
Outside Director: Emiko Murei

Born in 1969.
She is a certified public accountant, and currently serves as the head of her own accounting firm while serving as an associate professor of Aoyama Gakuin University Graduate School of Professional Accountancy.
Appointed as our Outside Director in 2022. (to present)
Outside Director: Ryo Chikasawa
Born in 1984.
He is qualified as an attorney and currently serves as a partner lawyer at Mori Hamada & Matsumoto.
Appointed as our Outside Director in 2022. (to present)
Standing Audit & Supervisory Board Member: Masahide Date

Born in 1971.
After working for KAIBUNDO PUBLISHING CO., LTD., he joined DIGITAL HEARTS Co., Ltd. in 2002. After serving in the Accounting Section Manager of the Administration Department, he was appointed as an Audit & Supervisory Board Member of the company in 2005.
Appointed as our Audit & Supervisory Board Member in 2013. (to present)
Audit & Supervisory Board Member: Keiya Kazama
Born in 1975. Holds certified public accountant and tax accountant qualifications. After working for Deloitte Touche Tohmatsu (currently Deloitte Touche Tohmatsu LLC), he joined DIGITAL HEARTS Co., Ltd. in 2010.
He served as General Manager of the Administration Division, Executive Officer, and Director at this company. Appointed as our director in 2013.
Appointed as our Audit & Supervisory Board Member in 2018. (to present)
Outside Audit & Supervisory Board Member: Toshifumi Nikawa

Born in 1948.
After working for financial institutions including The Mitsubishi Bank, Ltd. (currently MUFG Bank, Ltd.), he was appointed Outside Audit & Supervisory Board Member of DIGITAL HEARTS Co., Ltd. in 2008.
Appointed as our Outside Audit & Supervisory Board Member in 2013. (to present)
Outside Audit & Supervisory Board Member: Yoko Okano

Born in 1975.
She is qualified as an attorney. She has been affiliated with Gokita and Miura Law Office since 2006.
Appointed as our Outside Audit & Supervisory Board Member in 2021. (to present)
Directors’ skills matrix
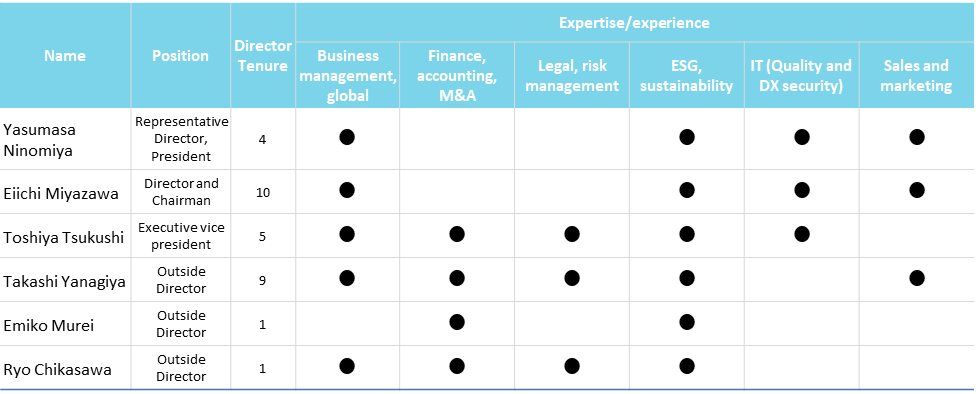
Source: Company materials
Sustainability
The Company established a Sustainability Committee in March 2021, based on the belief that it is important to have a diverse workforce in realising its corporate mission, ‘SAVE the DIGITAL WORLD’. Various initiatives were launched based on the themes of ‘human resources’, ‘technology’ and ‘communities’. The diagram below shows examples of the Company group’s initiatives and how they relate to each SDG.
Examples of the Company group’s initiatives and their relation to each of the SDG’s targets
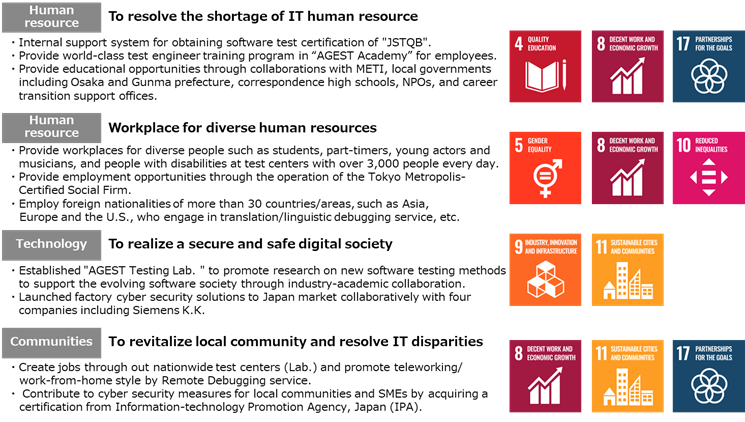
Source: Company materials
In addition, the Company has now clarified its policies on ‘human capital’, ‘intellectual property rights’ and ‘climate change’ as follows.
☆Human capital
In addition to strategically securing engineers and other personnel with specialist skills, the Company group will also actively promote the development of various IT personnel by recruiting people with varied backgrounds but with potential skills and utilising the Company’s training programmes. The group will use these human resources to improve service quality and technical capabilities and expand services to meet the increasingly diverse needs of clients, thereby increasing corporate value. By continuing to invest in these human capital assets, the Company aims to achieve sustainable growth and contribute to solving social issues such as the growing shortage of IT personnel.
Regarding the promotion of diversity in human capital, the Company has 329 female employees, with women accounting for 22.6% of the total workforce, 21 female managers and a 13.6% female management ratio. The Company’s target is to increase the proportion of female managers to at least 20% by FY2024.
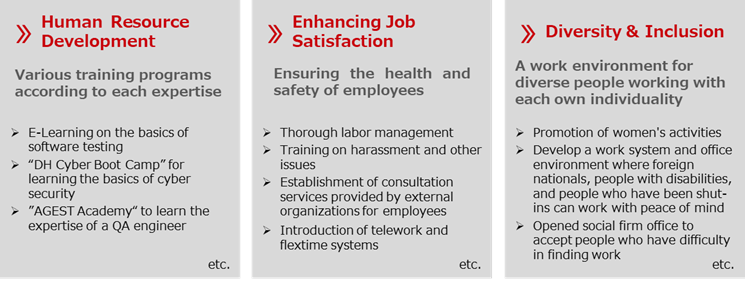
Source: Company Fact Book 2023.
☆ Intellectual property rights
The group aims to increase its corporate value by utilising the intellectual property listed in the diagram below to improve service quality and technical capabilities, expand services to meet increasingly diverse client needs, etc., and achieve sustainable growth by continuing to invest in these intellectual properties.
Main intellectual property and intangible assets
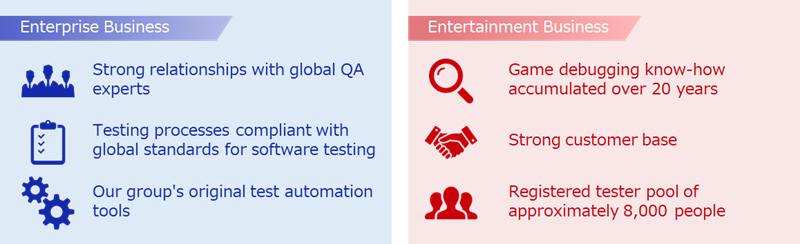
Source: Company Fact Book 2023.
☆ Climate change
The Company group also regards addressing climate change as a critical management issue and is developing a system of initiatives for disclosure based on the TCFD framework. The Sustainability Committee, chaired by the President and CEO, meets at least once a quarter in principle to discuss and manage opportunities and risks, formulate response policies and strategies, etc., and regularly reports the status of initiatives to the Board of Directors, which then supervises and advises on them. The Board of Directors provides supervision and advice.
Concerning the risks of climate change, the committee examines the extent of the impact on human life and health, corporate value and brand, social trust, business strategy and profitability according to two scenarios: the ‘1.5 ℃ scenario’, in which transition risks increase, and the ‘4 ℃ scenario’, in which physical risks increase.
Financial data I (quarterly basis )
2021/3 |
2022/3 |
2023/3 |
2024/3 |
|||||||||||
Q1 |
Q2 |
Q3 |
Q4 |
Q1 |
Q2 |
Q3 |
Q4 |
Q1* |
Q2* |
Q3* |
Q4* |
Q1 |
Q2 |
|
[Sales by segment] |
||||||||||||||
Net sales |
5,093 |
5,437 |
5,782 |
6,355 |
6,098 |
7,400 |
7,747 |
7,932 |
8,372 |
9,190 |
9,316 |
9,638 |
9,262 |
9,372 |
YoY |
2.1% |
3.9% |
6.0% |
16.4% |
19.7% |
36.1% |
34.0% |
24.8% |
37.3% |
24.2% |
20.3% |
21.5% |
11.0% |
2.0% |
Enterprise Business |
1,523 |
1,540 |
1,710 |
2,246 |
2,029 |
2,833 |
3,074 |
3,553 |
3,589 |
4,025 |
4,451 |
4,774 |
4,663 |
4,765 |
YoY |
59.6% |
35.1% |
50.9% |
25.2% |
33.2% |
83.9% |
79.7% |
58.2% |
76.8% |
42.0% |
44.8% |
34.3% |
29.9% |
18.4% |
Composition of sales |
29.9% |
28.3% |
29.6% |
35.3% |
33.3% |
38.3% |
39.7% |
44.8% |
42.9% |
43.8% |
47.8% |
49.5% |
50.2% |
50.8% |
QA Solution |
1,129 |
1,127 |
1,267 |
1,633 |
1,395 |
1,572 |
1,772 |
2,121 |
2,102 |
2,481 |
2,730 |
3,166 |
3,101 |
3,186 |
YoY |
– |
– |
– |
– |
23.6% |
39.5% |
39.9% |
29.9% |
50.7% |
57.8% |
54.1% |
49.3% |
47.5% |
28.4% |
Composition of sales |
22.2% |
20.7% |
21.9% |
25.7% |
22.9% |
21.2% |
22.9% |
26.7% |
25.1% |
27.0% |
29.3% |
32.8% |
33.9% |
34.0% |
IT services and others |
393 |
413 |
442 |
613 |
634 |
1,260 |
1,301 |
1,432 |
1,486 |
1,543 |
1,721 |
1,608 |
1,562 |
1,579 |
YoY |
– |
– |
– |
– |
61.3% |
205.1% |
194.3% |
133.6% |
134.3% |
22.4% |
32.3% |
12.4% |
5.1% |
2.3% |
Composition of sales |
7.7% |
7.6% |
7.6% |
9.6% |
10.4% |
17.0% |
16.8% |
18.1% |
17.7% |
16.8% |
18.5% |
16.7% |
16.8% |
16.8% |
Entertainment Business |
3,566 |
3,900 |
4,072 |
4,109 |
4,069 |
4,566 |
4,672 |
4,378 |
4,818 |
5,201 |
4,906 |
4,889 |
4,661 |
4,638 |
YoY |
-11.6% |
-4.7% |
-5.8% |
12.1% |
14.0% |
17.1% |
14.7% |
6.6% |
18.4% |
13.9% |
5.0% |
11.7% |
-3.3% |
-10.9% |
Composition of sales |
70.0% |
71.7% |
70.4% |
64.7% |
66.7% |
61.7% |
60.3% |
55.2% |
57.6% |
56.6% |
52.7% |
50.7% |
50.1% |
49.5% |
Domestic debugging |
2,681 |
2,846 |
2,953 |
3,054 |
2,931 |
3,030 |
3,149 |
3,011 |
3,334 |
3,561 |
3,220 |
3,720 |
3,171 |
3,169 |
YoY |
– |
– |
– |
– |
9.3% |
6.4% |
6.7% |
-1.4% |
13.7% |
17.5% |
2.2% |
8.6% |
-4.9% |
-11.0% |
Composition of sales |
52.7% |
52.4% |
51.1% |
48.1% |
48.1% |
41.0% |
40.7% |
38.0% |
39.8% |
38.8% |
34.6% |
33.9% |
34.1% |
33.8% |
Global and others |
887 |
1,050 |
1,118 |
1,054 |
1,137 |
1,536 |
1,522 |
1,366 |
1,484 |
1,640 |
1,685 |
1,620 |
1,490 |
1,468 |
YoY |
– |
– |
– |
– |
28.2% |
46.3% |
36.1% |
29.6% |
30.4% |
6.8% |
10.7% |
18.5% |
0.4% |
-10.5% |
Composition of sales |
17.4% |
19.3% |
19.3% |
16.6% |
18.7% |
20.8% |
19.7% |
17.2% |
17.7% |
17.8% |
18.1% |
16.8% |
16.0% |
15.7% |
Operating profit |
158 |
369 |
655 |
725 |
636 |
733 |
753 |
572 |
634 |
738 |
752 |
875 |
404 |
325 |
YoY |
-16.4% |
12.4% |
19.7% |
121.3% |
301.3% |
98.5% |
14.9% |
-21.1% |
-0.3% |
0.6% |
-0.2% |
52.8% |
-36.3% |
-55.9% |
Operating profit margin |
3.1% |
6.8% |
11.3% |
11.4% |
10.4% |
9.9% |
9.7% |
7.2% |
7.6% |
8.0% |
8.1% |
9.1% |
4.3% |
3.5% |
Enterprise Business |
-21 |
-7 |
64 |
152 |
87 |
144 |
171 |
241 |
24 |
79 |
194 |
340 |
83 |
-48 |
YoY |
– |
– |
360.3% |
51.3% |
– |
– |
163.8% |
58.7% |
-72.0% |
-45.2% |
13.3% |
40.6% |
240.4% |
– |
Segment profit margin |
-1.4% |
-0.5% |
3.8% |
6.8% |
4.3% |
5.1% |
5.6% |
6.8% |
0.7% |
2.0% |
4.4% |
7.1% |
1.8% |
-1.0% |
Entertainment Business |
517 |
700 |
936 |
923 |
930 |
975 |
978 |
783 |
1,036 |
1,155 |
1,014 |
1,008 |
844 |
774 |
YoY |
-28.9% |
-8.0% |
5.0% |
57.9% |
79.9% |
39.3% |
4.5% |
-15.2% |
11.4% |
18.5% |
3.6% |
28.8% |
-18.5% |
-33.1% |
Segment profit margin |
14.5% |
17.9% |
23.0% |
22.5% |
22.9% |
21.4% |
20.9% |
17.9% |
21.5% |
22.2% |
20.7% |
20.6% |
18.1% |
16.7% |
Note: * In the fourth quarter of FY2023/3, the provisional accounting treatment for the business combination was finalised and is reflected in the operating profit of the Corporate and Enterprise Business. In addition, the sub-segmentation of the Enterprise Business has been changed from FY2023/3. Total and overall segment totals may not match due to sales and operating profit adjustments.
Source: Omega Investment from company materials
Financial data II (quarterly basis )
2021/3 |
2022/3 |
2023/3 |
2024/3 |
|||||||||||
Q1 |
Q2 |
Q3 |
Q4 |
Q1 |
Q2 |
Q3 |
Q4 |
Q1* |
Q2* |
Q3* |
Q4* |
Q1 |
Q2 |
|
[Statements of income] |
||||||||||||||
Net sales |
5,093 |
5,437 |
5,782 |
6,355 |
6,098 |
7,400 |
7,747 |
7,932 |
8,372 |
9,190 |
9,316 |
9,638 |
9,296 |
9,372 |
Cost of sales |
3,819 |
4,002 |
4,001 |
4,700 |
4,271 |
5,290 |
5,579 |
5,645 |
5,899 |
6,478 |
6,690 |
6,817 |
6,890 |
6,978 |
Gross profit |
1,273 |
1,437 |
1,781 |
1,655 |
1,827 |
2,109 |
2,167 |
2,287 |
2,472 |
2,713 |
2,625 |
2,820 |
2,406 |
2,394 |
SG&A expenses |
1,115 |
1,067 |
1,126 |
1,150 |
1,191 |
1,375 |
1,414 |
1,714 |
1,837 |
1,970 |
1,868 |
1,961 |
2,001 |
2,068 |
Operating profit |
158 |
369 |
655 |
725 |
636 |
733 |
753 |
572 |
634 |
738 |
752 |
875 |
404 |
325 |
Non-operating income |
38 |
10 |
24 |
5 |
38 |
31 |
12 |
30 |
5 |
150 |
78 |
-14 |
15 |
55 |
Non-operating expenses |
2 |
3 |
4 |
10 |
4 |
4 |
5 |
21 |
7 |
4 |
11 |
44 |
4 |
4 |
Ordinary profit |
194 |
376 |
675 |
720 |
670 |
760 |
759 |
582 |
632 |
889 |
824 |
800 |
415 |
377 |
Extraordinary income |
19 |
32 |
|
13 |
66 |
1 |
1 |
– |
– |
41 |
33 |
– |
– |
|
Extraordinary expenses |
82 |
13 |
16 |
415 |
2 |
42 |
32 |
35 |
– |
6 |
171 |
1,052 |
2 |
1,042 |
Net profit before income taxes |
113 |
381 |
691 |
318 |
681 |
785 |
730 |
547 |
632 |
882 |
694 |
-218 |
412 |
-665 |
Total income taxes |
38 |
122 |
224 |
145 |
189 |
281 |
233 |
35 |
198 |
306 |
216 |
418 |
79 |
108 |
Net profit attributable to owners of the parent |
99 |
256 |
438 |
180 |
487 |
429 |
445 |
415 |
413 |
533 |
450 |
-601 |
338 |
-774 |
[Balance Sheets] |
||||||||||||||
Current assets |
6,648 |
7,291 |
8,017 |
9,744 |
9,604 |
9,848 |
10,658 |
10,392 |
10,874 |
12,182 |
11,569 |
12,528 |
12,160 |
13,072 |
Cash and deposits |
3,027 |
3,482 |
4,085 |
5,076 |
4,911 |
5,435 |
5,746 |
5,208 |
5,573 |
6,850 |
5,948 |
6,456 |
6,240 |
6,997 |
Notes and accounts receivable |
2,889 |
3,099 |
3,201 |
4,097 |
||||||||||
Notes, accounts receivable andcontract assets |
4,161 |
3,872 |
4,372 |
4,411 |
4,614 |
4,672 |
4,930 |
5,377 |
5,120 |
5,414 |
||||
Non-current assets |
3,205 |
3,167 |
3,160 |
4,593 |
6,321 |
6,178 |
6,342 |
7,217 |
8,158 |
8,505 |
8,343 |
7,052 |
7,234 |
6,218 |
Tangible fixed assets |
560 |
549 |
565 |
598 |
602 |
623 |
621 |
693 |
1,067 |
1,077 |
1,100 |
1,169 |
1,259 |
1,335 |
Intangible fixed assets |
1,445 |
1,424 |
1,433 |
2,670 |
4,389 |
4,244 |
4,225 |
5,139 |
5,206 |
5,750 |
5,593 |
4,188 |
4,146 |
3,021 |
Goodwill |
1,032 |
991 |
950 |
2,467 |
4,175 |
4,042 |
3,945 |
4,588 |
4,812 |
5,301 |
5,082 |
3,468 |
3,411 |
2,423 |
Investments and other assets |
1,199 |
1,193 |
1,161 |
1,324 |
1,330 |
1,309 |
1,495 |
1,384 |
1,883 |
1,678 |
1,649 |
1,694 |
1,828 |
1,861 |
Total assets |
9,854 |
10,459 |
11,177 |
14,338 |
15,925 |
16,026 |
17,001 |
17,610 |
19,033 |
20,688 |
19,913 |
19,581 |
19,394 |
19,291 |
Current liabilities |
4,450 |
4,655 |
5,061 |
7,904 |
8,954 |
8,775 |
9,354 |
9,679 |
10,759 |
11,330 |
9.495 |
9,930 |
10,126 |
10,644 |
Short-term borrowings |
2,546 |
2,551 |
2,552 |
4,728 |
5,534 |
5,406 |
5,406 |
5,421 |
6,806 |
7,106 |
5,106 |
5,106 |
5,606 |
5,606 |
Non-current liabilities |
62 |
132 |
135 |
119 |
294 |
55 |
58 |
364 |
162 |
154 |
113 |
176 |
185 |
198 |
Long-term debt |
– |
66 |
65 |
63 |
236 |
– |
– |
169 |
– |
– |
– |
– |
– |
– |
Total liabilities |
4,513 |
4,788 |
5,196 |
8,024 |
9,249 |
8,830 |
9,413 |
10,044 |
10,921 |
11,485 |
9,608 |
10,107 |
10,311 |
10,842 |
Total net assets |
5,340 |
5,670 |
5,980 |
6,314 |
6,677 |
7,196 |
7,588 |
7,566 |
8,111 |
9,202 |
10,304 |
9,474 |
9,082 |
8,448 |
Shareholders’ equity |
4,841 |
5,172 |
5,460 |
5,642 |
5,983 |
6,436 |
6,719 |
6,774 |
7,030 |
7,779 |
8,838 |
8,283 |
8,061 |
7,310 |
Capital |
300 |
300 |
300 |
300 |
300 |
300 |
300 |
300 |
300 |
300 |
300 |
300 |
300 |
300 |
Legal capital reserve |
355 |
331 |
331 |
331 |
331 |
338 |
338 |
– |
– |
60 |
375 |
393 |
66 |
70 |
Retained earnings |
6,848 |
7,105 |
7,393 |
7,575 |
7,916 |
8,342 |
8,626 |
9,019 |
9,275 |
9,809 |
10,031 |
9,427 |
9,532 |
8,757 |
Treasury shares |
-2,662 |
-2,565 |
-2,565 |
-2,565 |
-2,565 |
-2,545 |
-2,546 |
-2,545 |
-2,545 |
-2,391 |
-1,868 |
-1,838 |
-1,838 |
-1,818 |
Stock acquisition right |
13 |
13 |
13 |
13 |
– |
– |
– |
– |
– |
10 |
6 |
6 |
– |
– |
Total liabilities and net assets |
9,854 |
10,459 |
11,177 |
14,338 |
15,925 |
16,026 |
17,001 |
17,610 |
19,033 |
20,688 |
19,913 |
19,581 |
19,394 |
19.291 |
[Statements of cash flows] |
||||||||||||||
Cash flow from operating activities |
101 |
1,416 |
1,703 |
3,077 |
1,430 |
2,850 |
1,156 |
|||||||
Net profit before tax and otheradjustments |
494 |
1,504 |
1,466 |
2,744 |
1,520 |
1,996 |
-252 |
|||||||
Cash flow from investing activities |
-261 |
-1,813 |
-1,682 |
-2,537 |
-1,496 |
-1,903 |
-592 |
|||||||
Cash flow from financing activities |
|
-90 |
|
1,730 |
|
316 |
-546 |
1,488 |
141 |
-200 |
||||
Free cash flow |
-160 |
-397 |
21 |
540 |
-66 |
947 |
564 |
|||||||
Cash and cash equivalents at end of period |
-252 |
1,341 |
359 |
132 |
1,676 |
1,283 |
540 |
|||||||
Cash and cash equivalents at beginning of period |
3,704 |
3,704 |
5,041 |
5.041 |
5,173 |
5,173 |
6,454 |
|||||||
Cash and cash equivalents at end of period |
3,447 |
5,041 |
5,400 |
5,173 |
6,850 |
6,456 |
6,997 |
Note: In Q4 FY2023, the provisional accounting treatment for the business combination was finalised and reflected in operating profit on the PL. Other than this, no adjustments have been made for ordinary income and below, BS and CF, as they are not disclosed.
Source: Omega Investment from company materials.
Financial data III (full year basis )
FY2014/3 |
FY2015/3 |
FY2016/3 |
FY2017/3 |
FY2018/3 |
FY2019/3 |
FY2020/3 |
FY2021/3 |
FY2022/3 |
FY2023/3 |
|
[Statements of income] |
||||||||||
Net sales |
10,137 |
13,285 |
15,011 |
15,444 |
17,353 |
19,254 |
21,138 |
22,669 |
29,178 |
36,517 |
YoY(%) |
– |
31.0 |
13.0 |
2.9 |
12.4 |
11.0 |
9.8 |
7.2 |
28.7 |
25.2 |
Cost of sales |
6,653 |
9,336 |
10,690 |
10,938 |
12,394 |
13,791 |
15,566 |
16,235 |
20,787 |
25,885 |
Gross profit |
3,484 |
3,948 |
4,320 |
4,506 |
4,958 |
5,463 |
5,571 |
6,433 |
8,391 |
10,632 |
SG&A expenses |
1,703 |
2,431 |
2,356 |
2,599 |
3,222 |
3,857 |
4,177 |
4,524 |
5,695 |
7,631 |
Operating profit |
1,780 |
1,517 |
1,963 |
1,906 |
1,735 |
1,605 |
1,394 |
1,908 |
2,696 |
3,000 |
YoY(%) |
– |
14.8 |
29.4 |
-2.9 |
-9.0 |
-7.5 |
-13.2 |
36.9 |
41.3 |
11.3 |
Operating profit margin(%) |
17.6 |
11.4 |
13.1 |
12.3 |
10.0 |
8.3 |
6.6 |
8.4 |
9.2 |
8.2 |
Non-operating income |
22 |
66 |
43 |
128 |
57 |
109 |
22 |
80 |
112 |
220 |
Non-operating expenses |
15 |
57 |
49 |
37 |
10 |
63 |
44 |
13 |
34 |
68 |
Ordinary profit |
1,788 |
1,525 |
1,958 |
1,997 |
1,782 |
1,651 |
1,372 |
1,975 |
2,774 |
3,152 |
Extraordinary income |
18 |
|
9 |
17 |
2 |
733 |
|
55 |
83 |
75 |
Extraordinary expenses |
14 |
|
835 |
573 |
151 |
51 |
75 |
526 |
112 |
1,231 |
Net profit before income taxes |
1,792 |
1,525 |
1,132 |
1,441 |
1,632 |
2,333 |
1,296 |
1,504 |
2,749 |
1,996 |
Total income taxes |
700 |
975 |
734 |
641 |
503 |
745 |
499 |
530 |
739 |
1,109 |
Net profit attributable to owners of the parent |
1,087 |
539 |
361 |
795 |
1,200 |
1,575 |
792 |
974 |
1,778 |
799 |
YoY(%) |
– |
-50.4 |
-33.0 |
119.7 |
51.0 |
31.3 |
-49.7 |
23.0 |
82.7 |
-55.0 |
Net profit margin(%) |
10.7 |
4.1 |
2.4 |
5.1 |
6.9 |
8.2 |
3.7 |
4.3 |
6.1 |
2.2 |
[Supplementary data] |
||||||||||
EPS |
45.96 |
22.61 |
15.72 |
35.58 |
55.14 |
72.13 |
36.31 |
45.15 |
82.25 |
36.50 |
ROE(%) |
33.6 |
13.8 |
10.5 |
29.2 |
40.0 |
38.6 |
16.3 |
18.4 |
28.0 |
10.1 |
ROA(%) |
29.8 |
19.8 |
26.5 |
28.2 |
22.0 |
17.9 |
13.4 |
15.8 |
17.4 |
17.0 |
Dividends |
16.00 |
34.00 |
38.00 |
23.00 |
11.50 |
13.00 |
14.00 |
14.00 |
15.00 |
21.00 |
Dividend payout ratio (%) |
16.3 |
37.6 |
60.4 |
32.3 |
20.9 |
18.0 |
38.6 |
31.0 |
18.2 |
57.5 |
[Balance Sheets] |
||||||||||
Current assets |
5,549 |
5,756 |
5,064 |
6,221 |
6,732 |
7,403 |
7,453 |
9,744 |
10,392 |
12,528 |
Cash and deposits |
3,693 |
3,058 |
2,197 |
3,344 |
3,894 |
4,197 |
3,739 |
5,076 |
5,208 |
6,456 |
Notes and accounts receivable |
1,483 |
2,374 |
2,230 |
1,942 |
2,480 |
2,724 |
2,985 |
4,097 |
||
Notes, accounts receivable andcontract assets |
4,411 |
5,377 |
||||||||
Non-current assets |
1,611 |
2,516 |
1,469 |
1,430 |
1,842 |
2,428 |
6,178 |
6,342 |
7,217 |
7,052 |
Tangible fixed assets |
323 |
368 |
299 |
298 |
473 |
558 |
579 |
598 |
693 |
1,169 |
Intangible fixed assets |
695 |
1,505 |
580 |
238 |
286 |
763 |
1,379 |
2,670 |
5,139 |
4,188 |
Goodwill |
595 |
1,169 |
437 |
201 |
150 |
481 |
1,027 |
2,467 |
4,588 |
3,468 |
Investments and other assets |
592 |
642 |
589 |
893 |
1,082 |
1,107 |
1,225 |
1,324 |
1,384 |
1,694 |
Total assets |
7,160 |
8,272 |
6,533 |
7,651 |
8,575 |
9,832 |
10,637 |
14,338 |
17,610 |
19,581 |
Current liabilities |
3,372 |
3,823 |
3,374 |
3,759 |
3,929 |
4,192 |
5,134 |
7,904 |
9,679 |
9,930 |
Short-term borrowings |
1,610 |
1,603 |
1,299 |
1,630 |
1,600 |
1,704 |
2,546 |
4,728 |
5,421 |
5,106 |
Non-current liabilities |
20 |
280 |
69 |
1,033 |
1,075 |
627 |
63 |
119 |
364 |
176 |
Long-term debt |
12 |
216 |
46 |
2 |
– |
50 |
– |
63 |
169 |
– |
Total liabilities |
3,393 |
4,104 |
3,444 |
4,793 |
5,005 |
4,819 |
5,198 |
8,024 |
10,044 |
10,107 |
Total net assets |
3,766 |
4,168 |
3,089 |
2,858 |
3,570 |
5,012 |
5,438 |
6,314 |
7,566 |
9,474 |
Shareholders’ equity |
3,687 |
4,036 |
2,773 |
2,590 |
3,340 |
4,763 |
4,898 |
5,642 |
6,774 |
8,283 |
Capital |
300 |
300 |
300 |
300 |
300 |
300 |
300 |
300 |
300 |
300 |
Legal capital reserve |
300 |
300 |
368 |
277 |
331 |
366 |
355 |
331 |
– |
393 |
Retained earnings |
3,086 |
3,435 |
3,604 |
4,164 |
5,113 |
6,408 |
6,904 |
7,575 |
9,019 |
9,427 |
Treasury shares |
0 |
0 |
-1,499 |
-2,152 |
-2,405 |
-2,311 |
-2,662 |
-2,565 |
-2,545 |
-1,838 |
Stock acquisition right |
|
14 |
14 |
|
|
13 |
13 |
13 |
– |
6 |
Total liabilities and net assets |
7,160 |
8,272 |
6,533 |
7,651 |
8,575 |
9,832 |
10,637 |
14,338 |
17,610 |
19,581 |
Equity ratio (%) |
51.9 |
49.5 |
43.1 |
34.4 |
39.3 |
48.7 |
46.3 |
39.7 |
39.7 |
45.0 |
Book value per share |
155.63 |
171.30 |
125.80 |
119.96 |
154.61 |
219.06 |
228.62 |
263.32 |
323.21 |
395.65 |
[Statements of cash flows] |
||||||||||
Cash flow from operating activities |
1,561 |
870 |
1,080 |
1,825 |
1,436 |
889 |
1,086 |
1,416 |
3,077 |
2,850 |
Net profit before tax and other adjustments |
1,792 |
1,525 |
1,132 |
1,441 |
1,632 |
2,333 |
1,296 |
1,504 |
2,744 |
1,996 |
Cash flow from investing activities |
-368 |
-568 |
-17 |
-610 |
-618 |
62 |
-1,018 |
-1,813 |
-2,537 |
-1,903 |
Cash flow from financing activities |
308 |
-950 |
-1,913 |
-69 |
-250 |
-693 |
-515 |
1,730 |
-546 |
141 |
Free cash flow |
1,193 |
302 |
1,063 |
1,215 |
818 |
951 |
68 |
-397 |
540 |
947 |
Cash and cash equivalents at end of period |
1,508 |
-634 |
-860 |
1,146 |
564 |
258 |
-458 |
1,341 |
132 |
1,283 |
Cash and cash equivalents at beginning of period |
2,184 |
3,693 |
3,058 |
2,197 |
3,344 |
3,894 |
4,162 |
3,704 |
5,041 |
5,173 |
Cash and cash equivalents at end of period |
3,693 |
3,058 |
2,197 |
3,344 |
3,894 |
4,162 |
3,704 |
5,041 |
5,173 |
6,456 |
Note: In the year ended 31 March 2023, the provisional accounting treatment for the business combination was finalised, and the respective figures for the year ended 31 March 2022 reflect the details of the provisional accounting treatment finalised.
Source: Omega Investment from company materials.