2026-07-15
Home
Japanese

Omega Investment Co., Ltd.
Kidswell Bio (Company note – 3Q update)

| Share price (2/26) | ¥131 | Dividend Yield (24/3 CE) | – % |
| 52weeks high/low | ¥276/119 | ROE(TTM) | -128.2 % |
| Avg Vol (3 month) | 362 thou shrs | Operating margin (TTM) | -41.4 % |
| Market Cap | ¥5.0 bn | Beta (5Y Monthly) | N/A |
| Enterprise Value | ¥5.1 bn | Shares Outstanding | 38.427 mn shrs |
| PER (24/3 CE) | – X | Listed market | TSE Growth |
| PBR (23/3 act) | 4.04 X |
| Click here for the PDF version of this page |
| PDF Version |
Despite the risk of a delay in the full-year sales forecast, expectations are high for measures to enhance corporate value.
◇ Summary of 3Q FY2023 financial results:
Kidswell Bio (hereinafter referred to as “the company”) reported 3Q FY2023 sales of 1.57 billion yen (-9% YoY), an operating loss of 670 million yen (vs. an operating loss of 140 million yen in the same period of FY2022), and net loss of 750 million yen (vs. a net loss of 200 million yen in the same period of FY2022). Although actual demand for biosimilars (“BS”), which were launched in the market, appeared to be strong, one-time revenues in the same period of last fiscal year and the timing of delivery delays between this fiscal year and the previous fiscal year contributed to the decline in sales this quarter. In addition, higher costs of sales due to inflation and foreign exchange effects in overseas markets, a change in the product mix as a percentage of sales, and upfront SG&A expenses, including R&D spending, increased losses.
◇FY2023 forecast:
Although the company left its full-year forecasts unchanged, its earnings release indicated a risk that the delivery of BSs planned for the current fiscal year may be delayed to the next fiscal year due to adjustments in the manufacturing schedule by the contract manufacturer. In this case, the full-year sales forecast may not be achieved, and losses could increase. However, the company explains that this is not a decrease in actual demand but merely a carry-over of some deliveries to the next fiscal year. Hence, the impact on the business value is considered minimum.
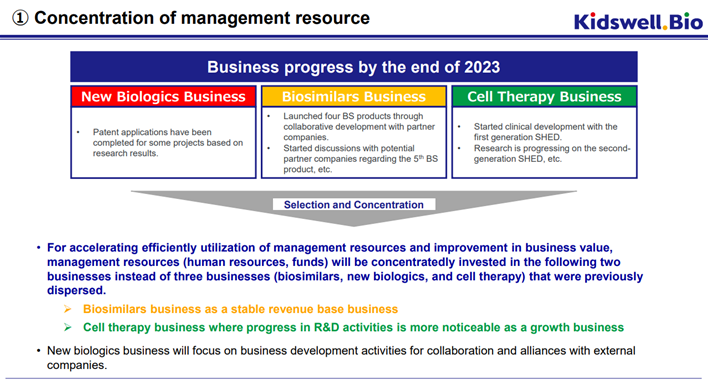
◇Corporate value enhancement measures:
The company announced its policy to select and concentrate its businesses, optimise financing methods, and visualise the value of its businesses. It will concentrate its management resources on the biosimilar and cell therapy businesses. The new biologics business will promote business development through partnerships and collaborations with external parties.
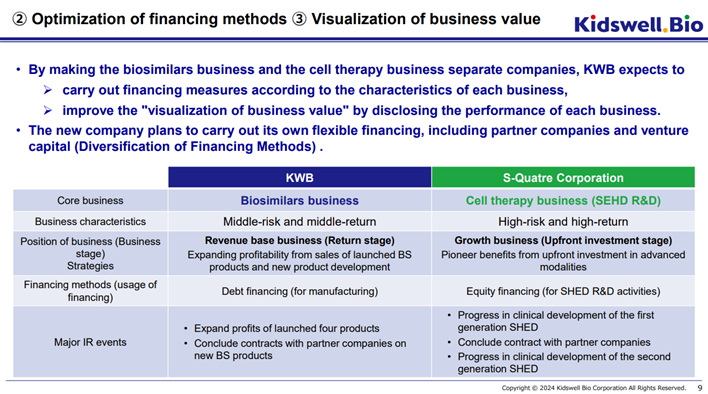
Furthermore, the company plans to spin off its cell therapy business into a wholly owned subsidiary, S-Quatre Corporation, on April 1, 2024.
As a result, the biosimilar business will become the company’s main business on a non-consolidated basis. The business has already launched four products and is now in the revenue collection phase, so it is expected that the company will be able to smoothly finance its manufacturing working capital through indirect financing and other sources and gain momentum in initiating new BS projects to sustain growth in the future.
S-Quatre Corporation, which will be spun off, is expected to fully pursue the development of SHED (Stem cells from Human Exfoliated Deciduous teeth), an advanced modality. It will plan to apply for corporate clinical trials by the end of FY2025. Due to high-risk, high-return nature of cell therapy development, the new company intends to finance its activities through equity finance from business corporations and venture capitals. The new company also plans to utilize various research and development grants as additional capital sources.
| JPY, mn, % | Net sales | YoY % |
Oper. profit |
YoY % |
Ord. profit |
YoY % |
Profit ATOP |
YoY % |
EPS (¥) |
| 2020/3 | 1,077 | – | -1,161 | – | -1,187 | – | -7,316 | – | -264.65 |
| 2021/3 | 996 | -7.5 | -969 | – | -991 | – | -1,001 | – | -34.79 |
| 2022/3 | 1,569 | 62.3 | -651 | – | -968 | – | -535 | – | -17.86 |
| 2023/3 | 2,776 | 76.9 | -550 | – | -624 | – | -657 | – | -20.77 |
| 2024/3 (CE) | 3,500 | 26.1 | -1,500 | – | -1,550 | – | -1,550 | – | -43.87 |
| 2023/3 3Q | 1,726 | – | -135 | – | -194 | – | -194 | – | -6.18 |
| 2024/3 3Q | 1,566 | -9.3 | -667 | – | -712 | – | -747 | – | -21.80 |
* FY2019 – FY2021 on a consolidated basis; FY2022 onwards on a non-consolidated basis.
◇Focus going forward:
The current investment focus on the company is whether or not it will cut back on its sales forecast, alter profit estimates for the current fiscal year, and how its shareholders’ equity and the exercise of its stock acquisition rights will be. If some sales are postponed due to the contract manufacturers’ production schedule adjustment, this will become a positive factor in next year’s performance, so this point needs to be confirmed.
From a medium-term perspective, the most significant investment interest lies in the growth of the two main businesses and the progress in visualising the value of the businesses after the spin-off in April 2024.
In the biosimilar business (Kidswell Bio on a non-consolidated basis from the next fiscal year), the critical point is whether the company can deliver a solid profit by increasing sales of the four products already on the market while executing appropriate cost measures and whether the company gains momentum in developing its new product projects. The company has already selected development candidates that are expected to be highly profitable and is in discussions with several potential co-development partners.
In the cell therapy business (S-Quatre Corporation in the next fiscal year and thereafter), the key points will be the development of the production system, etc., in preparation for the application for clinical trials for the allogenic SHED in FY2025, and the lineup of business companies and venture capitalists who will become partners, their valuation of the business, and the amount of capital they will raise.
While S-Quatre Corporation’s equity financing to a third party would dilute its shareholder interest from the perspective of its parent company, Kidswell Bio, it would also mean sharing the upfront costs incurred by S-Quatre Corporation with other shareholders of S-Quatre Corporation. In addition, the company will have access to other shareholders’ views on the value of S-Quatre Corporation’s business. This is expected to be rather positive for Kidswell Bio shareholders.
It is also essential to pay attention to how the company’s existing major shareholders evaluate the restructuring at this time.
◇Stock price trend:
Since the beginning of the year, the shares have been trading in a boxed range of 120-140 yen.
(Excerpts from the company’s supplementary materials for the 3Q of FY2023)
Financial data
FY (¥mn) |
2016/3 |
2017/3 |
2018/3 |
2019/3 |
2020/3 |
2021/3 |
2022/3 |
2023/3* |
2024/3(CE) |
2023/3
|
2024/3
|
[Statements of income] |
|||||||||||
Net sales |
1,160 |
1,089 |
1,059 |
1,021 |
1,077 |
996 |
1,569 |
2,776 |
3,500 |
1,726 |
1,566 |
Cost of sales |
500 |
397 |
422 |
412 |
653 |
119 |
550 |
1,250 |
654 |
703 |
|
Gross profit |
660 |
692 |
637 |
609 |
424 |
876 |
1,018 |
1,525 |
1,072 |
862 |
|
SG&A expenses |
1,480 |
1,876 |
1,550 |
1,414 |
1,585 |
1,846 |
1,937 |
2,076 |
1,208 |
1,529 |
|
R&D expenses |
1,075 |
1,433 |
1,107 |
945 |
898 |
963 |
1,150 |
1,216 |
579 |
807 |
|
Operating loss |
-820 |
-1,184 |
-913 |
-806 |
-1,161 |
-969 |
-919 |
-550 |
-1,500 |
-135 |
-667 |
Non-operating income |
50 |
35 |
11 |
3 |
1 |
2 |
2 |
3 |
2 |
2 |
|
Non-operating expenses |
15 |
27 |
0 |
14 |
27 |
24 |
36 |
77 |
61 |
48 |
|
Ordinary loss |
-785 |
-1,176 |
-903 |
-816 |
-1,187 |
-991 |
-952 |
-624 |
-1,550 |
-194 |
-712 |
Extraordinary income |
|
|
0 |
7 |
5 |
|
418 |
– |
– |
3 |
|
Extraordinary expenses |
|
45 |
|
45 |
6,132 |
8 |
31 |
– |
35 |
||
Loss before income taxes |
-785 |
-1,222 |
-902 |
-854 |
-7,314 |
-999 |
-533 |
-656 |
-194 |
-744 |
|
Total income taxes |
1 |
2 |
1 |
1 |
2 |
1 |
1 |
1 |
1 |
2 |
|
Net loss |
-787 |
-1,224 |
-904 |
-856 |
-7,316 |
-1,001 |
-535 |
-657 |
-1,550 |
-194 |
-747 |
[Balance Sheets] |
|||||||||||
Current assets |
1,520 |
3,421 |
2,692 |
2,821 |
3,322 |
3,346 |
3,325 |
3,697 |
3,948 |
5,036 |
|
Cash and cash equivalents |
817 |
2,379 |
1,891 |
2,009 |
2,032 |
1,461 |
1,187 |
1,067 |
1,499 |
2,186 |
|
Non-current assets |
173 |
284 |
332 |
329 |
269 |
587 |
177 |
197 |
224 |
161 |
|
Tangible assets |
2 |
1 |
1 |
1 |
1 |
3 |
1 |
1 |
1 |
1 |
|
Investments and other assets |
171 |
282 |
330 |
328 |
267 |
581 |
172 |
193 |
220 |
158 |
|
Total assets |
1,694 |
3,706 |
3,025 |
3,151 |
3,592 |
3,933 |
3,503 |
3,894 |
4,173 |
5,198 |
|
Current liabilities |
1,279 |
189 |
404 |
400 |
880 |
1,114 |
1,128 |
1,055 |
780 |
1,988 |
|
Short-term borrowings |
810 |
|
|
|
25 |
|
75 |
375 |
400 |
550 |
|
Non-current liabilities |
11 |
16 |
16 |
19 |
1,223 |
1,209 |
656 |
1,605 |
1,704 |
1,766 |
|
Total liabilities |
1,290 |
205 |
421 |
420 |
2,104 |
2,323 |
1,784 |
2,661 |
2,485 |
3,754 |
|
Total net assets |
403 |
3,500 |
2,604 |
2,731 |
1,487 |
1,610 |
1,718 |
1,233 |
1,688 |
1,443 |
|
Total shareholders’ equity |
383 |
3,472 |
2,568 |
2,695 |
1,451 |
1,291 |
1,533 |
1,037 |
1,490 |
1,276 |
|
Capital stock |
2,037 |
4,194 |
100 |
591 |
611 |
1,032 |
1,421 |
1,509 |
1,504 |
2,002 |
|
Legal capital reserve |
1,940 |
4,097 |
3,372 |
3,864 |
9,917 |
10,337 |
10,726 |
10,815 |
10,810 |
11,308 |
|
Retained earnings |
-3,594 |
-4,818 |
-904 |
-1,760 |
-9,077 |
-10,078 |
-10,613 |
-11,287 |
-10,824 |
-12,034 |
|
Evaluation/conversion difference |
-0 |
3 |
2 |
1 |
-21 |
202 |
|||||
Subscription rights to shares |
21 |
23 |
32 |
34 |
57 |
116 |
184 |
195 |
197 |
167 |
|
Total liabilities and net assets |
1,694 |
3,706 |
3,025 |
3,151 |
3,592 |
3,933 |
3,503 |
3,894 |
4,173 |
5,198 |
|
[Statements of cash flows] |
|||||||||||
Cash flow from operating activities |
-607 |
-1,759 |
-438 |
-860 |
-1,325 |
-1,267 |
-1,169 |
-1,421 |
|||
Loss before income taxes |
-785 |
-1,222 |
-902 |
-854 |
-7,314 |
-999 |
-533 |
-656 |
|||
Cash flow from investing activities |
-121 |
-149 |
-50 |
-0 |
-137 |
-22 |
526 |
-28 |
|||
Purchase of investment securities |
-116 |
-149 |
|
|
-100 |
|
|
-50 |
|||
Cash flow from financing activities |
946 |
3,471 |
|
978 |
1,221 |
718 |
369 |
1,356 |
|||
Proceeds from issuance of common shares |
486 |
3,932 |
|
973 |
40 |
138 |
369 |
34 |
|||
Net increase in cash and cash equiv. |
217 |
1,562 |
-488 |
118 |
-240 |
-571 |
-273 |
-93 |
|||
Cash and cash equiv. at beginning of period |
599 |
817 |
2,379 |
1,891 |
2,009 |
2,032 |
1,461 |
1,160 |
|||
Cash and cash equiv. at end of period |
817 |
2,379 |
1,891 |
2,009 |
2,032 |
1,461 |
1,187 |
1,067 |
|||
FCF |
-729 |
-1,909 |
-488 |
-860 |
-1,462 |
-1,289 |
-643 |
-1,450 |
Note: Consolidated basis until FY2021; non-consolidated basis from FY2022.
Source: Omega Investment from company materials