2026-07-27
Home
Japanese

Omega Investment Co., Ltd.
Itoki (Company note – 4Q update)

| Share price (3/13) | ¥1,542 | Dividend Yield (24/12 CE) | 3.37 % |
| 52weeks high/low | ¥2,200/671 | ROE(TTM) | 11.3 % |
| Avg Vol (3 month) | 549 thou shrs | Operating margin (TTM) | 6.4 % |
| Market Cap | ¥75.71 bn | Beta (5Y Monthly) | 1.37 |
| Enterprise Value | ¥67.77 bn | Shares Outstanding | 49.100 mn shrs |
| PER (24/12 CE) | 10.7 X | Listed market | TSE Prime |
| PBR (23/12 act) | 1.27 X |
| Click here for the PDF version of this page |
| PDF Version |
Sales and profits reached record highs, transforming the company into a profitable structure. The company is now in the phase of becoming highly profitable.
◇Summary of FY12/2023 4Q Financial Results: Establishment of a profitable structure. Recorded the highest profit ever and increased dividend.
Itoki’s FY12/2023 4Q results (full year) showed sales of 132.9 billion yen (+8% YoY) and operating profit of 8.5 billion yen (+86% YoY), with sales, operating profit, recurring profit, and net income all hitting new record highs (since 2005). In the final year of the mid-term plan, the company completed the “To develop an earning structure.”
The company steadily accumulated sales from renewal projects and office relocations while significantly improving profit margins through enhanced customer value. As a result, profits exceeded the company’s forecast despite increased SG&A expenses due to strategic spending. The year-end dividend for FY12/2023 was 42 yen (up 5 yen YoY).
The business alliance with Advantage Advisors was also terminated.
◇Announced new medium-term management plan: Moving into the “Profitability enhancement phase.”
The new medium-term management plan “RISE TO GROWTH 2006” for 2024-2026 has been announced. It is positioned as a “Profitability enhancement phase” to enhance sustainable growth. The plan envisions an increasing focus on improving productivity in offices and other workplaces and advancing DX in offices and IoT in office equipment. It aims to maximize business value by supporting customers’ productivity reforms on a consolidated basis and combining sales of products with sales of services. Specifically, it consists of the 7 Flags and ESG strategy based on the “Tech x Design based on PEOPLE” concept.
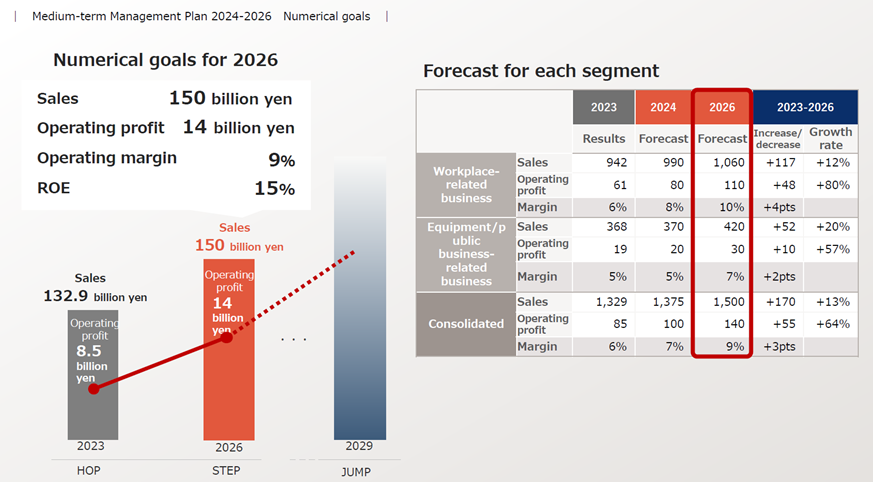
The financial targets for 2026 are sales of 150 billion yen, operating profit of 14 billion yen, operating profit margin of 9%, and ROE of 15%. The company aims to maximize shareholder value and improve PBR by reducing the cost of capital and achieving an ROE that exceeds the assumed 9-10% cost of capital, which more than meets current stock market expectations.
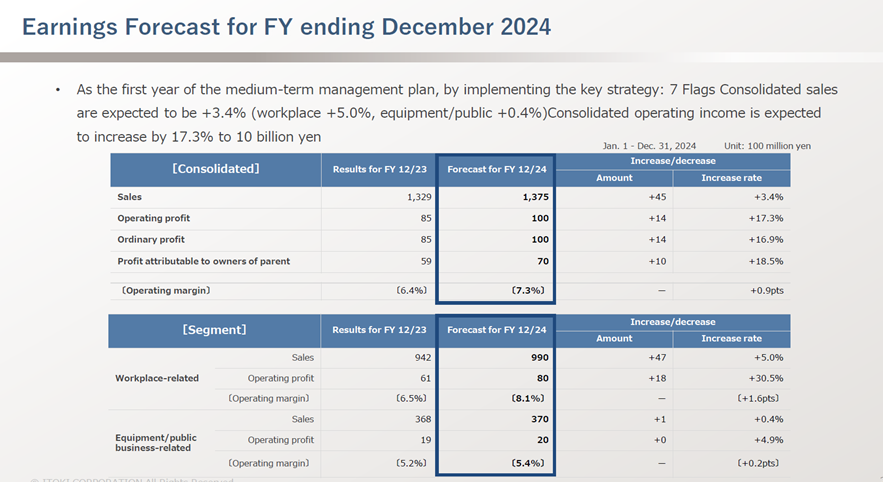
◇FY12/2024 company forecast: Continued increase in sales and operating profit; operating profit margin to rise further.
Sales are projected at 137.5 billion yen (+3% YoY), operating profit at 10 billion yen (+17% YoY), recurring profit at 10 billion yen (+17% YoY), and net income at 7 billion yen (+19% YoY). In addition to the increase in sales, the operating profit margin is expected to improve further.
◇Stock price trend:
Immediately after these results were announced, the share price soared, briefly reaching 2,200 yen, and has since adjusted. However, the share price did not fall below the level just before the result announcement and is currently in the 1,500 yen range.
| JPY, mn, % | Net sales | YoY % |
Oper. profit |
YoY % |
Ord. profit |
YoY % |
Profit ATOP |
YoY % |
EPS (¥) |
DPS (¥) |
| 2020/12 | 116,210 | -4.9 | 1,798 | 99.1 | 1,881 | 99.0 | -235 | – | -5.18 | 13.00 |
| 2021/12 | 115,839 | -0.3 | 2,536 | 41.0 | 2,437 | 29.5 | 1,166 | – | 25.82 | 15.00 |
| 2022/12 | 123,324 | 6.4 | 4,582 | 79.0 | 4,177 | 71.4 | 5,294 | 353.9 | 116.99 | 37.00 |
| 2023/12 | 132,985 | 7.8 | 8,523 | 86.0 | 8,555 | 104.8 | 5,905 | 11.5 | 130.29 | 42.00 |
| 2024/12 (CE) | 137,500 | 3.4 | 10,000 | 17.3 | 10,000 | 16.9 | 7,000 | 18.5 | 144.12 | 52.00 |
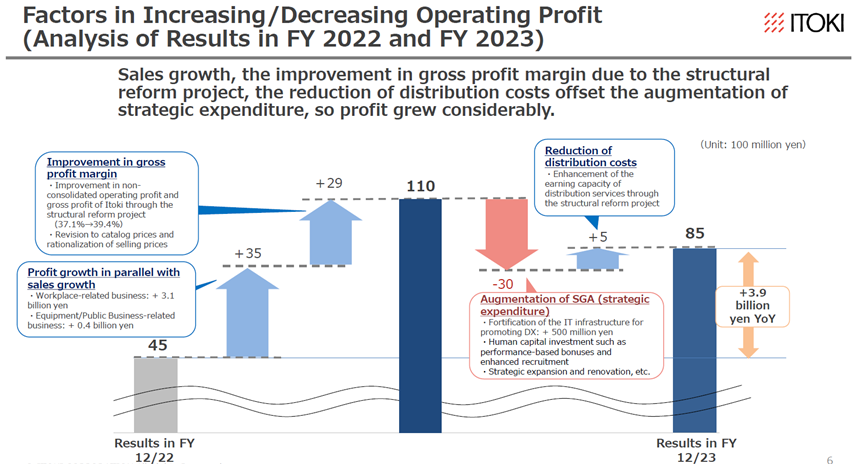
◇ Summary of FY12/2023 4Q Financial Results: Establishment of a profitable structure. Highest profit and dividend increase.
In FY12/2023, Itoki posted sales of 132.9 billion yen (+8% YoY) and an operating profit of 8.5 billion yen (+86% YoY), with sales, operating profit, recurring profit, and net income all hitting record highs.
While steadily building up sales from renewal projects and office relocations, the company significantly improved its profit margin through enhanced customer value. As a result, profits exceeded the company’s forecasts despite increased SG&A expenses due to strategic spending.
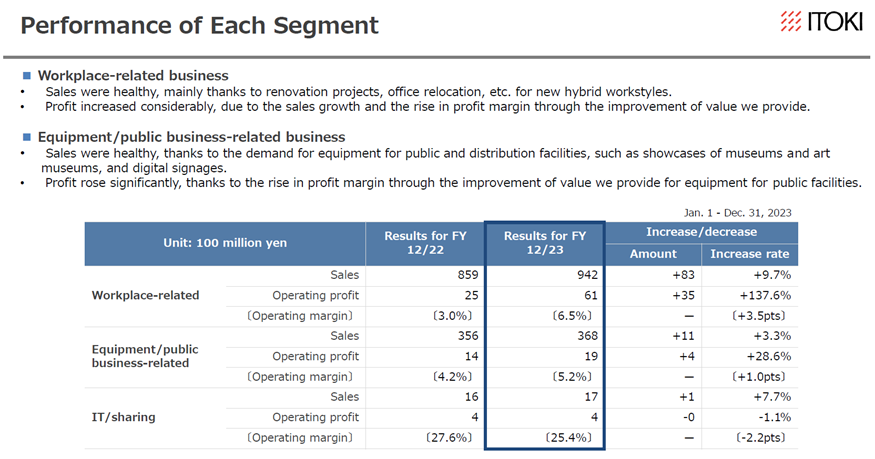
By segment, the Workplace-related business and the Equipment / Public business-related business each posted increased revenue and operating profit, and operating profit margins improved. The results were flawless.
In addition, the company increased its year-end dividend by 5 yen YoY to 42 yen for FY12/2023, reflecting its strong earnings.
As indicated by the strong performance of the peers in the industry, the industry environment is favorable, benefiting from the tailwind. In particular, the company’s operating profit margin has quickly risen to the 6% range, a level not seen in the past ten years. The company should be commended for its progress in strengthening its structure under President Minato’s leadership. It can be said that the company has completed the “To develop an earning structure” in the final year of its mid-term plan.
Source: Omega Investment from company materials
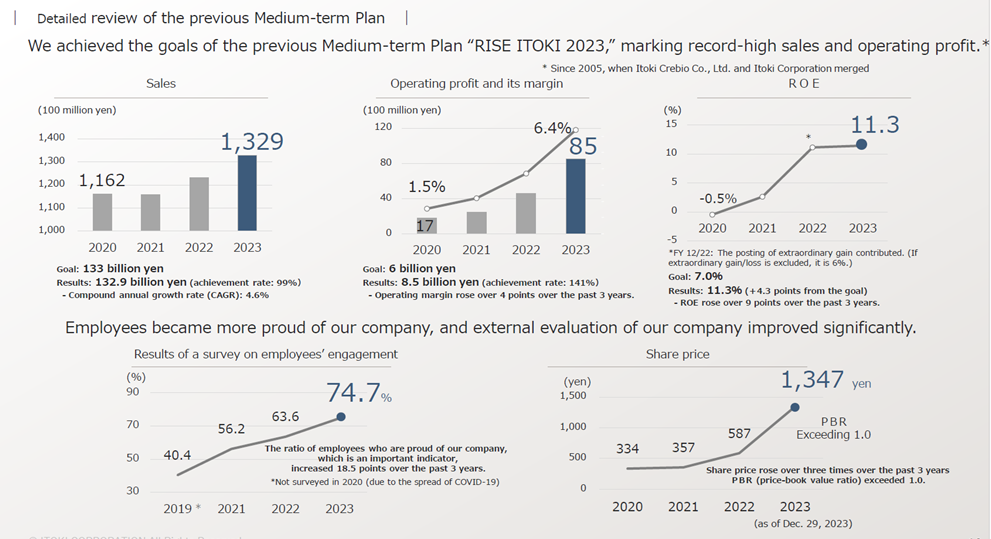
◇ The previous medium-term management plan was achieved:
In FY12/2023, the company delivered results on target vis-a-vis the previous medium-term plan, with sales largely in line with expectations and operating profit, operating profit margin, and ROE exceeding targets (see graphs below). The company’s internal factors, mainly at the parent company, such as a shift from equality to fairness in personnel evaluations to empower employees, a thorough focus on profitability, and enhanced proposal capabilities for office design, etc., are thought to have had a multilayered effect.
Two points are particularly noteworthy in these results. The first is that employees are more proud of the company than before, which is a positive result of employee engagement, and the second is that ROE has improved to 11.3%, which has led to an increase in the share price and a PBR over 1x.
The company’s “To develop an earning structure” has not only improved financial figures but has also been positively received by employees, and this overall strengthening of the company’s structure is likely to have improved investors’ evaluation of the company.
Source: Omega Investment from company materials
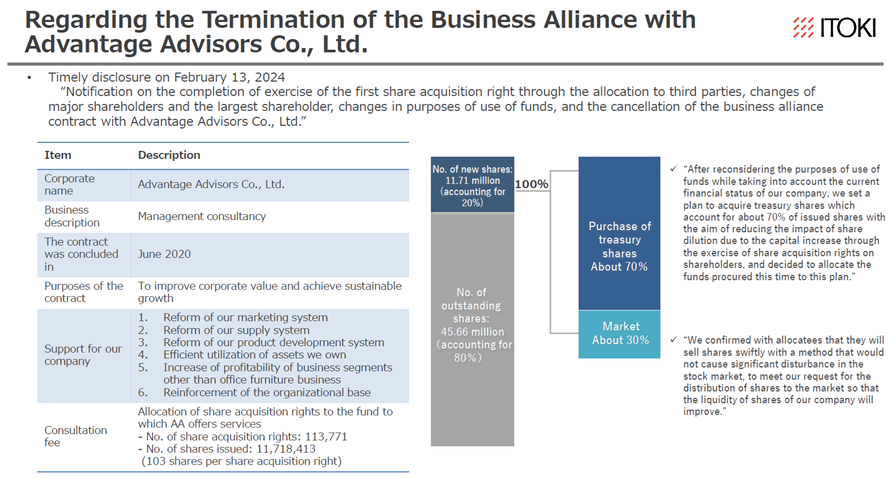
◇ End of business alliance with Advantage Advisors Co.,Ltd.:
According to the company’s timely disclosure on February 13, 20, and 21, 2024, the stock acquisition rights issued to Advantage Advisors (AA, after this) were exercised in full on these dates, resulting in the issuance of 11.7 million shares of common stock, and 4.07 billion yen was paid to the company as compensation for this issuance. On February 21, the company repurchased 7.965 million shares for 15.9 billion yen. According to the February 28 large volume shareholding report, AA completed the sale of all of the company’s shares acquired in the transaction.
The key points are as follows. This is a minor concern from a medium- to long-term perspective.
– Increase in the number of shares outstanding: The number of shares outstanding at the end of December 2023 was 45.3 million after deducting treasury stock, and after this series of transactions, the number of shares outstanding after deducting treasury stock will be 49.1 million. This represents an increase of approximately 8% in the number of shares, which is a reasonable level of dilution. Considering future earnings growth and an increase in the dividend payout ratio, this increase should be acceptable to many shareholders.
– Financial burden: Although the company spent approximately 12 billion yen, it has a net cash position of approximately 8 billion yen as of December 2023. Given the company’s remarkable improvement in profitability, there should be no problems in terms of debt financing, including borrowings and interest rates.
– Disposal of treasury stock: About half of the 4 million shares acquired this time were cancelled (March 8, 2024).
– What happened to the company’s shares held by a company associated with Advantage Advisors after the transactions?: Itoki has confirmed that the AA-associated company intends to sell the approximately 3.8 million shares it holds after the transactions in a manner that will not cause significant disruption to the stock market. While this will be a negative factor in stock supply and demand until the sale is completed, the resulting diversification of shareholder composition and increased liquidity of shares is expected to be favorable from a medium- to long-term perspective.
– Impact of the termination of the business alliance: Based on the company’s financial results and the message from management, it appears that the company has implanted in itself the ability to build a profitable structure, so the direct negative impact of the termination of the business alliance is expected to be small.
Source: Omega Investment from company materials
◇ New medium-term management plan RISE To GROWTH 2026: Moving into “Profitability enhancement phase”
The new medium-term management plan “RISE TO GROWTH 2006” for 2024-2026 has been announced. It is set as a “Profitability enhancement phase” to enhance sustainable growth.
The nature of the workplace, including the office, and its productivity improvements are attracting increasing attention, and the thinking of management at client companies is shifting from a one-dimensional view of the office as a cost to a view of the office as an object of human capital investment that pursues investment effects. Furthermore, office DX and IoT of office equipment are expected to advance.
Itoki’s mission is “To design tomorrow’s “workstyles”.” The company is keen to tie this shift in workplace needs to its long-term growth.
This medium-term management plan is based on the “Tech x Design based on PEOPLE” concept and consists of the vital strategy “7 Flags” and ESG strategies.
The company’s financial targets for FY2026 are sales of 150 billion yen (up 13% from FY12/2023), operating profit of 14 billion yen (up 64%), operating profit margin of 9% (up 3 percentage points), and ROE of 15% (up 4 percentage points). These are more focused on improving profitability than increasing revenue and show the company’s ambition to become an industry leader in terms of profitability by 2026.
The company’s message to the stock market is to maximize shareholder value and improve PBR by reducing the cost of capital while aiming to achieve ROE in excess of the assumed 9-10% cost of equity capital. Regarding shareholder returns, the company will raise its dividend payout ratio by 10 percentage points to 40%. This is more than sufficient to meet the current expectations of the stock market.
The details of the plan will be discussed later in this report. Still, it can be said that it is a broadly well-developed plan that includes strengthening the core business base, seeding new office-related businesses, developing specialized facility areas, strengthening the earnings structure on a consolidated basis, human capital, and financial strategies.
From the plan’s first year, investors are likely to pay close attention to the rate of progress toward financial targets.
Source: Omega Investment from company materials
The following is a summary of these seven priority measures and their KPIs.
| 2024-2026 Medium-term management plan | |||
| Flag 1 | Office 1.0/2.0 area | To strengthen value-added proposals for new work styles and office spaces that implement such work styles to secure a base of sales and profits. | |
| Measure 1 | Appealing to the value of the experience through strengthening product capabilities 《Office1.0》 | ||
| Measure 2 | Value-added proposals for integrated spaces 《Office 2.0》 | ||
| KPI | FY2026 sales growth of +10% over FY2023.Operating profit margin of 10%. | ||
| Flag 2 | Office3.0 area | Develop data-driven services that provide optimal work styles and office spaces through IoT and spatial sensing of office furniture. | |
| Measure 1 | Development of new data services 《Office 3.0》 | *1 | |
| Measure 2 | Collaboration and capital alliance with AI companies | ||
| KPI | FY2026 single-year sales: 3 billion yen3-year cumulative investment: 2.5 billion yen (excluding personnel expenses) | ||
| Flag 3 | Specialized Facility Area | Focus resources on development and engineering in the logistics facilities and research facilities domains and develop them into the second pillar of the company’s business. | |
| Measure 1 | Expansion of specialized facility areas | *2 | |
| Measure 2 | Establish maintenance business | ||
| KPI | Specialty facility domain sales 30 billion yen (+40% over FY2023)Operating profit 2 billion yen (+40% over FY2023)FY2026 strengthening development and engineering structure through increasing people by more than 50 | ||
| Flag 4 | High Profitability | Increase production and operational efficiency by reorganizing the Group’s production and supply system and revamping the internal IT infrastructure | |
| Measure 1 | Supply Chain Optimization | ||
| Measure 2 | “Standardization, simplification, and automation” of operations | ||
| KPI | FY2026 manufacturing cost + distribution cost (consolidated): 5% reduction from FY2023FY2026 increase in operating profit per employee: +50% from FY2023Cumulative internal IT-related investment over three years (DX): 8 billion yen | ||
| Flag 5 | Group Synergy | Pursue group synergies by horizontally deploying successful experiences from the structural reform project implemented by Itoki on a stand-alone basis to group companies | |
| Measure 1 | Horizontal deployment of structural reform methods to group companies | ||
| Measure 2 | Promote functional collaboration among group companies | ||
| KPI | FY2026 consolidated group companies (simple sum of consolidated group companies excluding Itoki): 2% improvement in operating profit margin from FY2023FY2026 reduction of 3 billion yen in cash outflow outside the group | ||
| Flag 6 | Human Capital | Enlighten each employee’s independent and active “creativity and ingenuity” centered on personnel system reform | |
| Measure | Transformation of HR System: Professional X Retention X Pay for Performance | ||
| KPI | FY2026 Employee Engagement Survey Results Percentage of affirmative responses to the key indicator “pride” 85%The ratio of female managers: 13% in FY2026 | ||
| Flag 7 | Financial Strategy | Systematically implement growth strategy investment, employee return, and shareholder return from a medium- to long-term perspective | |
| Generate 65-75 billion yen in total from basic CF and other distributable funds over 3 years, to be distributed as follows: 25 billion yen for strategic investment, 5 billion yen for R&D, 10 billion yen for capital investment, 10 billion yen for human capital investment, and 20 billion yen for shareholder return | *3 | ||
| Actions to achieve cost of capital and stock price conscious management | *4 | ||
| E | Environment | Contribute to the realization of a society with zero negative impact on ecosystems | |
| S | Society | Contribute to maximizing society’s human capital through our own business | |
| G | Governance | Establish group-wide governance from a consolidated perspective | |
| Supplementary Information |
*1 | On February 14, 2024, the company launched “Data Trekking,” a consulting service that supports agile office construction and its operation in an accompanying manner, using sensing data in the office as a guidepost. The service is expected to increase added value and recurring revenues by selling the products. | |
| *2 | Expanding the variety of SAS (shuttle-type multi-story automated warehouse system) for logistics, expanding market share by introducing new airflow control products for research facilities, and establishing a business in growth areas for drug discovery/medical and semiconductor manufacturing. | ||
| *3 *4 | See next figure | ||
Source: Omega Investment from company materials
Supplementary Information*3: Allocate the results of improved profitability to reinvestment in line with the medium- to long-term strategy and strengthen shareholder returns.
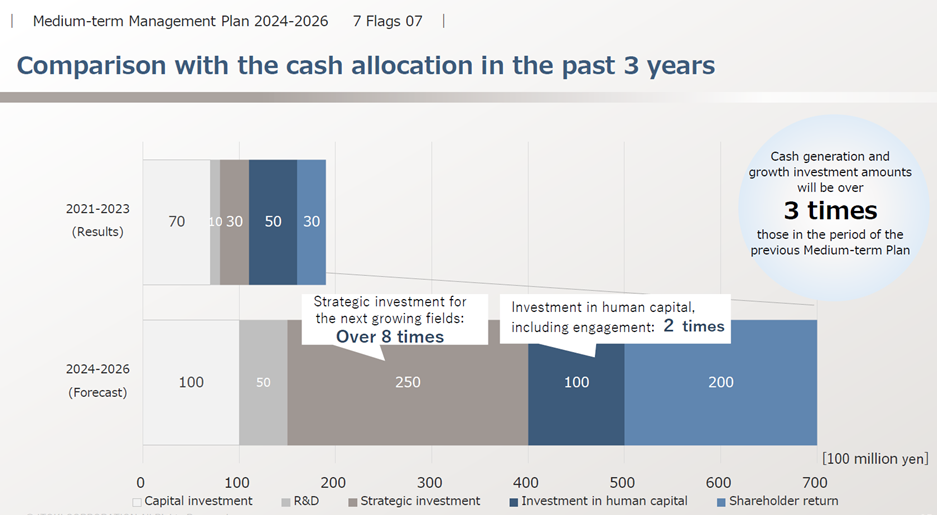
Source: Omega Investment from company materials
Supplementary Information*4: Achieve ROE that exceeds the cost of shareholders’ equity and promote higher PBR through expansion of equity spread.
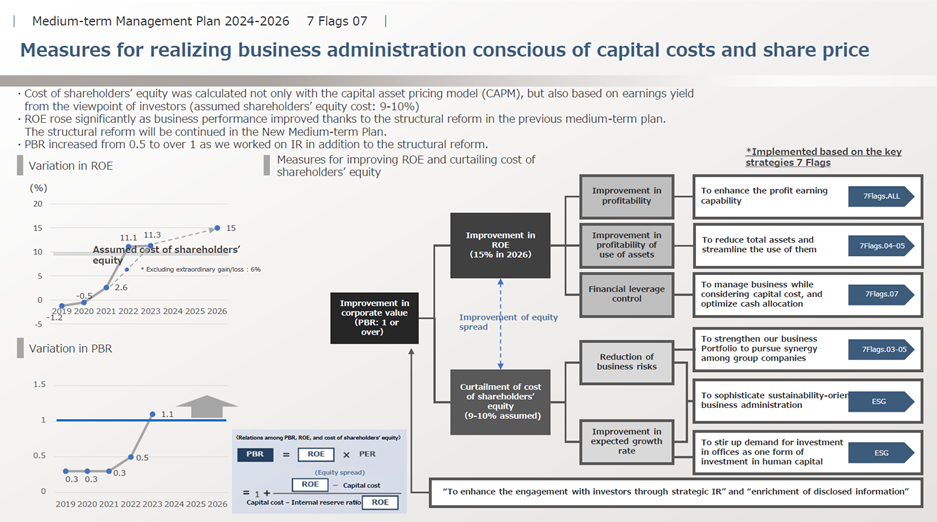
Source: Omega Investment from company materials
◇ FY12/2024 company forecast: Continued sales and operating profit increase, and operating profit margin to rise further.
The company projects sales of 137.5 billion yen (+3% YoY), operating profit of 10 billion yen (+17% YoY), recurring profit of 10 billion yen (+17% YoY), and net income of 7 billion yen (+19% YoY), which would be an increase in sales and a further improvement in the operating profit margin.
The sales forecast is in line with the current growth rate of business negotiations in force. Meanwhile, the company’s operating profit, excluding strategic SG&A expenses, was 11 billion yen in FY12/2023, which means it is already within range of its 10 billion yen operating profit forecast.
Source: Omega Investment from company materials
◇ Share Price Trend and Highlights: The share price surged after the earnings announcement, exceeding the high of 2006.
The company’s share price rose to a high of 1,587 yen until the beginning of autumn 2023, after which it entered an adjustment phase, temporarily hitting 1,189 yen in December 2023. However, it recovered to the 1,500-yen level, and the company’s FY12/2023 financial results were announced.
The stock price positively reacted to the earnings results, the medium-term management plan, and the company’s response to the exercise of share options by repurchasing its shares. It soared to 2,200 yen but has since entered an adjustment phase.
However, the share price did not fall below the level before the result announcement, and PBR is meaningfully above 1x, suggesting investors have high expectations for the company’s transformation and earnings growth.
For now, we would like to focus on the following points.
– Progress in Q1, when seasonal factors tend to generate profits
– News flow of the 7 Flags program as outlined in the new medium-term management plan
– Progress in the sale of AA’s stake in the company

Source: Omega Investment
Financial data (quarterly basis)
| FY (¥mn) | 2020/12 | 2021/12 | 2022/12 | 2023/12 | ||||||||||||
| 1Q | 2Q | 3Q | 4Q | 1Q | 2Q | 3Q | 4Q | 1Q | 2Q | 3Q | 4Q | 1Q | 2Q | 3Q | 4Q | |
| [Statements of income] | ||||||||||||||||
| Net sales | 37,707 | 26,997 | 21,489 | 30,017 | 32,167 | 29,468 | 22,412 | 31,858 | 35,345 | 28,411 | 26,205 | 33,363 | 36,965 | 31,225 | 28,667 | 36,128 |
| Year-on-year basis (%) | 11.2 | -9.3 | -24.5 | -0.1 | -14.7 | 9.2 | 4.3 | 6.1 | 9.9 | -3.6 | 16.9 | 4.7 | 4.6 | 9.9 | 9.4 | 8.3 |
| Cost of sales | 23,710 | 17,765 | 13,811 | 19,036 | 20,101 | 18,729 | 14,443 | 20,872 | 21,483 | 18,030 | 16,678 | 21,384 | 22,216 | 18,954 | 17,483 | 22,091 |
| Gross profit | 13,997 | 9,232 | 7,678 | 10,981 | 12,020 | 10,722 | 7,953 | 10,999 | 13,862 | 10,381 | 9,527 | 11,979 | 14,748 | 12,271 | 11,184 | 14,037 |
| SG&A expenses | 10,996 | 9,602 | 9,590 | 9,901 | 10,352 | 9,453 | 9,203 | 10,150 | 9,898 | 9,973 | 9,812 | 11,484 | 9,970 | 10,047 | 11,006 | 12,694 |
| Operating income | 3,001 | -370 | -1,912 | 1,079 | 1,698 | 1,275 | -1,242 | 829 | 3,964 | 407 | -285 | 496 | 4,777 | 2,225 | 177 | 1,344 |
| Year-on-year basis (%) | 43.5 | – | – | – | -43.4 | – | – | -23.2 | 133.4 | -68.7 | – | -40.2 | 20.5 | 446.7 | – | 171.0 |
| Operating profit ratio (%) | 8.0 | -1.4 | -8.9 | 3.6 | 5.3 | 4.3 | -5.5 | 2.6 | 11.2 | 1.4 | -1.1 | 1.5 | 12.9 | 7.1 | 0.8 | 3.7 |
| Non-operating income | 154 | 162 | 251 | 237 | 240 | 161 | 171 | 122 | 125 | 164 | 171 | 96 | 125 | 114 | 141 | 101 |
| Non-operating expenses | 273 | 168 | 107 | 172 | 250 | 257 | 101 | 185 | 115 | 130 | 177 | 539 | 79 | 68 | 52 | 249 |
| Ordinary income | 2,882 | -376 | -1,768 | 1,143 | 1,657 | 1,173 | -1,179 | 786 | 3,974 | 442 | -291 | 52 | 4,824 | 2,271 | 265 | 1,195 |
| Extraordinary income | 0 | 6 | 125 | 980 | 1,255 | 78 | 133 | 88 | 786 | 139 | 118 | 6,762 | 1 | 15 | 120 | 50 |
| Extraordinary expenses | 116 | 42 | 55 | 1,503 | 20 | 456 | 518 | 1,474 | 44 | 64 | 38 | 3,465 | 21 | 10 | 24 | 308 |
| Income before income taxes | 2,766 | -412 | -1,697 | 620 | 2,893 | 795 | -1,565 | -600 | 4,716 | 516 | -211 | 3,351 | 4,804 | 2,275 | 363 | 936 |
| Total income taxes | 1,039 | 134 | -195 | 654 | 1,028 | 490 | -132 | -796 | 1,381 | 246 | -21 | 1,585 | 1,506 | 864 | 161 | -60 |
| Net income | 1,760 | -557 | -1,491 | 53 | 1,942 | 348 | -1,440 | 316 | 3,388 | 288 | -159 | 1,777 | 3,296 | 1,411 | 202 | 996 |
| Year-on-year basis (%) | 43.6 | – | – | – | 10 | – | – | 496.2 | 74.4 | -17.2 | – | 462.3 | -2.7 | 389.9 | – | -44.0 |
| Net income ratio (%) | 4.7 | -2.1 | -6.9 | 0.2 | 6.0 | 1.2 | -6.4 | 1.0 | 9.6 | 1.0 | -0.6 | 5.3 | 8.9 | 4.5 | 0.7 | 2.8 |
| [Balance Sheets] | ||||||||||||||||
| Current assets | 69,811 | 60,382 | 52,463 | 57,183 | 65,543 | 62,170 | 55,249 | 57,753 | 69,458 | 64,096 | 59,873 | 71,027 | 72,230 | 68,755 | 68,040 | 73,304 |
| Cash and deposits | 18,186 | 21,312 | 18,956 | 18,246 | 19,503 | 22,112 | 18,213 | 17,351 | 19,196 | 20,073 | 17,138 | 26,876 | 20,898 | 24,688 | 23,192 | 24,795 |
| Notes and accounts receivable – trade | 37,611 | 27,230 | 20,298 | 26,599 | 32,061 | 26,596 | 21,385 | 26,783 | – | – | – | – | – | – | – | |
| Notes and accounts receivable – trade, and contract assets | – | – | – | – | – | – | – | – | 35,205 | 28,234 | 24,111 | 29,316 | 34,519 | 28,377 | 26,948 | 31,158 |
| Non-current assets | 49,872 | 49,933 | 50,410 | 47,912 | 46,925 | 46,369 | 46,046 | 46,144 | 46,647 | 47,395 | 48,126 | 44,260 | 43,611 | 42,918 | 43,533 | 44,132 |
| Property, plant and equipment | 27,612 | 27,350 | 27,329 | 26,206 | 25,184 | 24,779 | 24,887 | 24,417 | 25,105 | 26,042 | 26,932 | 24,978 | 24,689 | 24,952 | 24,730 | 24,792 |
| Intangible assets | 5,113 | 5,623 | 5,853 | 5,590 | 5,504 | 5,419 | 4,885 | 4,114 | 4,128 | 4,168 | 4,145 | 1,819 | 1,837 | 1,884 | 2,161 | 2,292 |
| Goodwill | 2,391 | 2,207 | 2,189 | 2,093 | 2,018 | 2,016 | 1,407 | 1,317 | 1,214 | 1,222 | 1,200 | 517 | 446 | 391 | 346 | 341 |
| Investments and other assets | 17,146 | 16,959 | 17,227 | 16,116 | 16,236 | 16,170 | 16,273 | 17,612 | 17,413 | 17,184 | 17,048 | 17,462 | 17,084 | 16,080 | 16,641 | 17,048 |
| Total assets | 120,352 | 110,940 | 103,453 | 105,096 | 112,469 | 108,540 | 101,295 | 103,898 | 116,105 | 111,492 | 108,000 | 115,288 | 115,841 | 111,693 | 111,573 | 117,437 |
| Current liabilities | 55,449 | 46,097 | 40,198 | 43,646 | 49,245 | 45,266 | 40,307 | 42,544 | 51,837 | 47,138 | 43,655 | 49,099 | 47,854 | 42,547 | 42,010 | 47,340 |
| Short-term borrowings | 15,616 | 13,289 | 14,239 | 13,234 | 13,458 | 12,061 | 12,409 | 12,500 | 15,014 | 11,976 | 11,738 | 11,239 | 10,874 | 10,299 | 10,383 | 10,276 |
| Non-current liabilities | 18,327 | 18,220 | 18,079 | 17,259 | 17,506 | 17,088 | 16,257 | 16,277 | 16,334 | 16,020 | 16,178 | 16,278 | 16,238 | 15,727 | 15,724 | 15,096 |
| Long-term borrowings | 9,475 | 9,574 | 9,453 | 8,508 | 8,711 | 8,193 | 7,435 | 7,591 | 7,427 | 7,174 | 7,266 | 7,530 | 7,453 | 7,062 | 6,959 | 6,577 |
| Total liabilities | 73,777 | 64,318 | 58,277 | 60,906 | 66,751 | 62,354 | 56,565 | 58,822 | 68,172 | 63,158 | 59,833 | 65,377 | 64,092 | 58,275 | 57,734 | 62,437 |
| Total net assets | 46,575 | 46,621 | 45,175 | 44,189 | 45,717 | 46,186 | 44,730 | 45,076 | 47,933 | 48,333 | 48,166 | 49,910 | 51,748 | 53,418 | 53,839 | 54,999 |
| Shareholders’ equity | 45,479 | 45,390 | 43,786 | 43,691 | 45,047 | 45,419 | 43,979 | 44,301 | 47,249 | 47,567 | 47,408 | 49,185 | 50,806 | 52,267 | 52,469 | 54,960 |
| Share capital | 5,294 | 5,294 | 5,294 | 5,294 | 5,294 | 5,294 | 5,294 | 5,294 | 5,294 | 5,294 | 5,294 | 5,294 | 5,294 | 5,294 | 5,294 | 5,294 |
| Capital surplus | 9,201 | 9,642 | 9,641 | 9,628 | 9,628 | 9,632 | 9,632 | 9,638 | 9,638 | 9,638 | 9,638 | 9,638 | 9,638 | 9,665 | 9,665 | 9,665 |
| Retained earnings | 31,030 | 30,461 | 28,884 | 28,950 | 30,306 | 30,654 | 29,213 | 29,530 | 32,477 | 32,769 | 32,610 | 34,387 | 36,008 | 37,419 | 37,621 | 38,617 |
| Treasury shares | -46 | -6 | -33 | -182 | -182 | -161 | -161 | -161 | -161 | -134 | -134 | -134 | -314 | -111 | -111 | -111 |
| Share acquisition rights | 45 | 45 | 45 | 45 | 45 | 45 | 45 | 45 | 45 | 45 | 45 | 45 | 45 | 45 | ||
| Total liabilities and net assets | 120,352 | 110,940 | 103,453 | 105,096 | 112,469 | 108,540 | 101,295 | 103,898 | 116,105 | 111,492 | 108,000 | 115,288 | 115,841 | 111,693 | 111,573 | 117,437 |
| [Statements of cash flows] | ||||||||||||||||
| Cash flow from operating activities | 5,404 | -843 | 4,577 | -1,803 | 4,581 | 1,223 | 4,078 | 2,243 | ||||||||
| Cash flow from investing activities | -1,442 | 290 | 503 | -1,673 | -1,410 | 6,333 | -3,265 | -747 | ||||||||
| Cash flow from financing activities | 293 | -2,560 | -1,418 | -1,240 | -661 | -765 | -3,266 | -882 | ||||||||
| Free cash flow | 3,962 | -553 | 5,080 | -3,476 | 3,171 | 7,556 | 813 | 1,496 | ||||||||
| Net increase in cash and cash equiv. | 4,240 | -3,037 | 3,787 | -4,687 | 2,630 | 6,911 | -2,466 | 711 | ||||||||
| Cash and cash equiv. at beginning of period | 15,494 | 19,735 | 16,697 | 20,485 | 15,797 | 18,509 | 25,420 | 22,953 | ||||||||
| Cash and cash equiv. at end of period | 19,735 | 16,697 | 20,485 | 15,797 | 18,509 | 25,420 | 22,953 | 23,664 | ||||||||
Financial data (full-year basis)
| FY (¥mn) | 2013/12 | 2014/12 | 2015/12 | 2016/12 | 2017/12 | 2018/12 | 2019/12 | 2020/12 | 2021/12 | 2022/12 | 2023/12 |
| [Statements of income] | |||||||||||
| Net sales | 103,461 | 102,993 | 106,516 | 101,684 | 108,684 | 118,700 | 122,174 | 116,210 | 115,839 | 123,324 | 132,985 |
| Year-on-year basis (%) | -1.9 | -0.5 | 3.4 | -4.5 | 6.9 | 9.2 | 2.9 | -4.9 | -0.3 | 6.4 | 7.8 |
| Cost of sales | 67,118 | 66,797 | 68,374 | 65,021 | 69,966 | 77,436 | 80,495 | 74,322 | 74,145 | 77,575 | 80,744 |
| Gross profit | 36,343 | 36,196 | 38,142 | 36,663 | 38,718 | 41,264 | 41,679 | 41,888 | 41,694 | 45,749 | 52,240 |
| Gross profit ratio (%) | 35.1 | 35.1 | 35.8 | 36.1 | 35.6 | 34.8 | 34.1 | 36.0 | 36.0 | 37.1 | 39.3 |
| SG&A expenses | 32,203 | 33,723 | 33,836 | 33,862 | 35,761 | 39,339 | 40,776 | 40,089 | 39,158 | 41,167 | 43,717 |
| Operating income | 4,140 | 2,472 | 4,306 | 2,800 | 2,956 | 1,925 | 903 | 1,798 | 2,536 | 4,582 | 8,523 |
| Operating profit ratio (%) | 4.0 | 2.4 | 4.0 | 2.8 | 2.7 | 1.6 | 0.7 | 1.5 | 2.2 | 3.7 | 6.4 |
| Non-operating income | 813 | 841 | 898 | 771 | 750 | 889 | 677 | 804 | 694 | 556 | 481 |
| Non-operating expenses | 528 | 495 | 605 | 483 | 412 | 448 | 634 | 720 | 793 | 961 | 448 |
| Ordinary income | 4,425 | 2,818 | 4,599 | 3,087 | 3,295 | 2,365 | 945 | 1,881 | 2,437 | 4,177 | 8,555 |
| Extraordinary income | 685 | 615 | 171 | 97 | 228 | 919 | 27 | 1,111 | 1,554 | 7,805 | 186 |
| Extraordinary expenses | 238 | 262 | 524 | 267 | 121 | 204 | 35 | 1,716 | 2,468 | 3,611 | 363 |
| Income before income taxes | 4,872 | 3,171 | 4,246 | 2,918 | 3,401 | 3,081 | 938 | 1,277 | 1,523 | 8,372 | 8,378 |
| Total income taxes | 876 | 813 | -385 | 1,068 | 959 | 1,339 | 1,517 | 1,632 | 590 | 3,191 | 2,471 |
| Net income | 3,910 | 2,160 | 4,530 | 1,907 | 2,402 | 1,722 | -550 | -235 | 1,166 | 5,294 | 5,905 |
| Net income ratio (%) | 3.8 | 2.1 | 4.3 | 1.9 | 2.2 | 1.5 | -0.5 | -0.2 | 1.0 | 4.3 | 4.4 |
| [Balance Sheets] | |||||||||||
| Current assets | 52,925 | 55,714 | 56,342 | 52,410 | 58,147 | 62,143 | 58,109 | 57,183 | 57,753 | 71,027 | 73,304 |
| Cash and deposits | 19,553 | 21,211 | 21,456 | 19,839 | 19,977 | 16,229 | 17,030 | 18,246 | 17,351 | 26,876 | 24,795 |
| Notes and accounts receivable – trade | 26,243 | 25,965 | 26,138 | 23,241 | 26,869 | 33,160 | 28,244 | 26,599 | 26,783 | ||
| Notes and accounts receivable – trade, and contract assets | 29,316 | 31,158 | |||||||||
| Non-current assets | 42,335 | 41,007 | 41,832 | 43,271 | 44,073 | 46,559 | 49,955 | 47,912 | 46,144 | 44,260 | 44,132 |
| Property, plant and equipment | 28,193 | 27,041 | 26,395 | 25,322 | 24,426 | 26,362 | 27,781 | 26,206 | 24,417 | 24,978 | 24,792 |
| Intangible assets | 1,230 | 1,109 | 1,313 | 1,142 | 3,651 | 4,437 | 4,945 | 5,590 | 4,114 | 1,819 | 2,292 |
| Goodwill | 34 | 26 | 240 | 208 | 2,793 | 3,005 | 2,413 | 2,093 | 1,317 | 517 | 341 |
| Investments and other assets | 12,911 | 12,857 | 14,123 | 16,806 | 15,995 | 15,760 | 17,229 | 16,116 | 17,612 | 17,462 | 17,048 |
| Total assets | 95,261 | 96,721 | 98,175 | 95,681 | 102,221 | 108,703 | 108,778 | 105,096 | 103,898 | 115,288 | 117,437 |
| Current liabilities | 35,359 | 36,677 | 36,106 | 35,390 | 39,683 | 45,133 | 47,559 | 43,646 | 42,544 | 49,099 | 47,340 |
| Short-term borrowings | 11,473 | 11,087 | 10,940 | 11,760 | 12,564 | 11,721 | 15,533 | 13,234 | 12,500 | 11,239 | 10,276 |
| Non-current liabilities | 16,874 | 16,854 | 14,756 | 14,888 | 15,211 | 16,076 | 15,385 | 17,259 | 16,277 | 16,278 | 15,096 |
| Long-term borrowings | 5,124 | 5,089 | 5,171 | 5,296 | 5,328 | 5,113 | 6,633 | 8,508 | 7,591 | 7,530 | 6,577 |
| Total liabilities | 52,234 | 53,532 | 50,863 | 50,278 | 54,894 | 61,210 | 62,944 | 60,906 | 58,822 | 65,377 | 62,437 |
| Total net assets | 43,026 | 43,189 | 47,311 | 45,402 | 47,326 | 47,492 | 45,834 | 44,189 | 45,076 | 49,910 | 54,999 |
| Shareholders’ equity | 41,079 | 41,632 | 45,677 | 44,949 | 46,863 | 46,854 | 45,370 | 43,812 | 44,931 | 49,871 | 54,960 |
| Share capital | 5,277 | 5,277 | 5,277 | 5,277 | 5,277 | 5,277 | 5,294 | 5,294 | 5,294 | 5,294 | 5,294 |
| Capital surplus | 13,061 | 13,061 | 13,222 | 13,140 | 12,404 | 9,786 | 9,201 | 9,628 | 9,638 | 9,638 | 9,665 |
| Retained earnings | 22,073 | 23,556 | 29,223 | 30,504 | 32,315 | 31,104 | 29,862 | 28,950 | 29,530 | 34,387 | 38,617 |
| Treasury shares | -833 | -834 | -3,000 | -4,700 | -4,701 | 0 | -46 | -182 | -161 | -134 | -111 |
| Share acquisition rights | 45 | 45 | 45 | 45 | |||||||
| Total liabilities and net assets | 95,261 | 96,721 | 98,175 | 95,681 | 102,221 | 108,703 | 108,778 | 105,096 | 103,898 | 115,288 | 117,437 |
| [Statements of cash flows] | |||||||||||
| Cash flow from operating activities | 3,162 | 5,715 | 4,522 | 5,072 | 3,565 | 1,384 | 3,586 | 4,561 | 2,774 | 5,804 | 6,321 |
| Cash flow from investing activities | -1,978 | -1,742 | -803 | -4,044 | -2,971 | -3,094 | -3,221 | -1,152 | -1,170 | 4,923 | -4,012 |
| Cash flow from financing activities | 51 | -2,179 | -3,807 | -2,571 | -706 | -2,463 | 0 | -2,267 | -2,658 | -1,426 | -4,148 |
| Free cash flow | 1,184 | 3,973 | 3,719 | 1,028 | 594 | -1,710 | 365 | 3,409 | 1,604 | 10,727 | 2,309 |
| Net increase in cash and cash equiv. | 1,944 | 1,814 | 184 | -1,619 | 88 | -4,031 | 952 | 1,203 | -900 | 9,622 | -1,755 |
| Cash and cash equiv. at beginning of period | 16,156 | 18,102 | 19,918 | 20,103 | 18,483 | 18,571 | 14,540 | 15,494 | 16,697 | 15,797 | 25,420 |
| Cash and cash equiv. at end of period | 18,102 | 19,918 | 20,103 | 18,483 | 18,571 | 14,540 | 15,494 | 16,697 | 15,797 | 25,420 | 23,664 |
Source: Omega Investment from company materials