2026-07-27
Home
Japanese

Omega Investment Co., Ltd.
TENPO INNOVATION (3Q Follow up)

Announced transition to a holdings company
Recent share price pullback appears to fully discount ST dip in margins
| Click here for the PDF version of this page |
| PDF Version |
SUMMARY
- Transition to a Holdings Company Structure. By transitioning to a holding company structure, the holding company will oversee the management of the entire Group, while each subsidiary will focus on promoting its own business, thereby maximizing the corporate value of the Group. The business to be divested will be transferred to a wholly owned subsidiary (split preparation company) through a company split (absorption-type split) with the Company as the splitting company, and the split preparation company as the successor company. In addition, the Company will continue to be listed as a holding company.
- 3Q results and current valuations: The -29.6% decline in 9M cumulative OP (store subleasing -15.6%, real estate trading -69.5%) is attributed to GPM declining on the increase in costs (vacancy rents, construction, commissions, etc.) associated with aggressive sublease property purchases as well as a higher SG&A ratio from increased salary and recruiting expenses, etc., but in large part due to lack of property sales in the 3Q due to timing, expected to rebound in the 4Q. The share price appears to have fully discounted the short-term pressure on margins, and the P/E, EV/EBITDA and DY yield are trading on 18% and 19% discounts, and 33% premium to respective averages.
TENPOINNOVATION: Sustainable double-digit growth with high stability
Source: compiled by Omega Investment from IR results briefing materials.
Financial Indicators
| Share price (3/19) | 962 | 24.3 P/E (CE) | 19.0x |
| YH (23/3/10) | 1,340 | 24.3 EV/EBITDA (CE) | 9.8x |
| YL (24/3/07) | 900 | 23.3 ROE (act) | 27.7% |
| 10YH (23/3/10) | 1,340 | 23.3 ROIC (act) | 25.9% |
| 10YL (20/4/6) | 477 | 23.12 P/B (act) | 4.98x |
| Shrs out. (mn shrs) | 17.674 | 24.3 DY (CE) | 2.07% |
| Mkt cap (¥ bn) | 16.631 | | |
| EV (¥ bn) | 12.957 | | |
| Equity ratio (12/31) | 24.0% | | |
TENPO INNOVATION subleased store properties are uncorrelated with the market
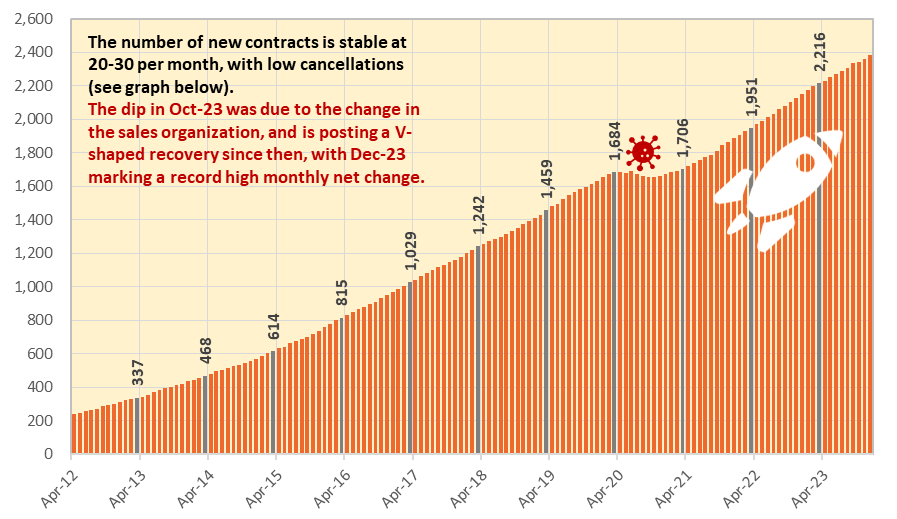
According to the JF Food Service Industry Market YoY Trend Survey for December 2023, total stores declined -0.7% YoY, and relative to December 2019, declined -7.2%, yet to post a meaningful recovery. Well, what about the trend for the Company? For the same period, subleased restaurant store properties for TENPO INNOVATION increased 10.7% YoY, and relative to December 2019, increased 47.3%. In other words, there is no correlation between TENPO INNOVATION subleased restaurant store properties and the underlying market trend for total stores. They are completely uncorrelated. The graph below shows the long-term monthly trend of the Company’s subleased restaurant store properties.
Monthly trend of subleased store properties: textbook definition of stable high growth
Source: compiled by Omega Investment from company IR results briefing materials.
TENPO INNOVATION’s 3 Main Criteria for Selecting Store Sublease Properties Always in High Demand:
●The store property is on the 1F facing a street (regardless of station proximity)
●Monthly rent is affordable in absolute terms (averaging around ¥400k/mo.)
●The property is a vacated-furnished store (lowers the initial investment cost)
Monthly Trend of Sublease Contract Transactions
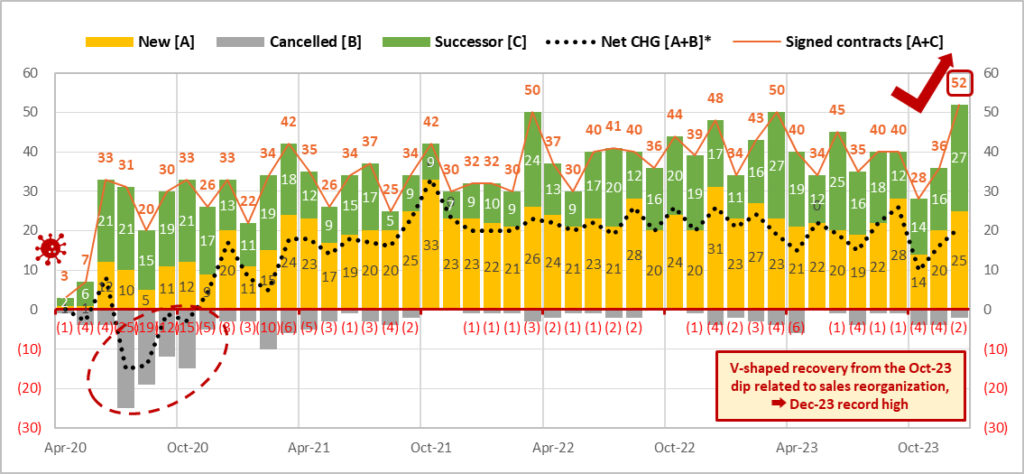
Source: compiled by Omega Investment from company IR results briefing materials. *Note: net change = “New – Cancelled” as well as reflects transfer from “sublease to leasehold” and “leasehold to sublease” (Dec 2021: -2; Jan 2022: -1; Oct 2021: +2; Nov 2022: +1; Dec 2022: -1; Aug-23 +1; Sep-23 -1, Dec-23 -2).
EARNINGS RESULTS: 4Q, 1Q, 2Q
FY23/3 consolidated net sales +14.5% and OP +33.2%
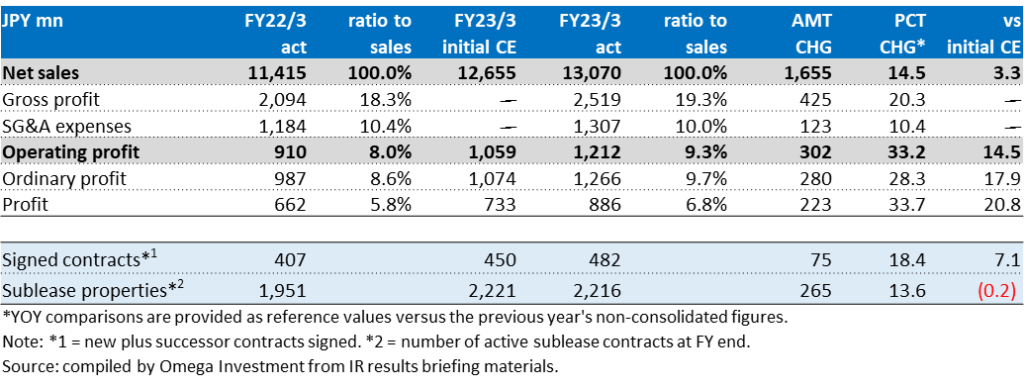
Since the Company began consolidating the accounts of newly established wholly-owned subsidiary Tenpo Safety Inc. from FY23/3, YoY figures are provided for reference versus non-consolidated results the previous term. Net sales increased +14.5% YoY, OP increased +33.2% YoY, GPM rose from 18.3% → 19.3%, and OPM rose from 8.0% → 9.3%. In addition to the contribution from new high-margin rent guarantee business, store subleasing business got a boost from the increase in new successor contracts from 135 → 197 (+45.9% YoY). Store subleasing sales increased +16.7% (sublease properties rose to 2,216, +13.6%), and store subleasing OP of ¥962mn increased +32.9%.
Real estate trading business got a boost from the sale of 5 properties which included several large-scale profitable properties (see graph below). In FY23/3, 5 properties were sold and 8 properties were acquired (Q4-only: 0 properties sold, 3 properties acquired), bringing the number of properties held by the Company to 6 at the end of FY23/3. Real estate trading sales declined -9.6%, however real estate trading OP of ¥251mn increased +34.7%. Although the primary objective of this business was to maintain a good relationship with RE brokers by paying meaningful commissions in return for good information on sublease candidates, the Company has recently also received interest from existing owner landlords to purchase properties, enhancing a stable supply pipeline without referrals, and this is now a full-fledged business.
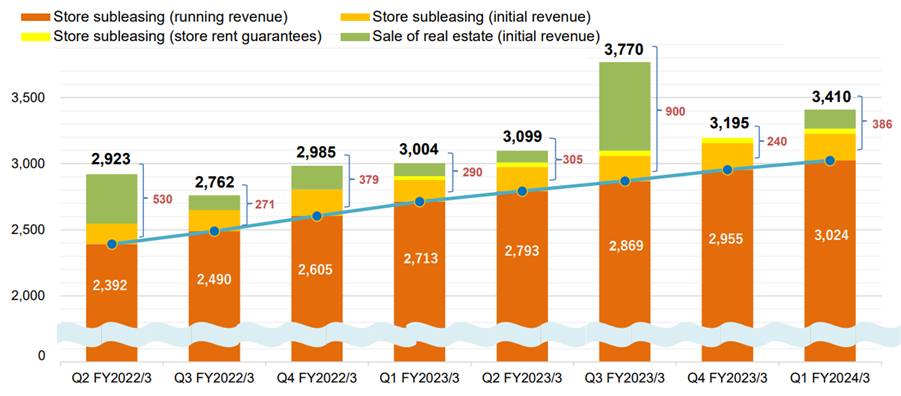
4Q FY23/3 Quarterly Trend of Sales Breakdown by Revenue Category (JPY mn)
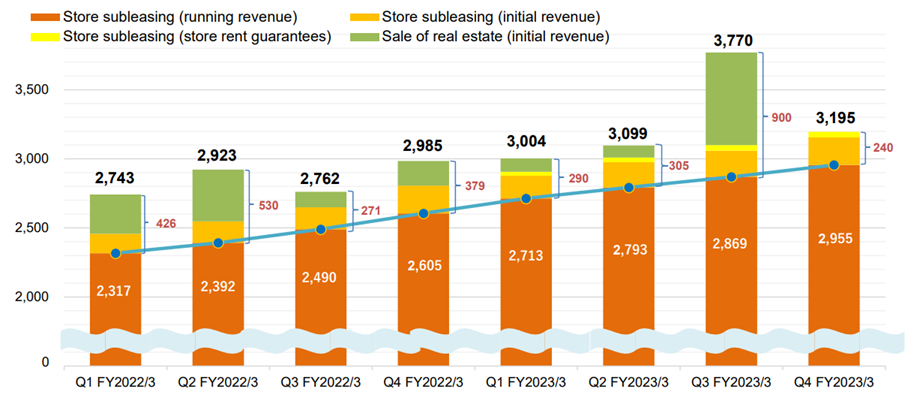
Note: initial income includes one-time payments of key money, contract-related fees and proceeds from the sale of fixtures from vacated-furnished store properties. Running income includes rent income and contract renewal fees from sublease tenants. Store sublease rent guarantees include some running income. Figures for 1Q FY23/3 are consolidated; figures for 4Q FY22/3 and earlier are non-consolidated. Source: excerpt from IR results briefing materials.
TENPO INNOVATION 4Q FY23/3 Financial Results Summary
1Q FY24/3 consolidated net sales +13.5% and OP -14.6%
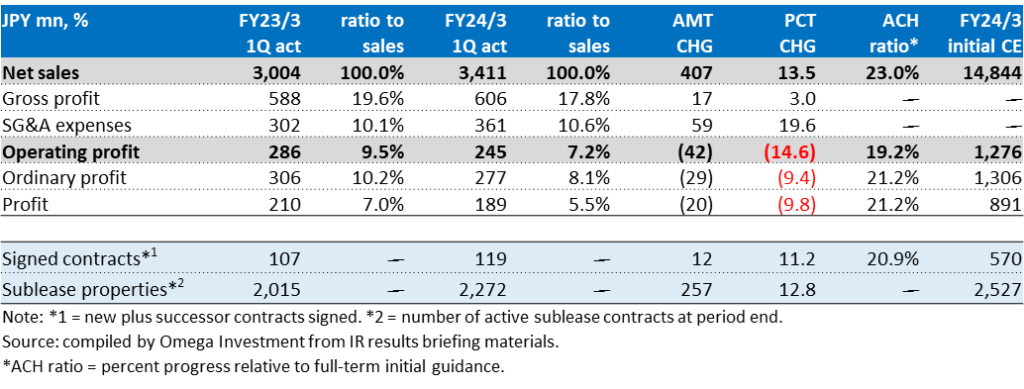
While the environment for the restaurant industry continued to gradually improve during the 1Q given the first Golden Week with COVID restrictions on movement lifted and resumption of inbound tourism, restaurant operators faced headwinds from the sharp rise in meal ingredients and utilities costs, as well as chronic labor shortage. Nevertheless, interest remained strong among individual and small restaurant business operators for the Company’s relatively small, ground floor facing, affordable rent and vacated-furnished subleasing store properties. Store subleasing sales increased +12.4% (sublease properties rose to 2,272, +12.8%). However, store subleasing OP declined -14.0% due to GPM declining 1.8pp on the increase in vacant rents due to aggressive procurement of new sublease store properties, while the ratio of SG&A to sales deteriorated 0.5pp on increased salary and recruiting expenses, executive compensation linked to the previous year’s strong performance, and DX system investments such as the move to electronic contracts, etc.
Real estate trading business sold 2 properties and acquired 5, bring the total inventory to 9 as of the end of June. While sales increased +44.3%, OP fell by 18.4% YoY, partly due to the wait-and-see trend remaining in the market. Although the table below shows the 1Q progress ratio for OP was slightly behind at only 19.2%, the key takeaway from 1Q results is that margins were depressed due to aggressive procurement of new sublease stores and recruitment, which the Company expects to leverage over the next 9 months.
1Q FY24/3 Quarterly Trend of Sales Breakdown by Revenue Category (JPY mn)
Note: initial income includes one-time payments of key money, contract-related fees and proceeds from the sale of fixtures from vacated-furnished store properties. Running income includes rent income and contract renewal fees from sublease tenants. Store sublease rent guarantees include some running income. Source: excerpt from IR results briefing materials.
TENPO INNOVATION 1Q FY24/3 Financial Results Summary
1H FY24/3 consolidated net sales +16.3% and OP -5.3%
In the restaurant industry, sales and the number of customers increased due to the first summer holidays since the downgrade of COVID-19 to “category 5,” an increase in demand for eating out due to the extremely hot summer, and a recovery in inbound sales supported by the weak yen. For drinking establishments, the number of customers during late hours and the demand for large banquets gradually returned, but overall recovery was delayed due to the decrease in the number of establishments. Store subleasing sales increased +12.2% (sublease properties rose to 2,335, +12.3%). Although the number of contracts signed remained at a high level of 115 (2Q), the reorganization of the sales organization led to a slight downward trend in the short term. Store subleasing OP declined -17.3% due to GPM declining 1.3pp on the increase in costs (vacancy rent, construction, commissions, etc.) associated with aggressive sublease property purchases, while the ratio of SG&A to sales deteriorated 0.4pp on increased salary and recruiting expenses, executive compensation linked to the previous year’s strong performance, and DX system investments such as the move to electronic contracts, etc.
Real estate trading business sold 6 properties and acquired 6 as the wait-and-see trend in the market diminished with the normalization of economic and social activities (2Q-only 4 sold, 1 acquired), bringing total inventory to 6 as of the end of September. Net sales increased +39.1%, and OP increased +35.0%. Although the table below shows a slight shortfall to 1H profits, the key takeaway from 1H results is that margins were depressed due to aggressive procurement of new sublease stores and recruitment, which the Company expects to leverage in the 2H.
2Q FY24/3 Quarterly Trend of Sales Breakdown by Revenue Category (JPY mn)
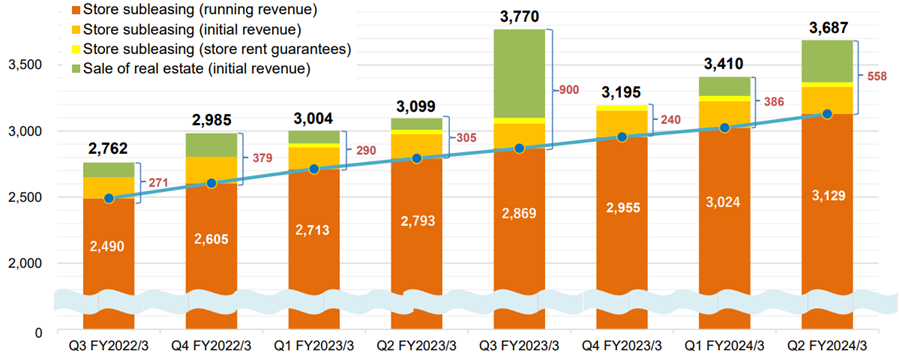
Note: initial income includes one-time payments of key money, contract-related fees and proceeds from the sale of fixtures from vacated-furnished store properties. Running income includes rent income and contract renewal fees from sublease tenants. Store sublease rent guarantees include some running income. Source: excerpt from IR results briefing materials.
★1H hiring of sales staff achieved success
The biggest risk to achieving medium-term targets lies in successful execution of its sales force recruitment • training •assignment plan, particularly for sublease store property procurement. The number of procurement staff increased by 2 in 2Q, from 14 at the end of March to 16 at the end of September. The effect of the transfer of purchasing authority is expected to be realized from 2H into the next fiscal year.
The newly established “Sales Development Department” specializing in sales recruitment (headed by a sales executive) hired 15 new sales staff during the 1H.
TENPO INNOVATION 1H FY24/3 Financial Results Summary

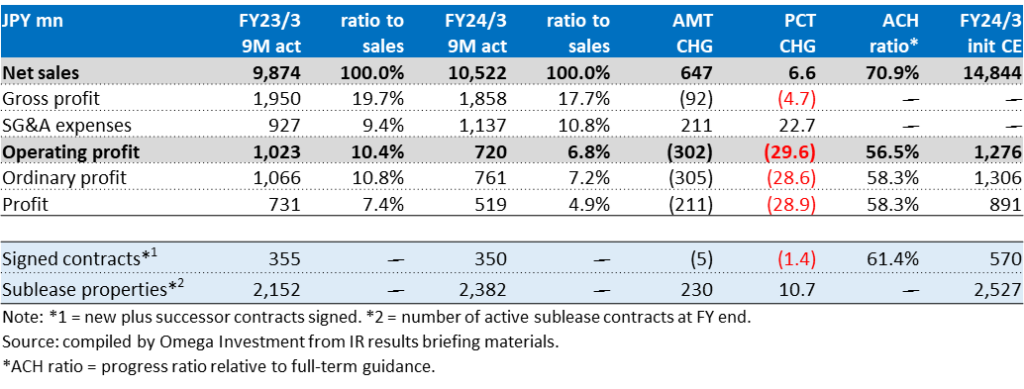
9M FY24/3 consolidated net sales +6.6% and OP -29.6%
In the restaurant industry, sales and the number of customers increased due an increase in demand for eating out due to the extremely hot summer, and a recovery in inbound sales supported by the weak yen. For drinking establishments, the number of customers during late hours and the demand for large banquets gradually returned, but overall recovery was delayed due to the lower number of establishments in the wake of COVID-19. Store subleasing sales increased +11.6% (sublease properties rose to 2,382, +10.7%). Although the number of contracts signed remained at a high level of 116 (3Q), the pace dipped from 40 to 28 in Oct. due to reorganization of the sales organization, subsequently posting a V-shaped rebound to 52 in Dec., a record high (see graph on P2). Store subleasing OP declined -15.6% due to GPM declining on the increase in costs (vacancy rents, construction, commissions, etc.) associated with aggressive sublease property purchases as well as a higher ratio of SG&A to sales from increased salary and recruiting expenses, executive compensation linked to the previous year’s strong performance, and DX system investments such as the move to electronic contracts, etc.
Real estate trading business sold 6 properties and acquired 8 as the wait-and-see trend in the market diminished with the normalization of economic and social activities (3Q-only 0 sold, 2 acquired), bringing total inventory to 8 as of the end of December. Net sales declined -45.2%, and OP declined -69.5% on postponed timing of property sales. The key takeaway from the graph below is the lack of property sales in the 3Q due to timing, expected to rebound in the 4Q, bringing an associated rebound in 4Q profits. Full-term forecasts were left unchanged.
3Q FY24/3 Quarterly Trend of Sales Breakdown by Revenue Category (JPY mn)
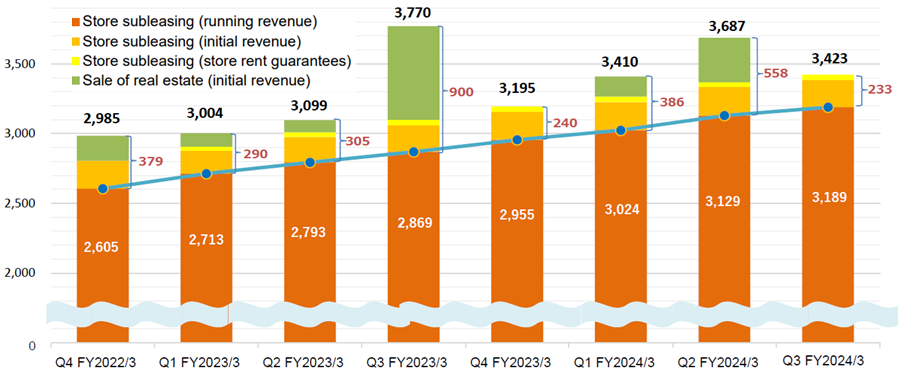
Note: initial income includes one-time payments of key money, contract-related fees and proceeds from the sale of fixtures from vacated-furnished store properties. Running income includes rent income and contract renewal fees from sublease tenants. Store sublease rent guarantees include some running income. Source: excerpt from IR results briefing materials.
TENPO INNOVATION 3Q Cumulative FY24/3 Financial Results Summary
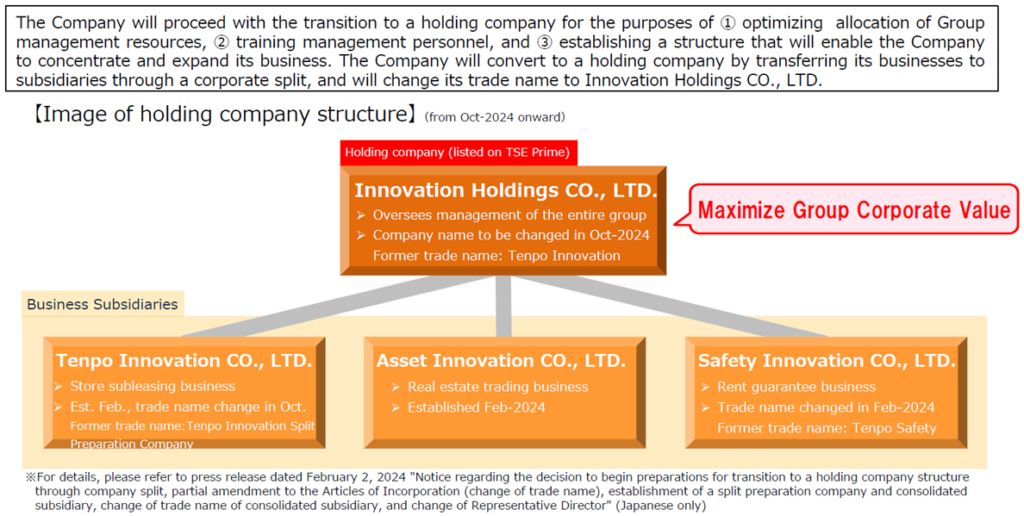
TOPICS: Transition to a Holdings Company Structure
The Group has decided to begin preparations for the transition to a holding company structure in order to optimize the allocation of management resources, to promote the development of the next generation of management personnel, and to create a structure that will enable flexible decision-making and flexible responses to changes in business conditions in order to promote business expansion by focusing more on each of the Group’s businesses. By transitioning to a holding company structure, the holding company will oversee the management of the entire Group, while each subsidiary will focus on promoting its own business, thereby maximizing the corporate value of the Group.
The business to be divested will be transferred to a wholly owned subsidiary (split preparation company) through a company split (absorption-type split) with the Company as the splitting company, and the split preparation company as the successor company. In addition, the Company will continue to be listed as a holding company. The Company’s trade name change to “Innovation Holdings CO., LTD.” is subject to approval of partial amendment to the Articles of Incorporation at the 18th Annual General Meeting of Shareholders scheduled to be held in mid-June of 2024 (effective date of the absorption-type split: October 1, 2024). Details of the new holding company structure, new trade names, etc., are outlined in the exhibit below.
Schedule of the company split
1)Board of Directors’ meeting to approve the establishment of the successor split preparation company: February 2, 2024
2)Establishment of the successor split preparation company: early February 2024
3)Board of Directors’ meeting to approve the transition to a holding company structure: mid-May 2024 (planned)
4)Board of Directors’ meeting to approve the absorption-type split agreement: mid-May 2024 (planned)
5)Conclusion of absorption-type split agreement: mid-May 2024 (planned)
6)General Meeting of Shareholders to approve the absorption-type split agreement: mid-June 2024 (planned)
7)Effective date of the absorption-type split: October 1, 2024 (planned)
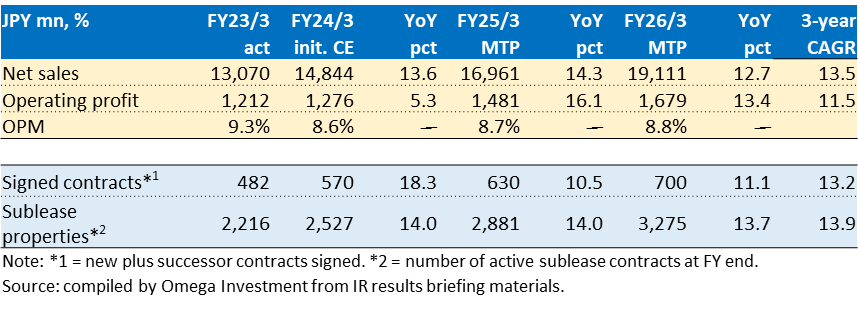
TENPO INNOVATION Medium-Term Management Plan
Priority initiative to strengthen and enhance the sales force
The Company has the following medium-term and long-term targets.
By FY26/3, increase the Sales Dept. from 36 professionals to 100 (currently 14 in charge of property procurement → 30, 19 in charge of finding tenants → 70, 3 dual roles).
(Depending on the success of DX etc., optimal sales team size may be 80-90)
As of the end of June, there were 15 procurement staff and 25 tenant leasing staff (40), and separately 4 executives/managers from other departments, some involved with purchasing.
As of the end of September, there are 16 procurement staff and 31 tenant leasing staff (47)
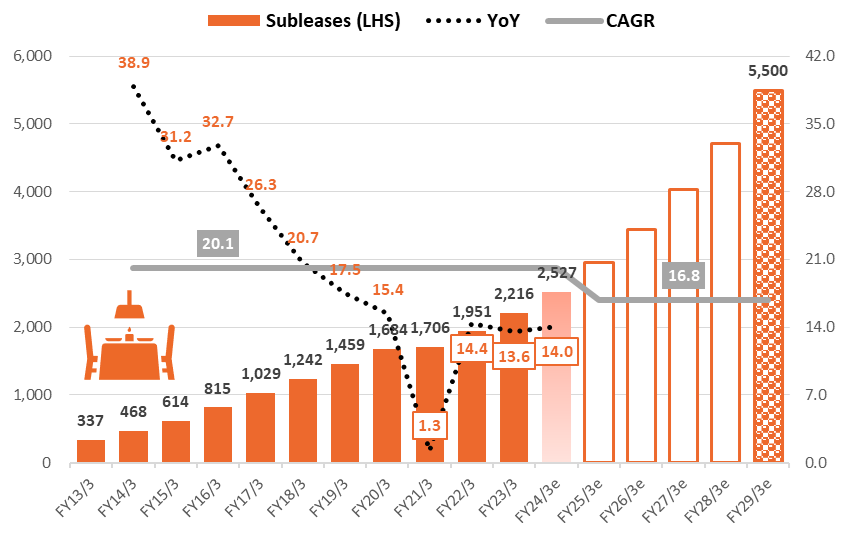
- Subleased store property net adds to 600 per year (by FY27/3)
- Contracts signed to 1,000 per year (by FY28/3)
By FY29/3, increase the number of active subleased store properties to 5,500
- Net sales ¥30 billion
- Operating profit ¥3 billion
- OPM 10.0%
As TENPO INNOVATION is the only specialist firm engaged in this restaurant store property subleasing business, this is no easy task, and cannot be accomplished by simply directing a headhunting firm to find the required personnel (they simply do not exist). Management fully recognizes that the way forward is to find suitable personnel and provide advanced level on-the-job training by existing professional staff. The point is that there is a lot of technical background knowledge required about property specifications such as the correct amperage requirements for electricity supply, drainage pipe diameter, etc., as well as expertise and know-how in retail properties, the restaurant industry, the city, restaurant facilities, and legal matters.
The Company summarizes its HR strategy for the Sales Dept. in a 3-point plan: ① increase staff, ② provide advanced OTJ training and ③ assign capable sales staff to property procurement. Management envisions this extensive training for sales staff to find tenants for subleasing will take one year. Specifically, it will try to develop a standard method of passing on the expert knowledge involving the 237 items/steps from introduction of the property to concluding a subleasing agreement. Then, recognizing that procurement has a high level of difficulty and strategically holds the highest importance to future growth, it will optimize transfer and assignment of capable sales staff.
Then, in order to achieve the second long-term goal above of increasing the number of active subleased store properties to 5,500 by FY29/3, management will employ a strategy of ④ procurement area focus. Specifically, roughly 30 procurement staff will cover approximately 1,000 station areas and 2,000 real estate agents. For terminal stations with more than 1 million passengers and major real estate agencies, multiple procurement staff will be assigned. The target is to achieve procuring roughly 600 store properties per year (or 50 per month) by FY27/3.
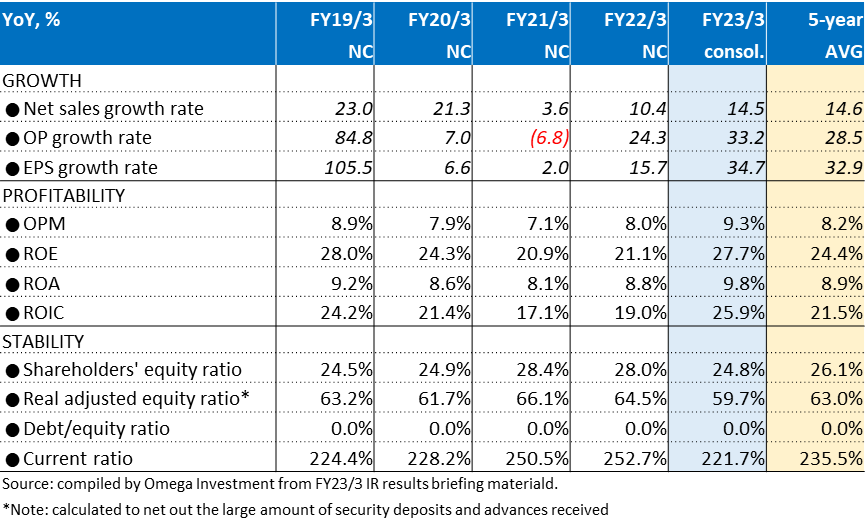
The biggest risk to achieving medium-term targets lies in successful execution of its sales force recruitment/training/assignment plan, particularly for sublease store property procurement. At the same time, management is proactively working to offset the risk of failing to secure sufficient human resources through reorganization of sales methods, assigning sales executives as executives in non-sales departments, and proactive deployment of DX system investments. The table below shows that key management indicators particularly for growth and profitability made significant advances in FY23/3.
Trend of Key Management Indicators
[Reference] Overview of Sales Force Strategy
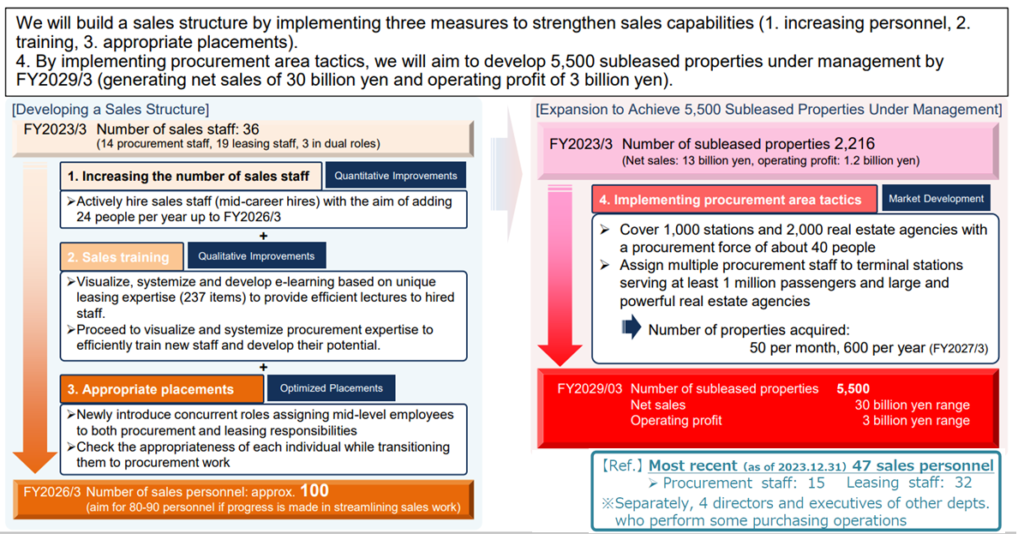
Source: excerpt from 3Q FY24/3 company IR results briefing materials.
SHARE PRICE & VALUATIONS
3Y Share Price Chart, 13W/26W/52W MA, Volume and Valuation Trends
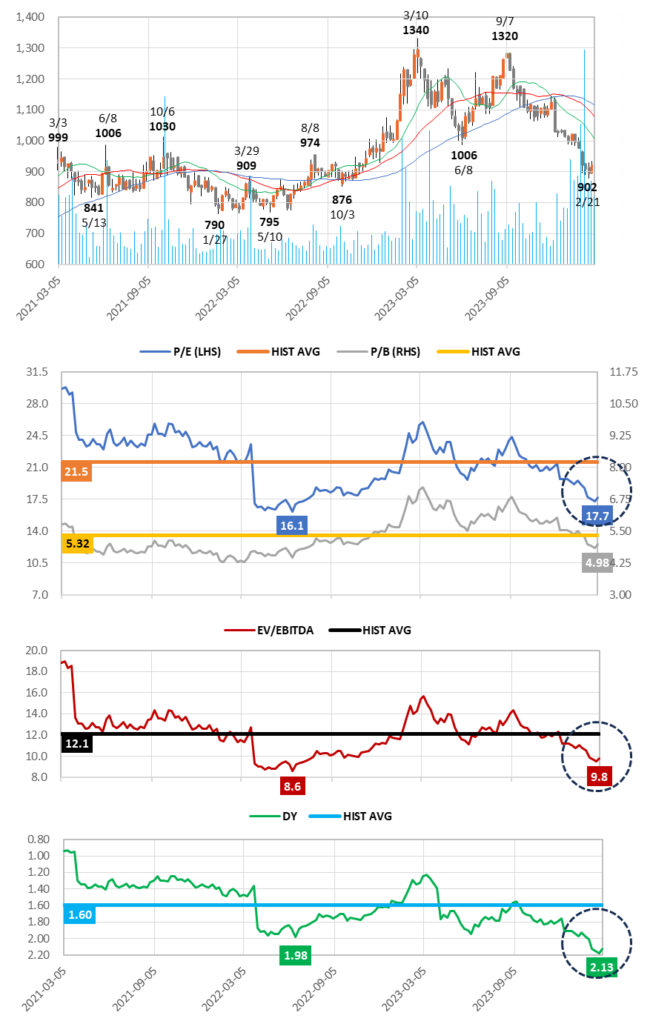
Key takeaways:
❶ After disappointment selling in reaction to short-term higher costs depressing profit margins in the 9M ended 23/12/31, the current P/E and EV/EBITDA appear to be finding support around the middle-of-the-range lows, the P/E trading on an 18% discount and EV/EBITDA on a 19% discount to their respective historical averages.
❷ The equity ratio on the surface may appear low at 24.0%, however this reflects the fact that the B/S is comprised of a large amount of deposits paid and received (see B/S on next page). The Company is debt-free, and the B/S is extremely healthy.
❸ Following the revised dividend policy from FY24/3 raising target payout from 30% → 40% (see P14 for details), the current dividend yield is trading 33% above its historical average.
Consolidated balance sheets
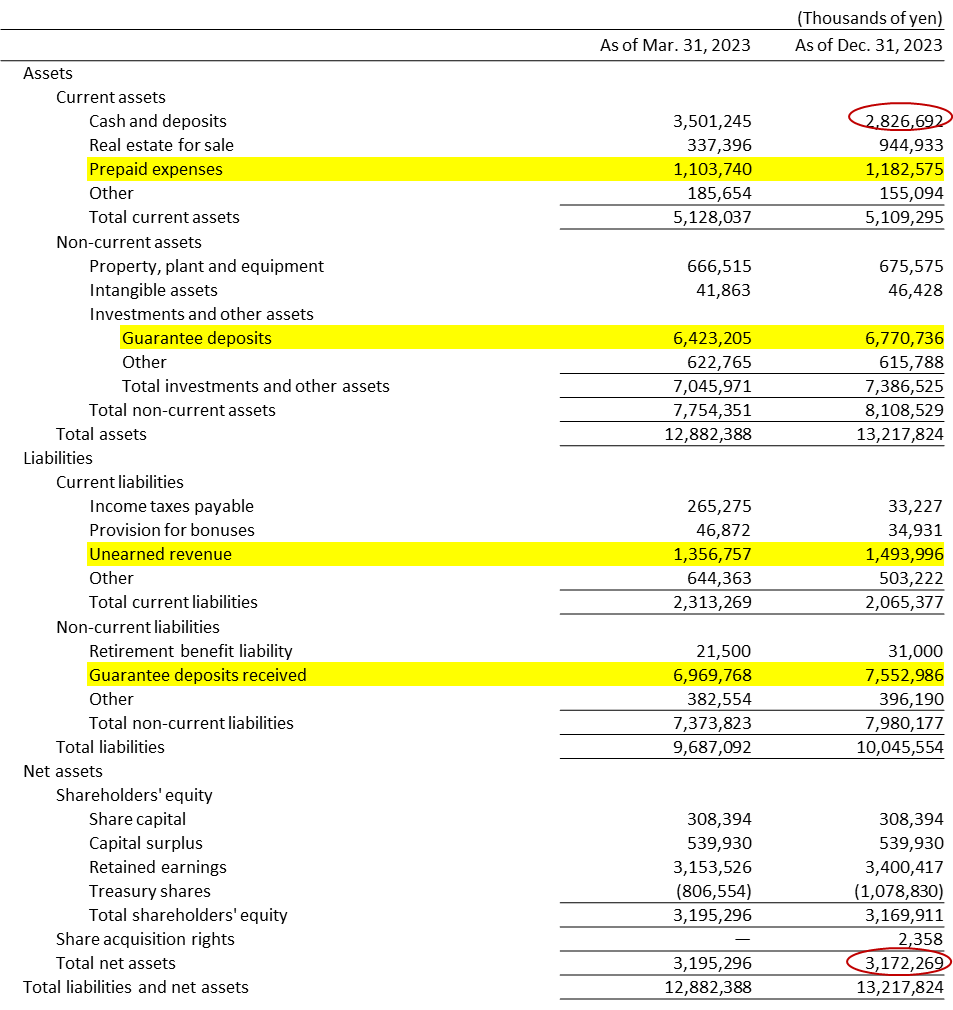
Source: Summary of Consolidated Financial Results (TANSHIN financial statements)
3Y Relative Share Price Performance and 5Y Trend of GP/OP and GPM/OPM
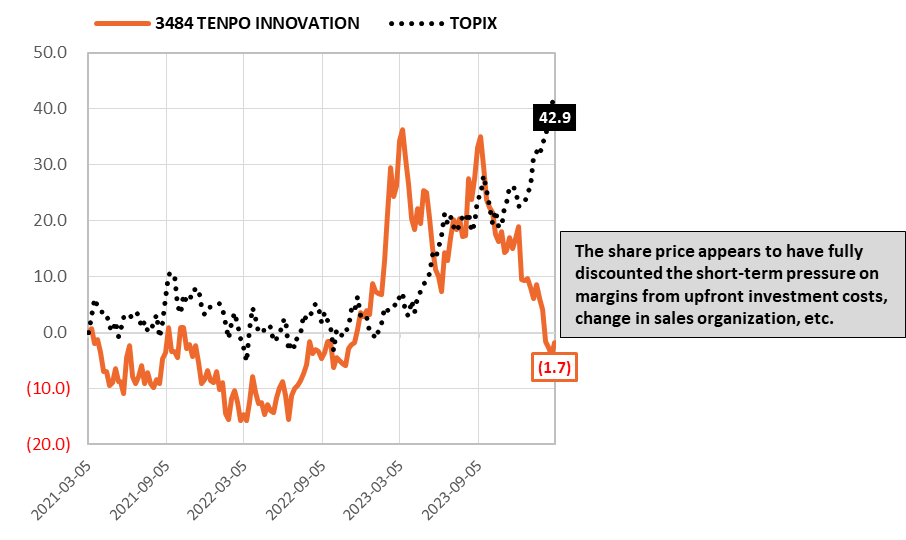
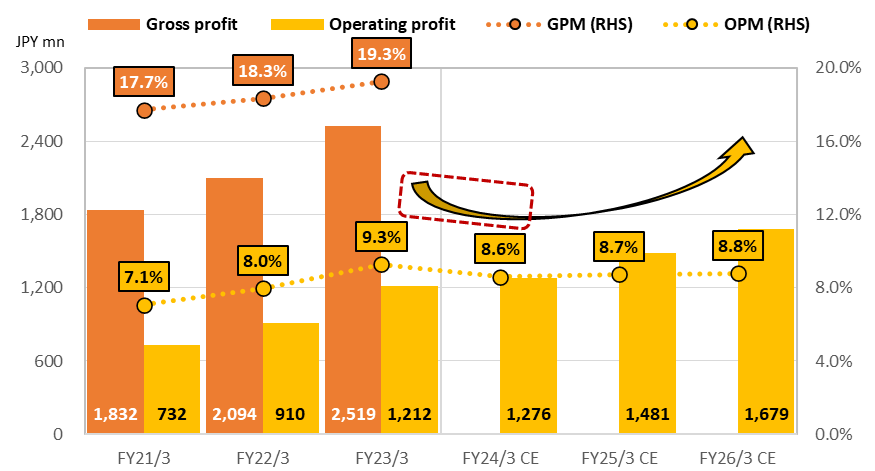
Source: compiled by Omega Investment from company IR results briefing materials.
While higher turnover under COVID-19 had been a favorable opportunity for the Company as more properties became available to procure for subleasing, and turnover in existing contracts increased the number of profitable successor contracts, the current phase has even more potential as the number of individual and small restaurant business operators seek to open new restaurants in preparation for the recovery phase.
Omega Investment believes current valuations have become more attractive ahead of this growth opportunity with stability manifesting itself.
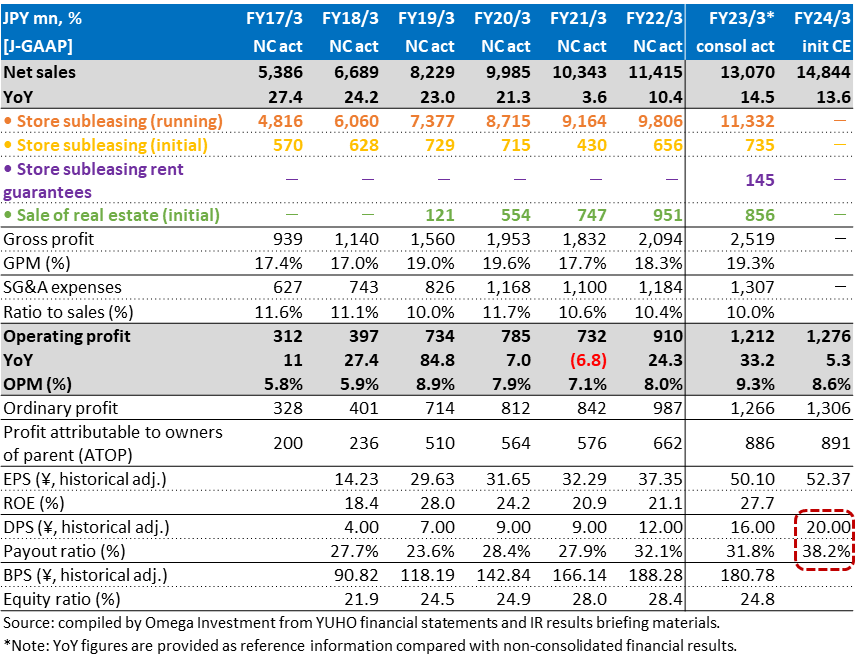
TENPO INNOVATION Financial Highlights/Key Indicators
Shareholder Return Policy
The Company’s basic policy is to pay stable dividends while strengthening its management base. The revised dividend policy from FY24/3 shown below aims to raise the target payout ratio from the 30% level ➡ the 40% level.
Trend of Dividends Paid and Payout Ratio
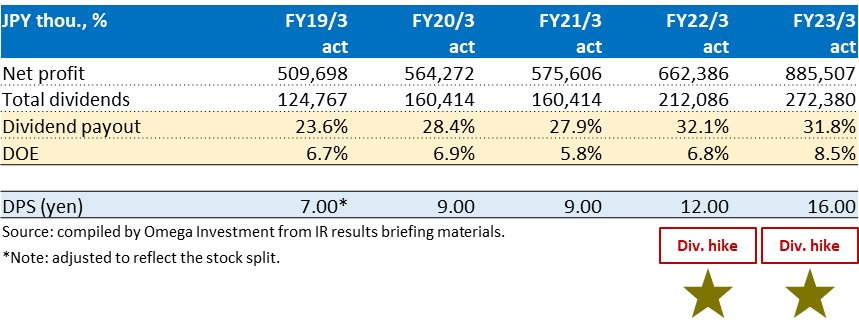
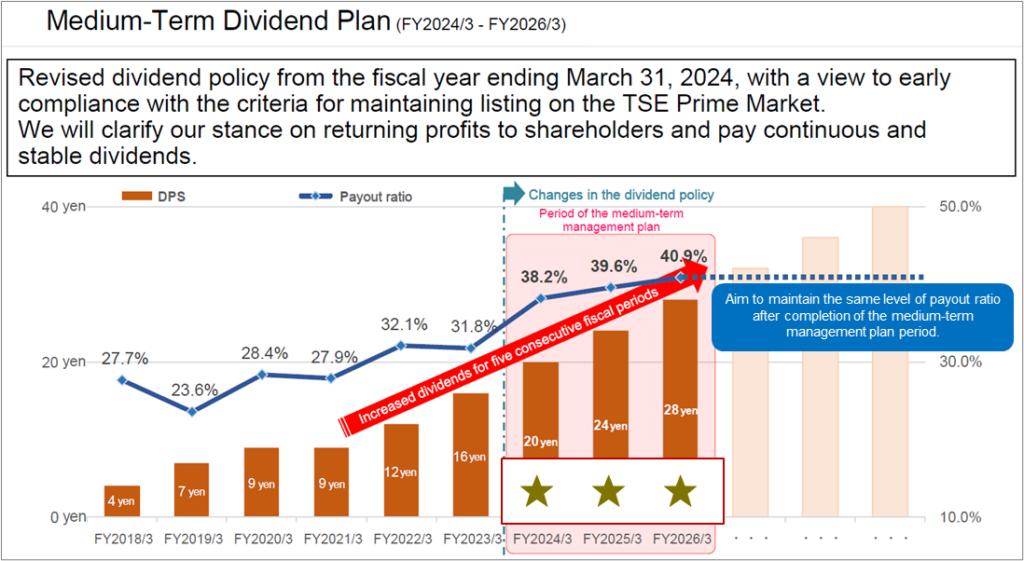
Source: excerpt from IR results briefing materials. Note: Figures from FY2023/3 onward are consolidated. Figures up to FY2022/3 are non-consolidated. Listed amounts for dividends per share have been retroactively adjusted to reflect stock splits. Dividends per share and dividend payout ratios during the medium-term management plan (FY2024/3 to FY2026/3) are company estimates.