2026-07-27
Home
Japanese

Omega Investment Co., Ltd.
Cosmo Bio (Company note – basic)

| Share price (15/4) | ¥1,007 | Dividend Yield (12/24 CE) | 2.97 % |
| 52weeks high/low | ¥1,072/940 | ROE(12/23) | 5.4 % |
| Avg Vol (3 month) | 7.1 thou shrs | Operating margin (12/23) | 5.6 % |
| Market Cap | ¥6.09 bn | Beta (5Y Monthly) | 0.68 |
| Enterprise Value | ¥2.74 bn | Shares Outstanding | 5.835 mn shrs |
| PER (12/24 CE) | 19.6 X | Listed market | TSE Standard |
| PBR (12/23 act) | 0.69 X |
| Click here for the PDF version of this page |
| PDF Version |
Contribute to the advancement of life sciences by providing research reagents and life science equipment
Summary
◇ Cosmo Bio Co., Ltd is a trading company specialising in the life sciences with the aim of “Contribute to the advancement of life sciences”. Founded in 1983 as a subsidiary of the former Maruzen Oil, the company went through an MBO and is now an independent, specialised trading company. Approximately 80% of sales are research reagents used in research facilities of pharmaceutical companies, universities and research institutions. The company’s strengths lie in its extensive procurement network of more than 12 million products and services from 600 suppliers, including overseas suppliers, and its highly specialised personnel and sales force that accurately identify the needs of domestic customers. In recent years, the company has been adding value by providing its manufactured products and services and outsourced services.
◇ Reagent market expected to grow steadily: The domestic life science research reagent market is estimated to be worth approximately 120 billion yen and is growing steadily at an annual rate of around 3%. Given trends in R&D expenditure by client pharmaceutical companies and Grants-in-Aid for Scientific Research, a budget indicator for universities and research institutions, long-term stable growth is also expected.
Players in this market include Japanese subsidiaries of foreign reagent manufacturers, subsidiaries or business units of major Japanese chemical manufacturers and independent trading companies, including the company. The company’s market share is currently estimated at around 5%.
◇ Risk factors: First, trade area risk. Restructuring through mergers and acquisitions is routine in North American biotechnology-related ventures, which are frequent suppliers of reagents, and changes in shareholders may result in the loss of commercial rights. Overseas headquarters may also establish local subsidiaries in Japan. Secondly, there is the risk of exchange rate fluctuations. It is essential to mitigate cost increases due to a weaker yen by using forward exchange contracts and selling price adjustments, but in addition, offsetting foreign exchange risks by expanding exports overseas is also required.
◇FY12/2023: Full-year results: net sales of 9.34 billion yen (-2.2% YoY), operating profit of 519 million yen (-36.3% YoY), profit attributable to owner of parent company of 442 million yen (-14.4% YoY). The factors contributing to these results were slow growth in contract service brokerage resulting from restrained sales activities during the COVID-19 disaster, inventory adjustments of consumables at customers, an increase in the cost of sales ratio due to the weaker yen (actual 140 Yen/USD, a 12 yen lower than the previous year), and an increase in SG&A expenses due to increased sales activities.
◇FY12/2024: The company forecasts sales of 9.8 billion yen (+4.9% YoY), operating profit of 390 million yen (-25.0% YoY) and profit attributable to owner of parent company of 310 million yen (-30.0% YoY) at an assumed exchange rate of 150 Yen/USD. COGS ratio worsened due to the weak yen, and the build-up of selling, general and administrative expenses were the main reasons for the decline in profits. The profit and loss situation in the first quarter, which has a high weighting in terms of profits, will probably indicate the direction of the full year.
◇Three-year plan: the first year of the three-year plan, with FY12/2023 as the first year, has now passed. The company aims to strengthen its trading company functions, such as by strengthening exports, and its manufacturing functions, such as by expanding its own contract services and manufacturing and sales. Sales of the manufacturing function appear to be growing steadily, and with the launch of the contract service matching website Scientist3 planned for spring 2024, expectations are high for the final year of the medium-term plan.
◇ Share price observation: In the past year, the share price has hovered around 1,000 yen. The share price is supported by the company’s profitable and sound financial position, low PBR and dividend yield in the 3% range despite declining profits. However, issues awaiting improvement, such as growth potential, ROE, and resistance to currency fluctuations, have prevented the company’s share price from keeping pace with the recent significant rise in the TOPIX. The investment focus will be on the results in the final year of the medium-term plan to see whether the measures in the medium-term plan are making steady progress and whether the company will enter a stage where these improvements can be envisaged in the near future.
Table of contents
| Summary | 1 |
| Key financial data | 2 |
| Company profile | 3 |
| History/Breakdown of most recent sales/Company’s group | 3 |
| Business overview | 5 |
| Japanese research reagent market/products and services | 5 |
| Corporate uniqueness, strengths/risk factors | 8 |
| Earnings trend | 9 |
| Financial results | 10 |
| Full-year results for FY12/2023 | 10 |
| FY12/2024 full-year forecast | 11 |
| Growth strategy | 13 |
| Share price trend | 16 |
| Financial data | 18 |
| Corporate data | 19 |
| Corporate profile/history | 19 |
| The top management/Corporate governance | 20 |
| Major shareholders/Shareholding by ownership/Shareholder return policy | 21 |
Key financial data
2018/12 |
2019/12 |
2020/12 |
2021/12 |
2022/12 |
2023/12 |
2024/12 |
|
[Statements of income] |
Company
|
||||||
Net sales |
7,261 |
7,590 |
8,092 |
9,231 |
9,553 |
9,340 |
9,800 |
Cost of sales |
4,602 |
4,710 |
4,940 |
5,572 |
6,112 |
6,090 |
|
Gross profit |
2,659 |
2,879 |
3,152 |
3,658 |
3,440 |
3,249 |
|
SG&A expenses |
2,330 |
2,474 |
2,399 |
2,609 |
2,624 |
2,729 |
|
Operating income |
328 |
405 |
752 |
1,048 |
816 |
519 |
390 |
Ordinary income |
403 |
470 |
817 |
1,099 |
790 |
653 |
450 |
Net profit before taxes |
403 |
388 |
1,008 |
1,099 |
790 |
653 |
|
Net profit attributable to owners of the parent |
260 |
237 |
674 |
737 |
517 |
442 |
310 |
[Balance Sheets] |
|||||||
Current assets |
5,668 |
5,927 |
6,756 |
7,310 |
7,136 |
7,102 |
|
Cash equivalents and short-term securities |
2,268 |
2,516 |
3,259 |
3,555 |
3,036 |
3,025 |
|
Non-current assets |
2,832 |
2,962 |
2,883 |
2,761 |
3,176 |
3,770 |
|
Total assets |
8,501 |
8,890 |
9,640 |
10,072 |
10,313 |
10,872 |
|
Total liabilities |
1,448 |
1,568 |
1,779 |
1,752 |
1,695 |
1,846 |
|
Total net assets |
7,053 |
7,321 |
7,861 |
8,319 |
8,617 |
9,026 |
|
Equity ratio (%) |
77.4% |
77.0% |
76.3% |
77.3% |
78.1% |
77.7% |
|
[Statements of cash flows] |
|||||||
Cash flow from operating activities |
908 |
549 |
803 |
648 |
284 |
736 |
|
Cash flow from investing activities |
-185 |
-115 |
42 |
-145 |
-291 |
-758 |
|
Cash flow from financing activities |
-85 |
-85 |
-97 |
-420 |
-236 |
-201 |
|
Increase/decrease in cash and cash equivalents |
684 |
348 |
743 |
95 |
-218 |
-210 |
Source: Omega Investment from company materials
Company profile
Cosmo Bio is a trading company specialising in the life-science field, focusing on reagents*, with the Group’s objective of “Contribute to the advancement of life sciences”. Its main business is purchasing and wholesale research reagents, equipment, contract services and clinical reagents related to life sciences. Reagents’ market size is different from those of diagnostics and therapeutics. Still, they are essential products and services indispensable for life science researchers worldwide to develop new drugs.
History
The company’s history can be traced back to 1983 when it was founded as Maruzen Oil Biochemical Co., Ltd as a subsidiary of the former Maruzen Oil (now Cosmo Oil) for basic biotechnology research reagent business. The company subsequently renamed itself to Cosmo Bio Co., Ltd. (1985) following a merger and restructuring of the parent company. In the same year, the company began selling equipment for bio-research. In September 2000, the company became independent from Cosmo Oil through an MBO. In August 2004, it established Cosmo Bio USA, Inc. in San Diego, California, one of the world’s leading bioresearch centres and the location of many bio-ventures. It was made a base to search for reagents and promote the export of Japanese-made reagents. In September 2005, the company was listed on the JASDAQ market. Subsequently, the company expanded its operations by investing in and merging with companies in related fields. In December 2006, Primary Cell Co., Ltd. became a subsidiary, and Cosmo Bio entered the manufacturing business. In March 2010, BM Equipment Co., Ltd. was consolidated as a trading subsidiary that imports equipment and consumables for life science research. In October 2017, the company relocated and consolidated its Sapporo business facilities and opened the Sapporo Office, establishing a structure to reinforce its recent focus on contract services and manufacturing and sales. (See also the Alignment Chart on p. 19)
Breakdown of most recent sales
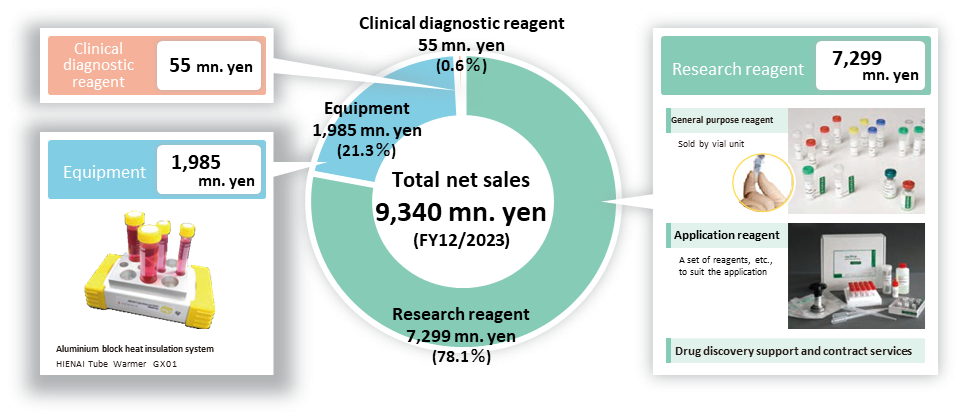
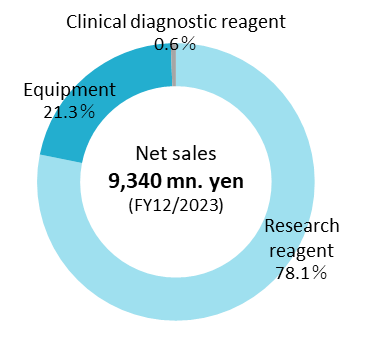
Research reagents, Equipment and Clinical diagnostic reagents account for 78%, 21% and 1% of the company’s FY12/2023 sales of 9,340 million yen, respectively.
Breakdown of sales by product
*Reagents: according to the Japan Reagents Association, reagents are legally defined as ‘chemical substances used for the detection or quantification of substances by chemical methods, experiments in the synthesis of substances or for physical properties’.
The general concept is also defined as “chemicals used for measurement standards, detection and confirmation of substances, quantification, separation and purification, synthesis experiments and measurement of physical properties in testing and research cases, such as inspection, testing, research and experiments, in the form of supply suitable for small quantities with guaranteed quality for the respective purpose of use”. More specifically, they are agents used for experiments, research, and measurements and include chemical substances, components extracted from the body of a living organism (proteins, cells, nucleic acids, etc.), and solvents used to react with them. Reagents for life science are mainly extracted from living organisms or synthesised from such substances and are supplied in small quantities, such as several tens of micrograms.
On the other hand, diagnostic reagents are drugs doctors use in various tests to diagnose health or disease conditions. They are also known as in vitro diagnostic drugs or clinical diagnostic reagents and are distinguished from reagents.
Generally, we take therapeutic drugs (ethical drugs) to cure diseases. They are administered to treat various diseases and are researched, developed, manufactured, and marketed by major national and international pharmaceutical companies.
The domestic market for life science research reagents is around 120 billion yen (2021, company data), the market size for diagnostics is about 800 billion yen (2021, Japan Association of Clinical Reagents Industries), and the market for therapeutic drugs (ethical drugs) is approximately 9.4 trillion (2021, IQVIA) being by far the largest.
Company’s group
The company’s group comprises Cosmo Bio (the company), two consolidated subsidiaries: BM Equipment and Cosmo Bio USA, Inc., and the non-consolidated subsidiary Proteintech Japan Co., Ltd. For their respective businesses and product flows, see the diagram below. BM Equipment and Proteintech Japan are located on the same floor in the head office in Koto-ku, Tokyo, where Cosmo Bio is based, to facilitate communication as a group.
Overview of the company’s group and product flow

Source: Company materials
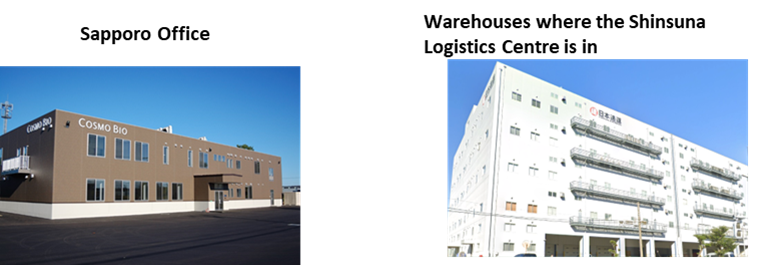
In addition to Koto-ku, Tokyo, mentioned above, where the company’s head office is located, the company’s other operating bases include the Sapporo Office and the Shinsuna Logistics Centre. As mentioned in history, the Sapporo Office (Otaru, Hokkaido) was established in October 2017 by relocating and consolidating the company’s Sapporo area business facilities. The facility is responsible for contract services and manufacturing and sales, which are the company’s growth areas of focus.
The Shinsuna Distribution Centre was opened in January 2013. The company runs a system to hold an inventory of hot-selling products (the Group’s products and inventory on its BS at end-December 2023 amounted to about 1 billion yen) and ship them. The company can respond precisely to the needs of pharmaceutical companies, universities, and research institutions, which often require prompt deliveries.
Source: Company materials, etc.
Business overview
Provides essential reagents and equipment for life science researchers worldwide
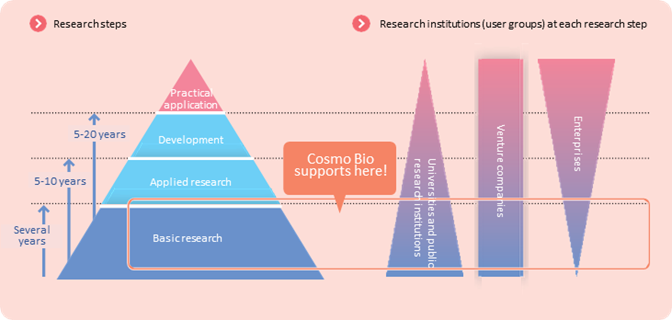
The company provides life science researchers worldwide with research reagents that are integral to the basic research process. The development of pharmaceuticals usually takes a long period, over ten years, involving basic research, applied research, development and clinical trials. In recent years, the development of antibody drugs and the linkage with IT, such as in silico (including the application of quantum computers to accelerate the process), are expected. Still, steady research activities in the research field are necessary.
The reagents and equipment provided by the company are essential items in basic research at pharmaceutical companies, universities, and research institutions, and demand is expected to grow steadily to ensure a stable and constant profit margin.
Life science research and User demographic
Source: Company materials
Japanese life science research reagents market
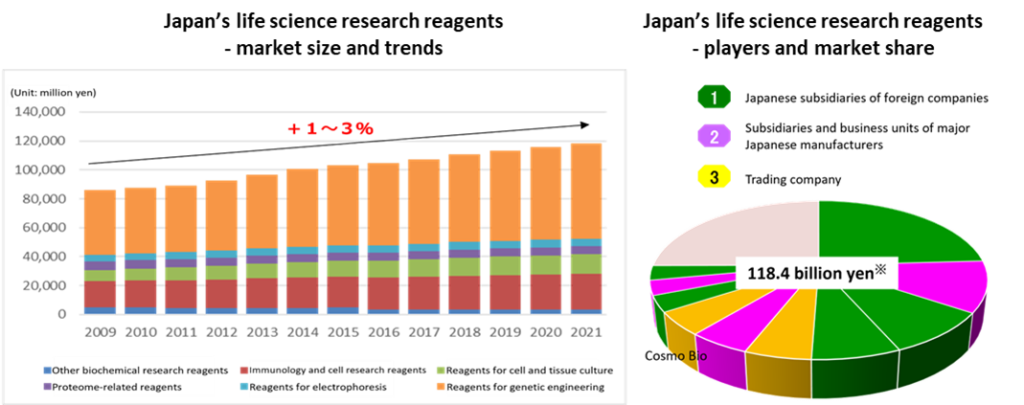
The domestic life science research reagent market has grown at an average annual growth rate of about +3% so far, and the market size is estimated to be around 120 billion yen in 2021.
The market shares by operators are shown in the chart on the right below. Japanese subsidiaries of reagent companies in North America and elsewhere and group companies or business units of major Japanese chemical manufacturers account for a certain share. Two independent specialist trading companies, including the company, are also in the Top 10, and their share is estimated to be around 5%. Although competition between the companies is intense, each has its own areas of specialisation, and they can secure a certain level of sales and profits.
Source: Omega Investment from company materials
Next examines the status of the reagents’ users. As mentioned, the customers of reagents are pharmaceutical companies, universities, research institutions and other research facilities in the life sciences sector.
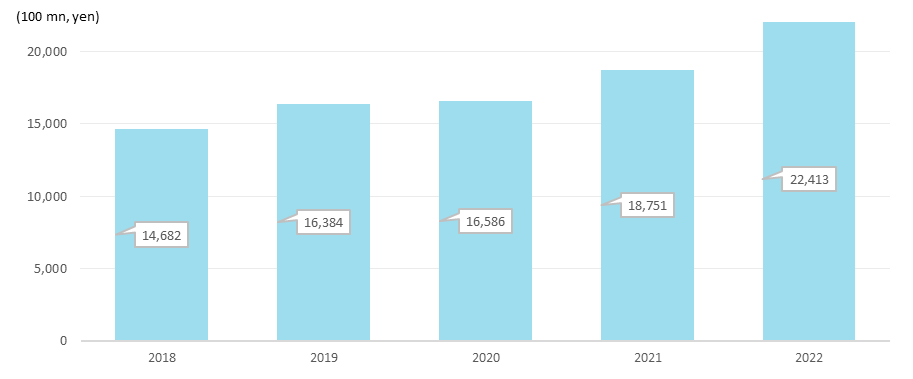
Firstly, the total R&D expenditure of Japan’s top 10 largest pharmaceutical companies was worth 2.2 trillion yen in FY2022 and is growing steadily, as shown below. Much of the company’s reagent business is estimated to be related to research expenditure in Japan, and it appears that this part of the business is also generally performing well.
Trends in research and development expenditure of major domestic pharmaceutical companies
Note: Total R&D expenditure of Takeda Pharmaceutical, Daiichi Sankyo, Astellas, Otsuka HD, Eisai, Chugai Pharmaceutical, Sumitomo Pharma, Ono Pharmaceutical, Shionogi&Co and Kyowa Kirin Co. Mitsubishi Tanabe Pharma has been excluded because it was not possible to obtain consecutive figures.
Source: Prepared by Omega Investment from the companies’ annual reports.
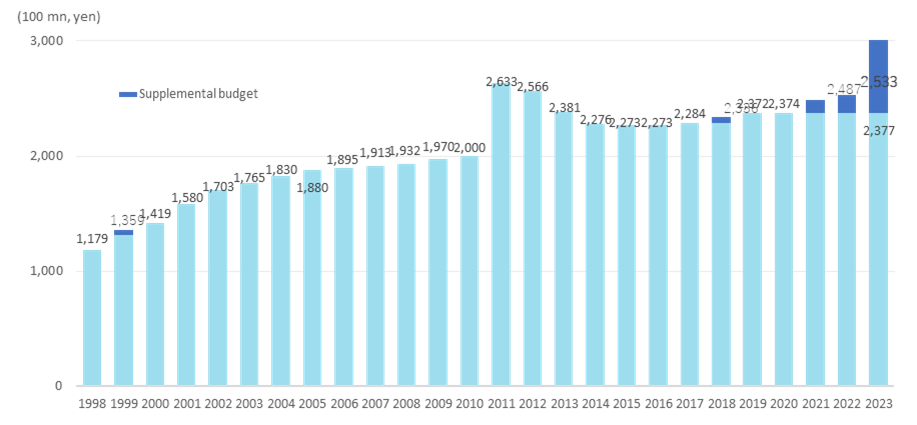
Next, trends in Grants-in-Aid for Scientific Research (KAKENHI) at Japanese universities and educational institutions are as follows. University-related budgets have often been cut, but Grants-in-Aid for Scientific Research are on an increasing trend to promote contemporary demands and innovation in academia while reforming the system. The underlying trend can be considered solid, although the rise in utility costs has put pressure on field budgets at some points.
As described above, the life science research reagent market can be considered a stable growth market.
Trends in Grants-in-Aid for Scientific Research
Source: Prepared by Omega Investment from the Ministry of Education website and other sources
The range of products and services offered by the company
The company introduces 12 million state-of-the-art products from some 600 suppliers worldwide, adds its value and provides them to life science researchers through its approximately 200 distributors. Furthermore, in addition to the traditional trading company business, in recent years, the company has promoted the development and manufacture of its own products and the provision of its own contract services. Examples of current products and services are as follows.
Corporate uniqueness/strengths
Strong relationships of trust with clients and suppliers: In research and development, where reagents are used, a single reagent is rarely used in large quantities. A variety of reagents in microgram quantities are required at each research level. The company is attentive to diverse needs based on 40 years of building trusting relationships with clients and solid relationships with suppliers of state-of-the-art reagents, mainly in North America.
Providing state-of-the-art information in the life-science field: As a specialist life sciences trading company, in addition to the information-gathering capabilities of its head office, the company, in cooperation with COSMO BIO USA, INC, also exhibits and participates in various bio-related events, providing cutting-edge information in the life sciences sector to anticipate the needs of its clients.
Responding to user needs by manufacturing and developing in-house products: In addition to its principal business as an importer and trading company, it manufactures and sells cells that cannot be replaced by imported cells and provides contract services using cells. To achieve further growth, the company plans to focus on the manufacture and sale of its own products and the provision of contract services.
Accumulation and possession of various know-how related to the reagent business: Products in the life sciences sector, especially those related to reagents, require different knowledge and know-how than the import and export of ordinary products. Many of the products handled by the company need to comply with various laws and administrative guidance, such as the Pharmaceutical and Medical Device Act (Act on Securing Quality, Efficacy and Safety of Products Including Pharmaceuticals and Medical Devices), the Poisonous and Deleterious Substances Control Act and the Narcotics and Psychotropics Control Act. These laws vary from country to country, and knowledge and information on the differences between countries are also important. In addition, some reagents are of animal origin and are subject to animal quarantine. Furthermore, some reagents, such as proteins, nucleic acids, and cells, are of biological origins. Appropriate temperature control is required, such as packing dry ice during international transport procedures. The company’s know-how and expertise in these reagents are one of its strengths.
Risk factor
Risks from mergers and acquisitions of suppliers: Of the company’s 600 suppliers, 400 are overseas and are mainly North American suppliers. Management control of these companies could be transferred through mergers and acquisitions, which could result in the company losing its commercial rights in Japan. Alternatively, overseas suppliers could establish their own domestic sales network or switch to a competing trading company.
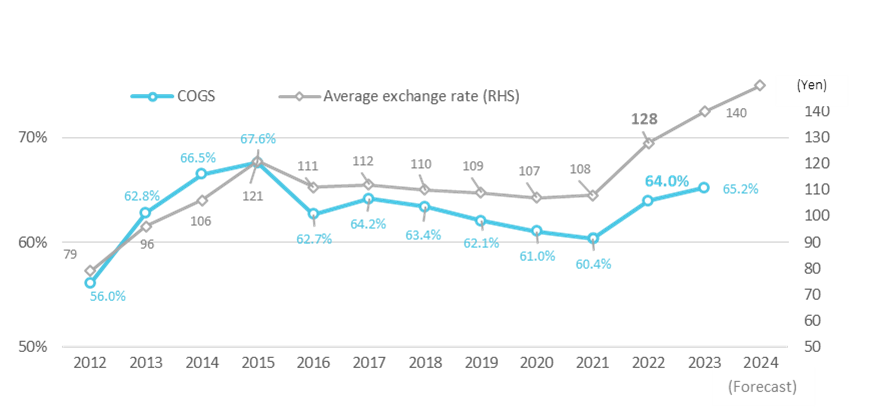
Foreign exchange risk: Most of the company group’s products are imported goods settled in foreign currencies, and the cost of sales rises or falls depending on exchange rate fluctuations. Under its internal policy, the company uses forward exchange contracts within a certain range of actual demand. Still, in the event of a sharp depreciation of the yen, such as from mid-2022 onwards, there will be a delay in the transfer to selling prices, and the cost of sales will rise sharply, which will significantly impact performance. (See diagram below)
Competition risk: Competition within the industry in the domestic market for life science research-related products is also severe.
Regulatory risk: Some of the company’s products must comply with various laws and regulations. An accident or other event that violates these laws and regulations may occur, and if these laws and regulations are amended, a new response will be required.
The Yen-dollar exchange rate and COGS ratio
Source: Omega Investment from company materials
Earnings trend
The company’s long-term financial performance is reviewed. Sales have generally risen steadily due to the steady market expansion mentioned earlier and the company’s precise business development. In terms of profits, the company has been profitable since its establishment, providing investors with some degree of reassurance.
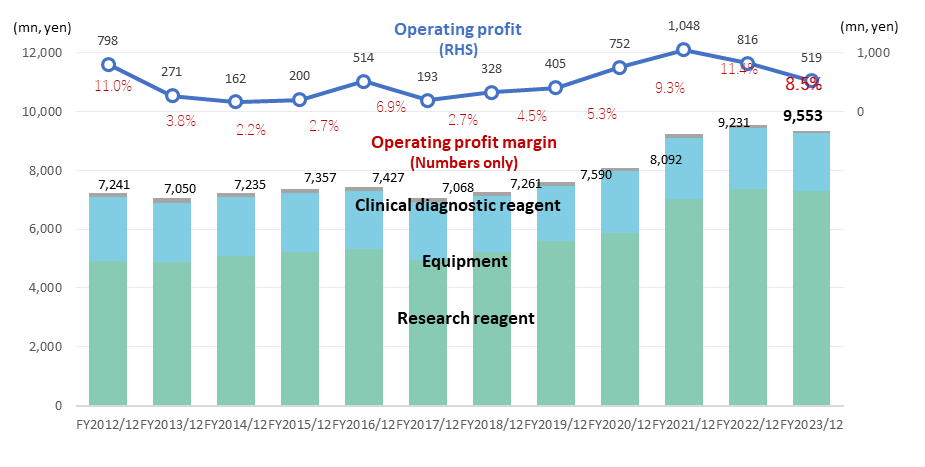
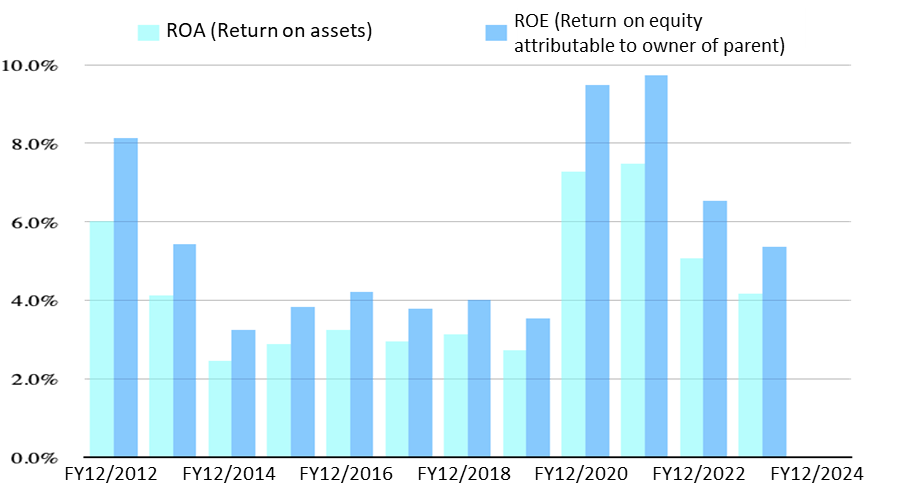
However, the operating profit fluctuated between 100 million yen and 1 billion yen, as shown in the graph below. As mentioned above, the high volume of imported products means that, in some cases, there are advantages to the strong yen and disadvantages to the weak yen, affecting the COGS ratio. SG&A expenses have generally trended lower as sales have grown. Still, the operating profit margin has been affected by fluctuations in the COGS ratio, which has fluctuated between the 2% and 11% range.
As a result, ROA and ROE have also fluctuated widely: while at one time, ROE exceeded 8% and was close to 10%, it has fallen into the low single digits in the last two years. In the long term, ROE has often been below the guideline of 8% in many financial years, and improvements in capital efficiency through upgrading the business structure are awaited. As discussed later, it is hoped that the steady implementation of the Group’s Three-Year Plan, which is currently underway, will increase ROE.
Sales/Profit by Segment
Source: Omega Investment from company materials
ROA/ROE
Source: Omega Investment from company materials
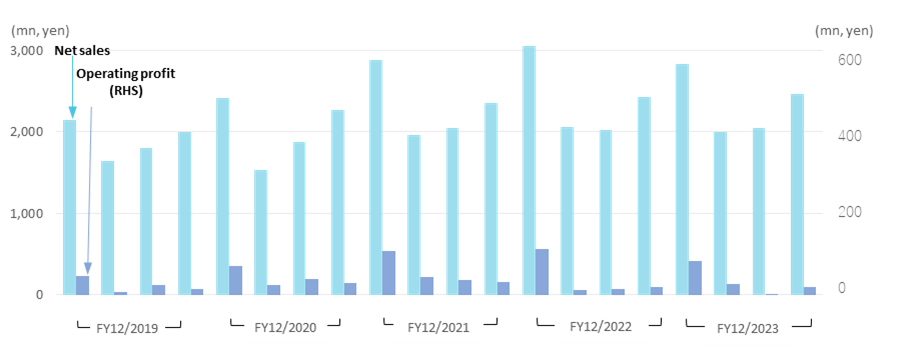
The company’s revenues and profits tend to be weighted towards the January-March period (Q1), as the financial year of many of its customers ends in March.
Sales/Profit by Segment (Quarterly basis)
Source: Omega Investment from company materials
Financial results
1) FY12/2023 financial results: 2.2% decline in revenue and 36.3% decline in operating profit.
For FY12/2023, the company reported sales of 9.34 billion yen (-2.2% YoY), operating profit of 519 million yen (-36.3% YoY) and net profit attributable to owners of parent of 442 million yen (-14.4% YoY).
Sales by product category were 7,299 million yen (-0.9% YoY) for Research reagents, 1,985 million yen (-4.8% YoY) for Equipment and 55 million yen (-45.0% YoY) for Clinical diagnostic reagents, with all categories declining. This was due to sluggish growth in contract service intermediaries included in research reagents, as sales activities had to be curbed in the COVID-19 disaster, and to inventory adjustments on the part of users for consumables included in Equipment.
Despite these challenging sales figures, the strategic businesses of manufacturing and sales and in-house contract services continue to show steady growth. This is a point that should be appreciated.
In terms of profit, the operating profit margin fell to 5.6% (-2.9 percentage points YoY) due to a weaker yen (FY12/2022: 128 Yen/USD, FY12/2023: 140 Yen/USD), which increased the cost of sales ratio, and an increase in SG&A expenses due to more active sales activities.
BS remains healthy. Inventories are slightly down YoY, and the net cash position continues concerning borrowing.
Source: Company materials
2) Forecast for FY12/2024: The company forecasts a 4.9% increase in revenue and a 25.0% decrease in operating profit.
The company’s FY12/2024 forecasts are sales of 9.8 billion yen (+4.9% YoY), operating profit of 390 million yen (-25.0% YoY), net profit attributable to owners of the parent of 310 million yen (-30.0% YoY) and an assumed exchange rate of 150 Yen/USD.
Factors contributing to the forecast of higher sales but lower profits are the deterioration of the COGS due to the assumed weaker yen and the build-up of SGAE for increased staffing and sales and administration. Although the prevailing exchange rate is estimated to have been stronger than this assumption to date, the next results will be the focus of attention as P/L in the first quarter, which has a high weighting in terms of profits, will indicate the direction of the full-year results.
Financial trend
| Unit: mn, yen | FY12/2019 | FY12/2020 | FY12/2021 | FY12/2022 | FY12/2023 | FY12/2024 |
| [Statements of income] | Company forecast | |||||
| Net sales | 7,590 | 8,092 | 9,231 | 9,553 | 9,340 | 9,800 |
| Year-on-year basis | 4.5% | 6.6% | 14.1% | 3.5% | -2.2% | 4.9% |
| Research reagent | 5,613 | 5,872 | 7,035 | 7,365 | 7,299 | |
| Equipment | 1,836 | 2,099 | 2,075 | 2,086 | 1,985 | |
| Clinical diagnostic reagent | 140 | 119 | 120 | 101 | 55 | |
| Gross profit | 2,879 | 3,152 | 3,658 | 3,440 | 3,249 | |
| SG&A expenses | 2,474 | 2,399 | 2,609 | 2,624 | 2,729 | |
| Operating profit | 405 | 752 | 1,048 | 816 | 519 | 390 |
| Year-on-year basis | 23.5% | 85.7% | 39.4% | -22.2% | -36.3% | -25.0% |
| Operating profit margin | 5.3% | 9.3% | 11.4% | 8.5% | 5.6% | 4.0% |
| Ordinary Profit | 470 | 817 | 1,099 | 790 | 653 | 450 |
| Net profit | 237 | 674 | 737 | 517 | 442 | 310 |
| Year-on-year basis | -8.8% | 184.4% | 9.3% | -29.9% | -14.4% | -30.0% |
| Net profit ratio | 3.1% | 8.3% | 8.0% | 5.4% | 4.7% | 3.2% |
| [Balance Sheets] | ||||||
| Current assets | 5,927 | 6,756 | 7,310 | 7,136 | 7,102 | |
| Cash equivalents and short-term securities | 2,516 | 3,259 | 3,555 | 3,036 | 3,025 | |
| Non-current assets | 2,962 | 2,883 | 2,761 | 3,176 | 3,770 | |
| Total assets | 8,890 | 9,640 | 10,072 | 10,313 | 10,872 | |
| Current liabilities | 987 | 1,226 | 1,093 | 1,038 | 1,123 | |
| Short-term borrowings | 20 | 20 | 20 | 20 | 20 | |
| Non-current liabilities | 581 | 552 | 658 | 656 | 722 | |
| Total liabilities | 1,568 | 1,779 | 1,752 | 1,695 | 1,846 | |
| Total net assets | 7,321 | 7,861 | 8,319 | 8,617 | 9,026 | |
| Shareholders’ equity | 6,843 | 7,358 | 7,787 | 8,052 | 8,443 | |
| Total liabilities and net assets | 8,890 | 9,640 | 10,072 | 10,313 | 10,872 | |
| (Shareholders’ equity ratio) | 77.0% | 76.3% | 77.3% | 78.1% | 77.7% | |
| [Statements of cash flows] | ||||||
| Cash flow from operating activities | 549 | 803 | 648 | 284 | 736 | |
| Cash flow from investing activities | -115 | 42 | -145 | -291 | -758 | |
| Cash flow from financing activities | -85 | -97 | -420 | -236 | -201 | |
| Free cash flow | 434 | 845 | 503 | -7 | -22 | |
| [Per share] Unit: yen | ||||||
| Profit attributable to owner of parent | 40 | 114 | 127 | 89 | 76 | 53 |
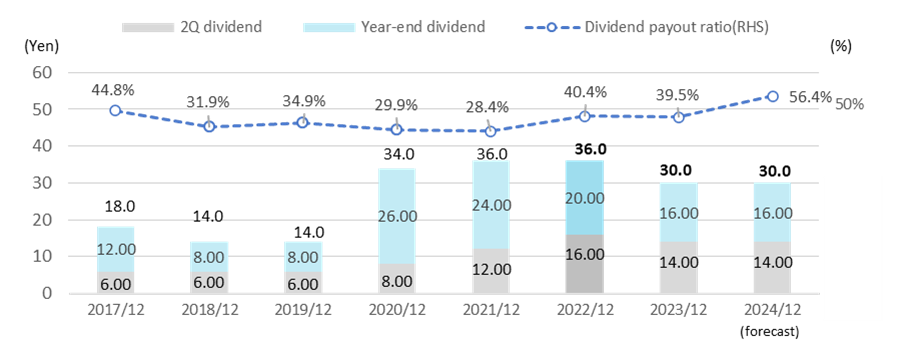
| Annual dividend per share | 14 | 34 | 36 | 36 | 30 | 30 |
| Book value per share | 1,154 | 1,241 | 1,344 | 1,385 | 1,447 | |
| Consolidated dividend payout ratio | 35% | 30% | 28% | 40% | 39% | 56% |
| [Financial indicators] | ||||||
| ROA (Return on assets) | 2.7% | 7.3% | 7.5% | 5.1% | 4.2% | |
| ROE (Return on equity attributable to owner of parent) | 3.5% | 9.5% | 9.7% | 6.5% | 5.4% | |
| [Exchange rate] | ||||||
| Yen/USD | 109 | 107 | 108 | 128 | 140 | 150 |
Growth strategy
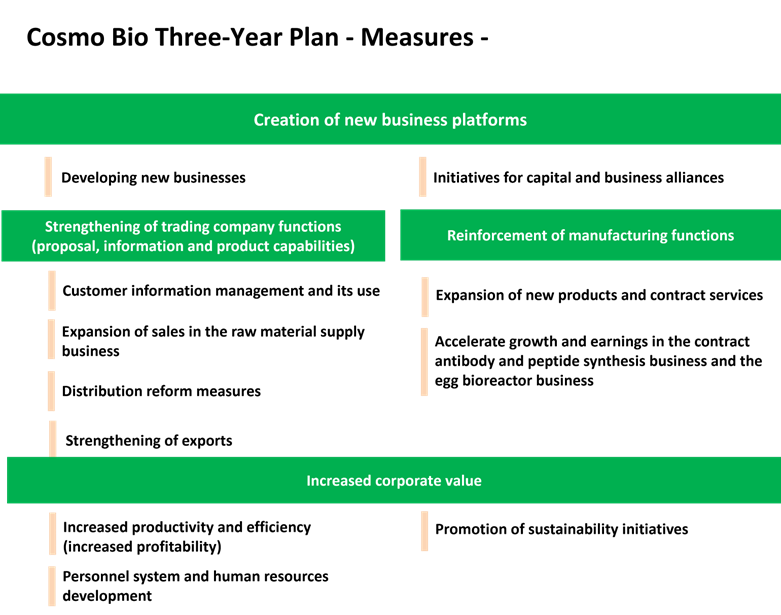
1) New Three-Year Plan (2023-2025): “Contribute to the advancement of life sciences” as the Group’s objective
The company announced its new three-year plan (FY12/2023-2025) in conjunction with its FY12/2022 results.
The plan sets out the group’s objective “to contribute to the advancement of life science”, as well as the group’s philosophy and policies. The specific long-term strategies are: 1) to create products and services that will become new pillars of growth; 2) to enter non-research markets with a focus on life sciences; 3) to strengthen synergies between group companies; 4) to expand overseas operations, including export business; and 5) to achieve stable and sustainable growth.
Source: Company materials
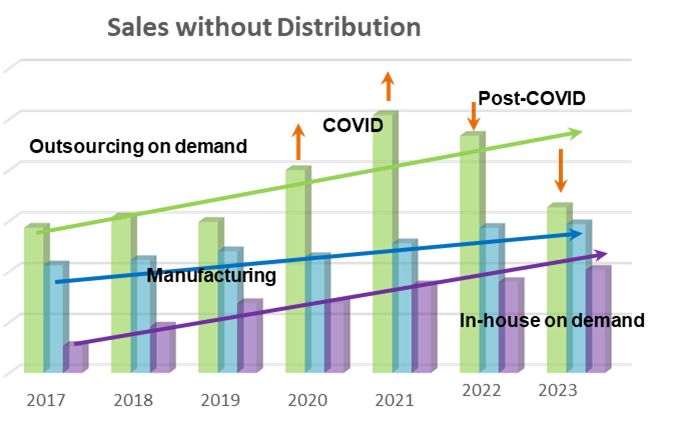
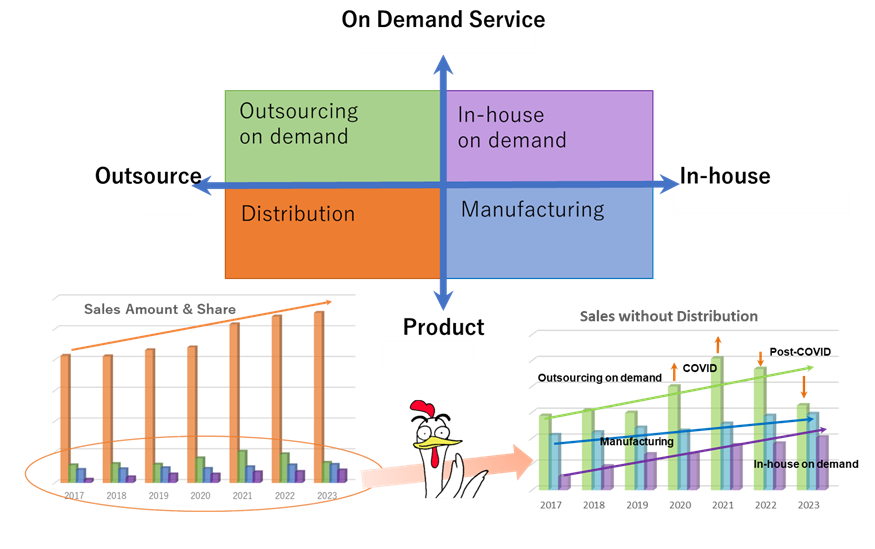
The company’s business matrix is shown on the next page. The trading company function in the lower left orange quadrant, ‘Purchasing and Sales’, has been the company’s main business to date and has shown a steady increase in revenue. The trading company function is a stable business, but it is a so-called margin business with limited profitability and is easily affected by currency fluctuations.
On the other hand, businesses related to the manufacturing function on the right require upfront investment. Still, once sales cross the break-even point, they can expect higher marginal profits than the trading company business and can also expect to expand their sales channels, including overseas.
Currently, most sales are related to the trading company function (purchasing and sales). Still, the other quadrants of the matrix – contract service intermediary, manufacturing and sales, and in-house contract services – are generally on a growth trajectory. In particular, if the manufacturing function increases, the company’s profitability is expected to increase in both size and quality through increased revenues, improved profit margins and reduced foreign exchange risks.
This could lead to an improvement in ROE and a higher share price valuation, although this is not explicitly affirmed in the medium-term plan. The stock market is likely to pay close attention to whether the business restructuring is progressing as envisaged and whether this can be realised in earnings.
Cosmo Bio’s business overview and performance
Source: Company materials
2) Progress in strengthening manufacturing functions
Since 2006, the company has steadily strengthened its manufacturing and development functions based at its Sapporo Plant. Initially, the company started with reagent production and contract testing, including primary cultured cells. Since 2016, it has been developing custom peptide synthesis, contract antibody production, and protein production using genome-edited chickens (egg bioreactor business).
The following table summarises an overview of each business and its aims. As can be seen here, the company is developing its manufacturing business to broaden its base and is awaiting a full-scale take-off.
In FY2023, progress was made in the joint development of a substrate for immobilising biological samples with Gellycle Co., Ltd. and its exclusive sale as a research reagent in Japan, the commercialisation of ubiquitin detection reagents, and the transfer of the manufacturing and marketing rights for research reagent products from Kyowa Pharma Medical and the commencement of in-house production.
Overview |
Aims |
|
①Primary cell and other reagent production and contract testing |
Cells are isolated from living organisms and cultured until the first passaging (primary cells) is provided. Customers can conduct drug research and development using cells close to actual cells. |
Provide reagents and services not available on the market ⇒ Enhanced research reagents and services |
②Custom peptide synthesis and antibody production |
Custom synthesis of peptides with sequences that meet researchers’ requirements and contract antibody production using these peptides as materials (antigens) are also offered. |
While providing peptides for research use, we also offer production and services that go one step beyond research use, such as supplying peptides as raw materials. |
③Protein production using genome-edited chickens (egg bioreactor project). |
Technology that modifies chickens through genome editing to produce eggs containing large amounts of useful proteins in the egg white part of the egg. Produces the desired protein in large quantities at low cost. |
Production is mainly aimed at supplying raw materials, not research reagents. |
Source: Omega Investment from company materials
3) Strengthening the trading company function
The company plans to launch the contract service matching website Scientist3 in the spring of 2024 or later to strengthen the contract service intermediary part of the trading company function. The site matches life science researchers with suppliers of contract services in Japan and overseas and is likely to start contributing to profits from FY2025 onwards. The service is expected to be easy to use, with everything from enquiries to ordering completed online and the company’s experienced staff supporting the flow of goods. Although the risk of cannibalisation needs to be considered, it could become an efficient and attractive business for the company.
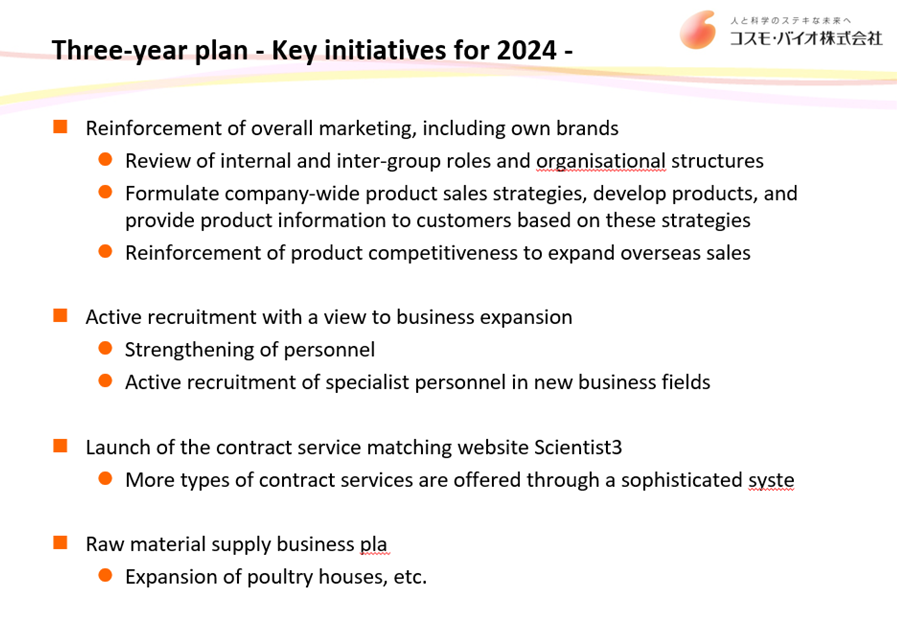
4) Key initiatives for FY2024
The initiatives for FY2024 are as follows.
The company is aware that it is “ready” to upgrade its business structure by strengthening its trading company functions and expanding its manufacturing functions and intends to focus on investment activities. It will be interesting to see whether the foundations for the next medium-term plan will be firmly laid.
Source: Company materials
Share price trends and catalysts
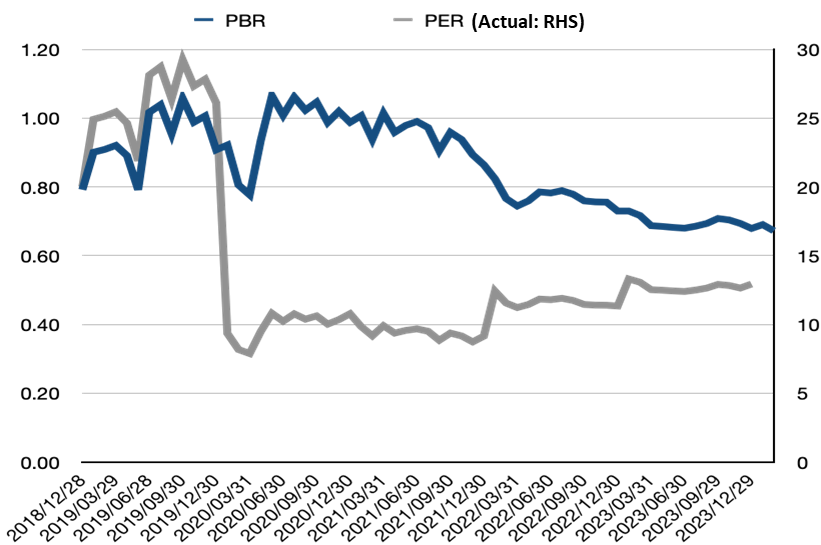
The company’s share price has generally been in the range of JPY 900 to 1,300 yen for the past five years. In the past year, the share price has remained stable at around JPY 1,000. The company’s share price valuation is low at a forecast PER of 18.5x for FY12/2024 and PBR of 0.68x and is felt to be not overdone.
On the other hand, the company’s share price relative to TOPIX has been on a downtrend for the past three years. In other words, the company’s share price has lagged behind the recent rally in the Tokyo stock market.
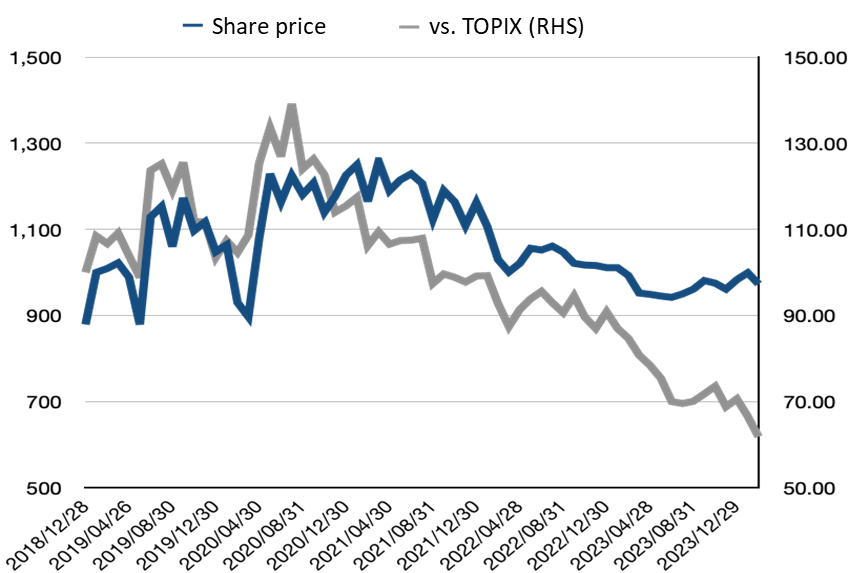
The reasons for the share price lagging the stock market are that most of the company’s business is dependent on import sales to domestic customers, yen depreciation makes the company difficult to secure profit margins, ROE is on a downward trend against a background of these factors and is below the 8% mark, which is seen as the threshold for a listed company. Another factor is that the company’s forecast for December 2024 is a decrease in profits.
Entering 2024, Mr Norihiko Shibayama will assume the position of President and Representative Director from Senior Managing Director and Acting President and CEO of Operations. Although this does not constitute a change of line in practical terms, it is considered an opportunity to give impetus to the company’s structural reforms.
In the short term, the share price catalysts include (1) a path for the current performance trend to return to higher sales and profits and (2) effective management of foreign exchange risks. On the other hand, from a medium-term perspective, the catalysts include (3) the establishment of a foundation for growth in the manufacturing function and contract service intermediation and (4) the direction of the next medium-term plan’s framework and numerical targets (with a particular focus on capital efficiency and specific measures to improve PBR).
Although still difficult to see from a numerical perspective, the impression is that the company has taken the steps it needs to take to reform its business structure. The company will soon reach such an inflexion point, where it can shift up the scale of its business and see capital efficiency by utilising its strong financial base and allocating more than enough funds to strategic businesses with good returns on investment. This would also bring diversification of the shareholder structure and improved share liquidity.
Financial data
Unit: mn, yen |
2012/12 |
2013/12 |
2014/12 |
2015/12 |
2016/12 |
2017/12 |
2018/12 |
2019/12 |
2020/12 |
2021/12 |
2022/12 |
2023/12 |
2024/12 |
[Statements of income] |
Company
|
||||||||||||
Net sales |
7,241 |
7,050 |
7,235 |
7,357 |
7,427 |
7,068 |
7,261 |
7,590 |
8,092 |
9,231 |
9,553 |
9,340 |
9,800 |
Year-on-year basis |
0.7% |
-2.6% |
2.6% |
1.7% |
1.0% |
-4.8% |
2.7% |
4.5% |
6.6% |
14.1% |
3.5% |
-2.2% |
4.9% |
Cost of sales |
4,057 |
4,429 |
4,811 |
4,976 |
4,655 |
4,535 |
4,602 |
4,710 |
4,940 |
5,572 |
6,112 |
6,090 |
|
Gross profit |
3,184 |
2,620 |
2,424 |
2,380 |
2,772 |
2,532 |
2,659 |
2,879 |
3,152 |
3,658 |
3,440 |
3,249 |
|
SG&A expenses |
2,386 |
2,349 |
2,261 |
2,180 |
2,257 |
2,339 |
2,330 |
2,474 |
2,399 |
2,609 |
2,624 |
2,729 |
|
Operating profit |
798 |
271 |
162 |
200 |
514 |
193 |
328 |
405 |
752 |
1,048 |
816 |
519 |
390 |
Year-on-year basis |
-10.4% |
-66.0% |
-40.2% |
23.5% |
157.0% |
-62.5% |
69.9% |
23.5% |
85.7% |
39.4% |
-22.2% |
-36.3% |
-25.0% |
Operating profit margin |
11.0% |
3.8% |
2.2% |
2.7% |
6.9% |
2.7% |
4.5% |
5.3% |
9.3% |
11.4% |
8.5% |
5.6% |
4.0% |
Non-operating profit |
46 |
177 |
128 |
175 |
21 |
208 |
89 |
72 |
71 |
71 |
57 |
136 |
|
Non-operating expenses |
43 |
3 |
5 |
2 |
51 |
3 |
13 |
7 |
6 |
20 |
83 |
2 |
|
Ordinary Profit |
801 |
444 |
285 |
373 |
483 |
397 |
403 |
470 |
817 |
1,099 |
790 |
653 |
450 |
Extraordinary profit |
3 |
9 |
46 |
34 |
55 |
8 |
190 |
||||||
Extraordinary expenses |
30 |
2 |
1 |
0 |
82 |
5 |
81 |
||||||
Income before income taxes |
774 |
451 |
330 |
407 |
456 |
400 |
403 |
388 |
1,008 |
1,099 |
790 |
653 |
|
Total income taxes |
336 |
137 |
131 |
158 |
180 |
148 |
126 |
142 |
307 |
331 |
238 |
191 |
|
Net profit |
411 |
313 |
201 |
230 |
254 |
237 |
260 |
237 |
674 |
737 |
517 |
442 |
310 |
Year-on-year basis |
-10.3% |
-23.8% |
-35.8% |
14.4% |
10.4% |
-6.7% |
9.7% |
-8.8% |
184.4% |
9.3% |
-29.9% |
-14.4% |
-30.0% |
Net profit ratio |
5.7% |
4.4% |
2.8% |
3.1% |
3.4% |
3.4% |
3.6% |
3.1% |
8.3% |
8.0% |
5.4% |
4.7% |
3.2% |
[Balance Sheets] |
|||||||||||||
Current assets |
5,413 |
5,527 |
5,234 |
5,266 |
5,495 |
5,143 |
5,668 |
5,927 |
6,756 |
7,310 |
7,136 |
7,102 |
|
Cash equivalents and short-term securities |
2,143 |
2,036 |
1,482 |
1,498 |
1,948 |
1,483 |
2,268 |
2,516 |
3,259 |
3,555 |
3,036 |
3,025 |
|
Non-current assets |
1,541 |
2,750 |
2,927 |
2,523 |
2,438 |
2,982 |
2,832 |
2,962 |
2,883 |
2,761 |
3,176 |
3,770 |
|
Property, plant and equipment |
178 |
185 |
213 |
227 |
319 |
690 |
636 |
695 |
636 |
599 |
577 |
572 |
|
Investments and other assets |
1,201 |
2,456 |
2,613 |
2,071 |
1,842 |
2,041 |
1,943 |
2,068 |
2,081 |
1,979 |
2,428 |
3,042 |
|
Total assets |
6,955 |
8,277 |
8,161 |
7,790 |
7,934 |
8,126 |
8,501 |
8,890 |
9,640 |
10,072 |
10,313 |
10,872 |
|
Current liabilities |
916 |
818 |
1,130 |
1,017 |
916 |
799 |
945 |
987 |
1,226 |
1,093 |
1,038 |
1,123 |
|
Short-term borrowings |
20 |
20 |
20 |
20 |
20 |
20 |
20 |
20 |
20 |
20 |
20 |
20 |
|
Non-current liabilities |
317 |
660 |
497 |
394 |
436 |
488 |
502 |
581 |
552 |
658 |
656 |
722 |
|
Total liabilities |
1,234 |
1,479 |
1,628 |
1,412 |
1,352 |
1,288 |
1,448 |
1,568 |
1,779 |
1,752 |
1,695 |
1,846 |
|
Total net assets |
5,720 |
6,797 |
6,532 |
6,378 |
6,581 |
6,838 |
7,053 |
7,321 |
7,861 |
8,319 |
8,617 |
9,026 |
|
Shareholders’ equity |
5,230 |
6,311 |
6,050 |
5,951 |
6,135 |
6,381 |
6,581 |
6,843 |
7,358 |
7,787 |
8,052 |
8,443 |
|
Share capital |
918 |
918 |
918 |
918 |
918 |
918 |
918 |
918 |
918 |
918 |
918 |
918 |
|
Capital surplus |
1,221 |
1,221 |
1,221 |
1,251 |
1,251 |
1,251 |
1,251 |
1,251 |
1,251 |
1,258 |
1,260 |
1,261 |
|
Retained earnings |
3,119 |
3,314 |
3,397 |
3,521 |
3,680 |
3,812 |
4,026 |
4,181 |
4,761 |
5,274 |
5,560 |
5,805 |
|
Treasury shares |
-67 |
-67 |
-67 |
-67 |
-67 |
-67 |
-67 |
-67 |
-67 |
-239 |
-216 |
-194 |
|
Valuation/exchange differences |
37 |
924 |
579 |
327 |
352 |
466 |
451 |
558 |
494 |
574 |
530 |
654 |
|
Total liabilities and net assets |
6,955 |
8,277 |
8,161 |
7,790 |
7,934 |
8,126 |
8,501 |
8,890 |
9,640 |
10,072 |
10,313 |
10,872 |
|
(Shareholders’ equity ratio) |
75.2% |
76.2% |
74.1% |
76.4% |
77.3% |
78.5% |
77.4% |
77.0% |
76.3% |
77.3% |
78.1% |
77.7% |
|
[Statements of cash flows] |
|||||||||||||
Cash flow from operating activities |
347 |
126 |
297 |
129 |
573 |
89 |
908 |
549 |
803 |
648 |
284 |
736 |
|
Cash flow from investing activities |
-167 |
-99 |
-227 |
-263 |
99 |
-235 |
-185 |
-115 |
42 |
-145 |
-291 |
-758 |
|
Cash flow from financing activities |
-126 |
-126 |
-122 |
-151 |
-107 |
-109 |
-85 |
-85 |
-97 |
-420 |
-236 |
-201 |
|
Net increase in cash and cash equiv. |
61 |
-97 |
-52 |
-285 |
549 |
-264 |
684 |
348 |
743 |
95 |
-218 |
-210 |
|
Cash and cash equiv. at beginning of period |
1,471 |
1,532 |
1,435 |
1,383 |
1,098 |
1,648 |
1,383 |
2,068 |
2,416 |
3,159 |
3,255 |
3,036 |
|
Cash and cash equiv. at end of period |
1,532 |
1,435 |
1,383 |
1,098 |
1,648 |
1,383 |
2,068 |
2,416 |
3,159 |
3,255 |
3,036 |
2,826 |
|
Free cash flow |
180 |
27 |
70 |
-134 |
672 |
-146 |
723 |
434 |
845 |
503 |
-7 |
-22 |
Company data
Company Profile
Sales by product category
Cosmo Bio Co., Ltd.
【Head Office】
Toyo-Ekimae Bldg., 2-20, Toyo 2-chome
Koto-ku, Tokyo 135-0016
【Sapporo Office】
3-513-2, Zenibako, Otaru City, Hokkaido
【Shinsuna logistics centre】
12-39, Shinsuna, Koto-ku, Tokyo
3F, Building B, Warehouse No. 3, Shinsuna, Nippon Express Co.
Number of Employees :155 (Consolidated; as of Dec.31, 2023)
History
| Month/Year | Event |
|---|---|
| Aug. 1983 | Maruzen Oil Biochemicals Co. Ltd. was established as a subsidiary of Maruzen Oil (now Cosmo Oil Co., Ltd.) in Minato-ku, Tokyo, for the purpose of marketing basic biotechnology research reagents. |
| Apr. 1986 | Company name changed to Cosmo Bio Ltd. and sales of bio-research equipment begun. |
| Dec. 1986 | Licensed to sell medicines |
| Apr. 1998 | Establishment of wholly-owned subsidiary CB Development Co., Ltd. to search for suppliers. |
| Sep. 2000 | Independence from Cosmo Oil through a management buyout (MBO). CB Development Co., Ltd. became a non-subsidiary company through a share transfer. |
| Dec. 2000 | Absorption merger of CB Development Co., Ltd. |
| Aug. 2004 | Establishment of wholly-owned subsidiary Cosmo Bio USA Inc. in San Diego, California, USA, to search for suppliers and promote exports. |
| Sep. 2005 | Listed on the JASDAQ stock exchange. |
| Dec. 2006 | Acquired 80% of the shares of Primary Cell Co., Ltd., a company engaged in the research, development, manufacture and sale of primary cultured cells (primary cells) and contract analysis using these cells, and made it a subsidiary. |
| Nov. 2007 | Acquired 30% of the outstanding shares of BM Equipment Co., Ltd., an importer and distributor of consumables and equipment for bio-research, and made it an equity-accounted affiliate. |
| Jul. 2008 | Primary Cell Co., Ltd., a consolidated subsidiary, became a wholly owned subsidiary. |
| Mar. 2010 | Acquired an additional 33% of the outstanding shares of BM Equipment Co., Ltd., making it a consolidated subsidiary with a total shareholding of approximately 63%. |
| Jan. 2013 | Relocated the distribution centre and started operation at the Shinsuna Logistics Centre. |
| Jul. 2013 | Merged with Primary Cell Co., Ltd. |
| Jul. 2013 | Listed on the JASDAQ (Standard) of the Tokyo Stock Exchange following the merger of the Tokyo Stock Exchange and the Osaka Securities Exchange. |
| Nov. 2016 | Established a joint venture Proteintech Japan Co., Ltd. with Proteintech Group, Inc. |
| Oct. 2017 | Relocated and consolidated Sapporo business facilities and opened the Sapporo Site. |
| Jan. 2018 | Cosmo Bio USA, became a consolidated subsidiary. |
| Mar. 2022 | Transition to a company with an audit committee |
| Apr. 2022 | Listed on the TSE Standard following the reorganisation of the Tokyo Stock Exchange. |
Top management
President: Norihiko Shibayama
Apr. 1994 Joined Maruzen Petrochemical Co., Ltd.
Oct. 2000 Joined the Company
Apr. 2012 General Manager, Information Systems Department
Mar. 2014 Director, BM Equipment Co., Ltd.
Nov. 2016 General Manager of General Affairs Department and General Manager of the Information Systems Department
Mar. 2017 Director and General Manager of the General Affairs Department and Information Systems Department
Mar. 2020 Managing Director and General Manager of the General Affairs Department and Information Systems Department
Director and General Manager of General Affairs Department, BM Equipment Co., Ltd.
Mar. 2022 President and Representative Director of BM Equipment Co., Ltd. (to present)
Apr. 2022 Managing Director and General Manager of the General Affairs Department
Mar. 2023 Senior Managing Director and General Manager of the General Affairs Department
Nov. 2023 Representative Director, Senior Managing Director and General Manager of the General Affairs Department of the company, acting for the President and CEO
Mar. 2024 Representative Director and President (to present)
Managing Director : Junko Tochigi
Apr. 1998 Joined the Company
Apr. 2013 Head of Product Communications Department
Mar. 2017 Director and Head of Product Communications Department
Apr. 2017 Director and Head of Corporate Planning Department
Mar. 2021 Director, BM Equipment Co., Ltd
Mar. 2022 President and Representative Director, Cosmo Bio USA, Inc. (to present), Representative Director, Proteintech Japan Co., Ltd. (to present)
Mar. 2023 Managing director and Head of Corporate Planning Department (to present)
Director : Masanori Hayashi
Apr. 1994 Joined Kyowa Hakko Kogyo Co., Ltd.
May. 2012 Joined the Company
Apr. 2019 Head of Finance Department
Mar. 2022 General Manager, Finance Department, BM Equipment Co., Ltd (to present)
Mar. 2023 Director and Head of Finance Department (to present)
Director, Full-time Audit and Supervisory Committee:Kazutoshi Sato
Apr. 1987 Joined Sumitomo Real Estate Sales Co., Ltd.
Jan. 1993 Joined Cosmo Oil Co., Ltd.
Jun. 2011 Branch Manager, Sapporo Branch, Cosmo Oil Co., Ltd.
Jun. 2014 Branch Manager, Takamatsu Branch, Cosmo Oil Co., Ltd.
Oct. 2015 Cosmo Oil Marketing (Japan) Co., Ltd., Takamatsu Branch Branch manager
Jun. 2017 Director, Executive Officer and General Manager, General Affairs Department, Maruzen Petrochemical Co., Ltd.
Mar. 2020 Outside auditor of the company Auditor of BM Equipment Co., Ltd. (present post)Mar. 2022 Director and full-time audit committee member (to present)
Director, Audit and Supervisory Committee Member:Haruo Sasaki
Nov. 1974 Joined Chuo Audit Corporation
Feb. 1990 Established Sasaki Accounting Office, Director (to present)
Dec. 2000 Outside auditor of the Company
Mar. 2022 Director and Audit Committee member (to present)
Director, Audit and Supervisory Committee Member:Kazuya Shimamura
Oct. 1995 Joined Deloitte Touche Tohmatsu (now Deloitte Touche Tohmatsu LLC)
Apr. 1998 Registered as a chartered accountant
Oct. 2004 Registered as a lawyer Joined Abe, Ikubo & Katayama Law Office
Mar. 2008 Established Shimamura Law & Accounting Office,Representative (to present)
Mar. 2014 Outside director of the Company
Mar. 2022 Director and Audit Committee member (to present)
Director, Audit and Supervisory Committee Member:Junichiro Haraguchi
Apr. 1984 Joined Tokyo Small and Medium Business Investment & Consultation Co., Ltd.
Apr. 2017 Counsellor, Acting Chief Examiner, Tokyo Small and Medium Business Investment & Consultation Co., Ltd.
Oct. 2020 Acting Director of Tokyo Small and Medium Business Investment & Consultation Co., Ltd.
Apr. 2021 Specially Appointed Counsellor (Operations Department 5 and Sales Management Department), Tokyo Small and Medium Business Investment & Consultation Co., Ltd.
Apr. 2023 Specially Appointed Counsellor (Operations Department 5 and Business Management Department), Tokyo Small and Medium Business Investment & Consultation Co., Ltd. (to present)
Mar. 2024 Director and Audit Committee member of the Company (to present)
Mr
Mr Norihiko Shibayama was appointed representative director on 26 March 2024, and Mr Haruhisa Sakurai, who has served as representative director, was appointed adviser.
Skills matrix of the Board of Directors’ Members
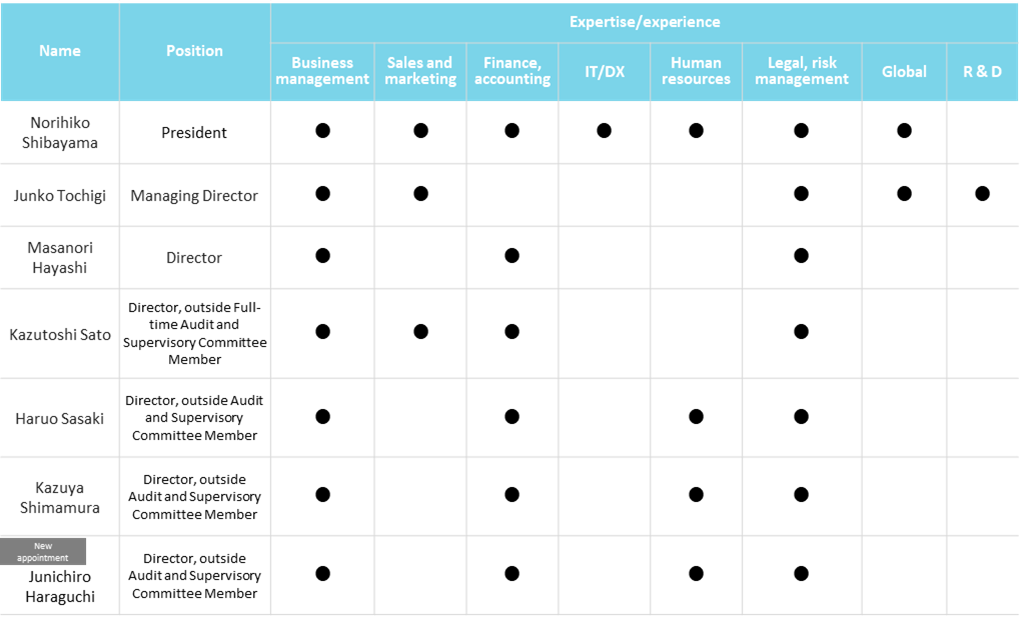
Source: Company materials
Corporate governance structure
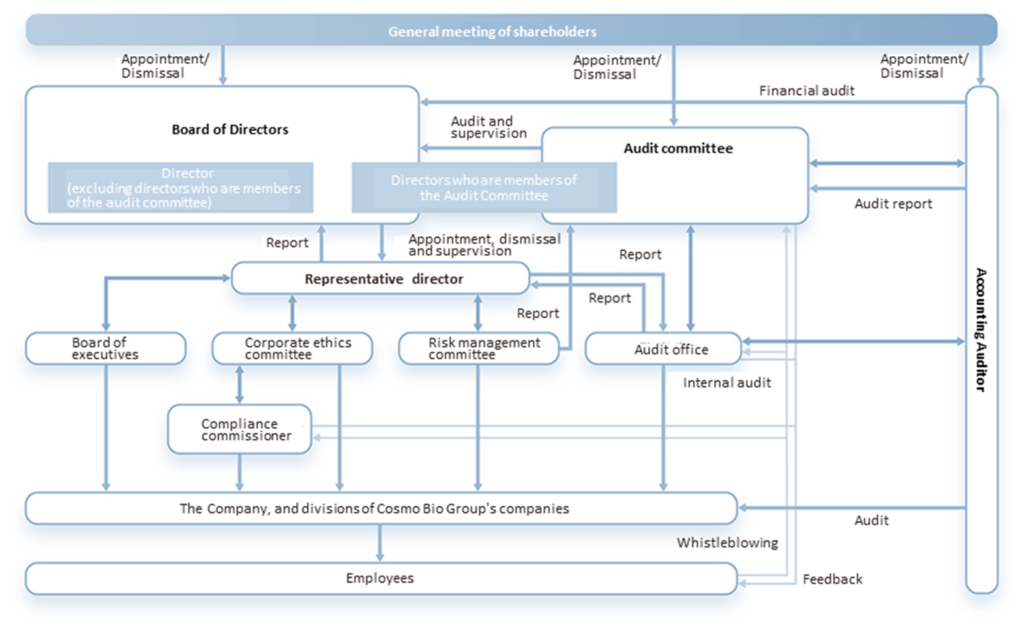
Source: Omega Investment from company materials
Major shareholders
| Name | Number of shares owned |
Ratio of the number of shares owned to the total number of issued shares (%) |
| Tokyo Small and Medium Business Investment & Consultation Co., Ltd. | 1,152,000 | 19.74 |
| Mizuho Trust & Banking Corporation Cosmo Oil Co., Ltd. Pension Fund. Re-trustee Custody Bank of Japan, Ltd. |
576,000 | 9.87 |
| Hikari Tsushin, Inc. | 435,900 | 7.46 |
| UH Partners 2, Inc. | 184,600 | 3.16 |
| Cosmo Bio Employee Stock Ownership Plan | 128,100 | 2.19 |
| Yumiko Suzuki | 82,300 | 1.41 |
| Shoichi Matsunami | 76,000 | 1.30 |
| Toshiaki Funato | 75,400 | 1.29 |
| Harada, Masanori | 69,000 | 1.18 |
| Haruhisa Sakurai | 61,900 | 1.06 |
| Total | 2,756,200 | 47.47 |
Note: The percentage of shares held to the total number of shares issued (%) excludes treasury shares (212,633 shares).
Source: Omega Investment from company materials
Shareholding by ownership (As of 31, December, 2023)
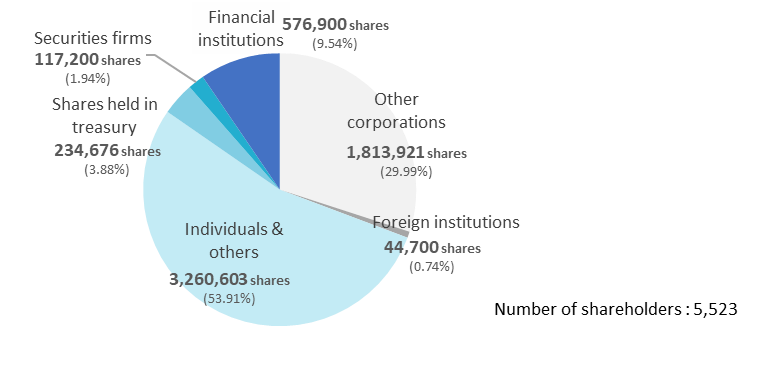
Source: Omega Investment from company materials
Shareholder return policy
Dividends
Source: Omega Investment from company materials