2026-07-27
Home
Japanese

Omega Investment Co., Ltd.
Hamee (Company note – 3Q update)

| Share price (4/8) | ¥1,175 | Dividend Yield (24/4 CE) | 1.9 % |
| 52weeks high/low | ¥1,355 / 987 | ROE(23/4) | 11.1 % |
| Avg Vol (3 month) | 107 thou shrs | Operating margin (23/4) | 9.1 % |
| Market Cap | ¥19.1 bn | Beta (5Y Monthly) | 1.7 |
| Enterprise Value | ¥18.4 bn | Shares Outstanding | 15.9 mn shrs |
| PER (24/4 CE) | 18.2 X | Listed market | TSE Standard |
| PBR (23/4 act) | 2.1 X |
| Click here for the PDF version of this page |
| PDF Version |
Q3 FY04/2024 (Nov 2023 – Jan 2024) results show YoY growth in revenues and profits.
Summary
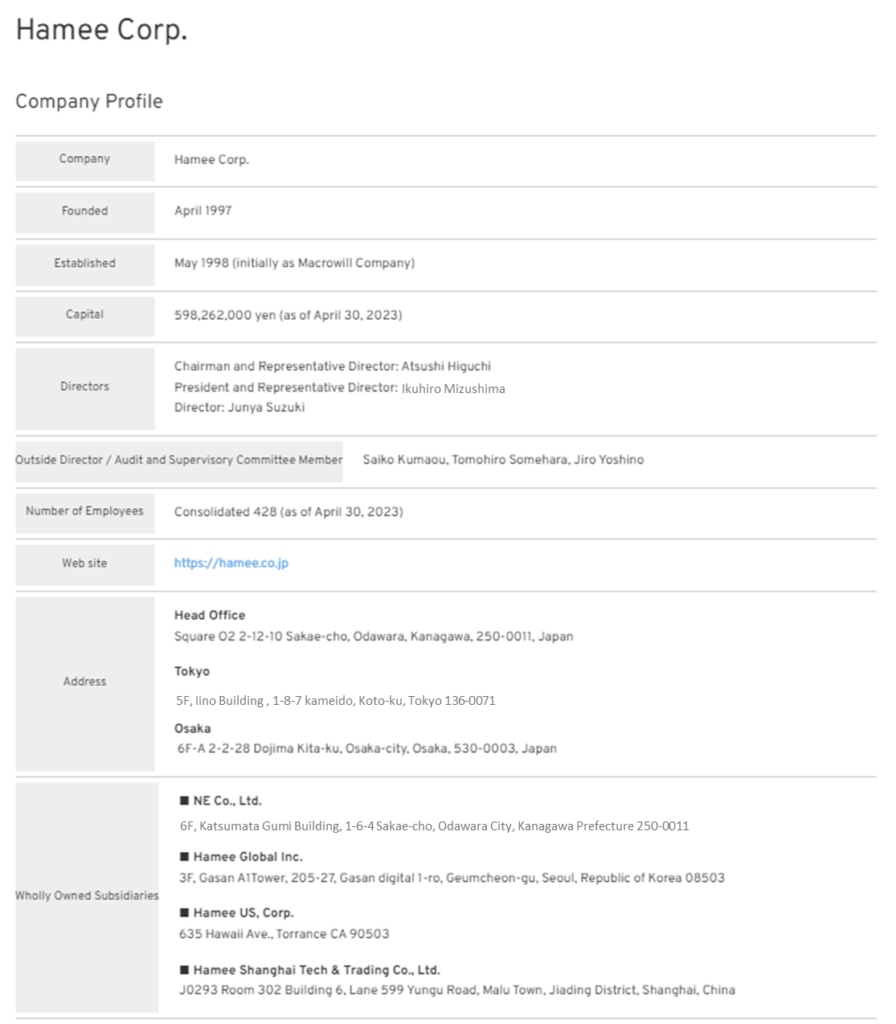
Company profile
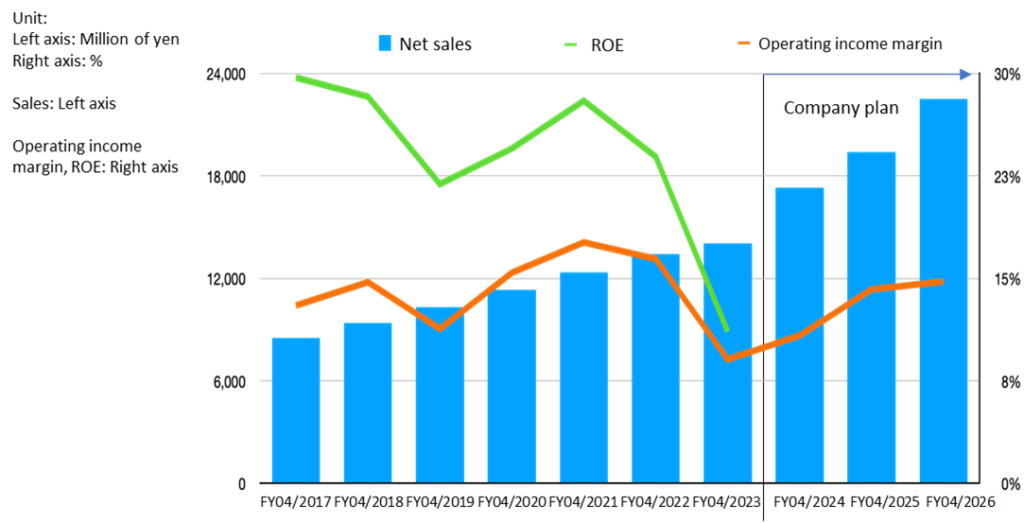
◇Hamee Corp. was founded in 1997, went public on TSE Mothers in 2015, and is currently listed on the Standard Market. The company spin-off and operates ‘Commerce Business’ and ‘Platform Business’, both of which are profitable. In FY04/2023, the company reported consolidated net sales of JPY 14 billion, operating income of JPY 1.3 billion, total assets of JPY 12.3 billion, net assets of JPY 9 billion, and 428 employees. The Mid-Term Management Plan announced in June 2023 aims for net sales of JPY 22.5 billion and operating income of JPY 3.3 billion in FY04/2026.
◇‘Commerce Business’: Net sales of JPY 10.7 billion and segment profit of JPY 700 million for the full year ending April 2023. In addition to the Mobile Life Business, where the iFace series of in-house designed products is gaining recognition, particularly among young people, through product planning, development and manufacture of mobile accessories, e-commerce sales and wholesale to mass retailers, etc., the business is also expanding into the Gaming Accessories Business, Cosmetics Business (ByUR brand) and Global Business. The results of these efforts are beginning to become apparent in earnings.
◇‘Platform Business’: Developed ’NextEngine’, a cloud (SaaS) EC Attractions for internet retailers that automates operations related to online shop operations and centrally manages order processing and inventory status for multiple shops across malls, and is provided to more than 6,000 clients, mainly medium-sized businesses. With net sales of JPY 3.4 billion and segment profit of JPY 1.5 billion in FY04/2023, the business is on track for steady growth in sales and profit and is expected to benefit from the expansion of the EC market in the future.
◇Reorganisation: a share-distribution-type spin-off of NE Inc., the Platform Business, is planned for 2025, and NE Inc. will be listed on the stock exchange. Current shareholders of the company will become shareholders of two listed companies in the future, the company and NE Inc. The aim is to reflect the potential of the two businesses in the current share price in an appropriate and timely manner.
Q3 FY04/2024 update and highlights
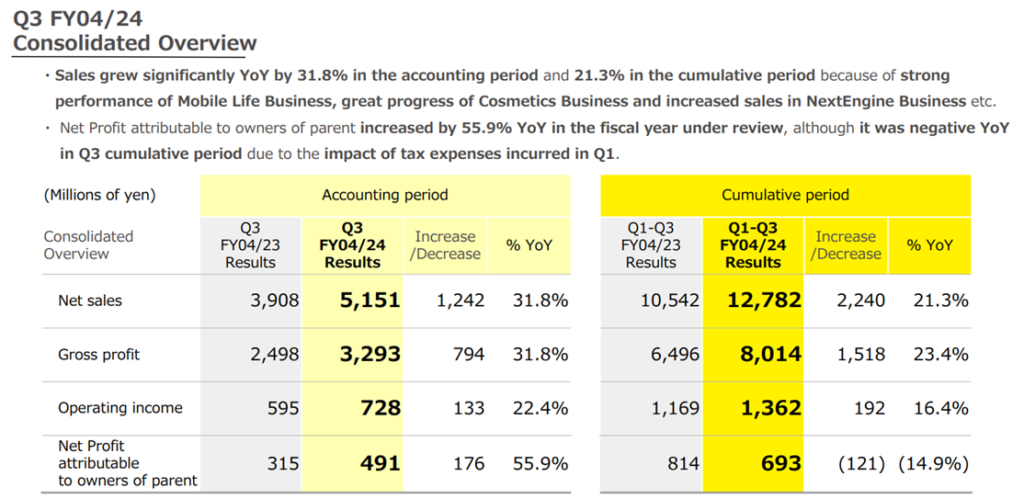
◇Revenues and profits increased: Net sales increased by 32% YoY to JPY 5.15 billion, operating income by 23% YoY to JPY 730 million and net income by 56% YoY to JPY 490 million. The Commerce Business saw increased sales and a slight decrease in profit. Although profits in the Mobile Life Business were sluggish, the secular revenue base is expanding due to higher sales and reduced losses in the Cosmetics Business and higher profits in the Global Business. The Platform Business increased revenues and profits. Despite sluggish growth in the number of orders received, ARPU is rising due to an increase in the number of stores introduced and a low churn rate, as well as the effect of rate revisions and the alliance with Mercari.
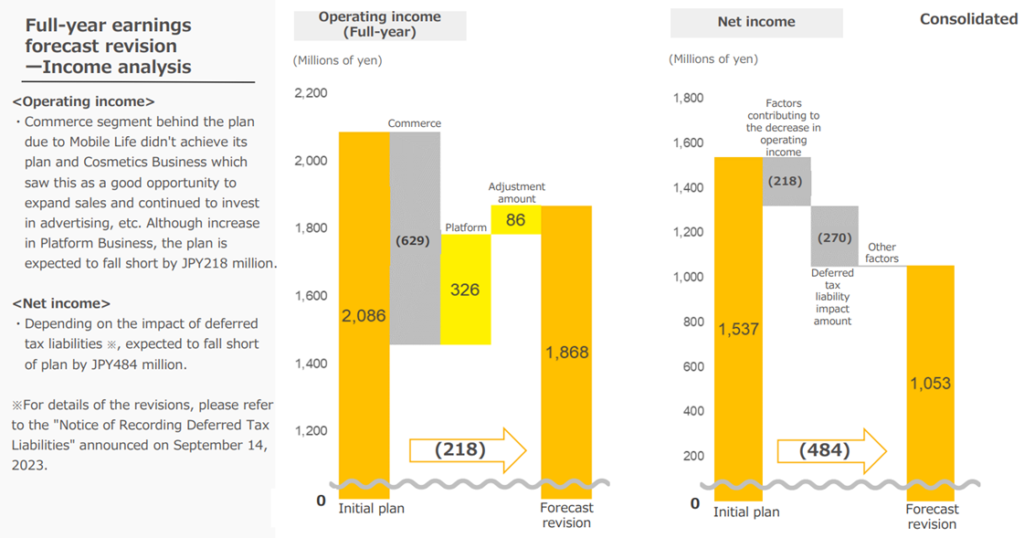
FY04/2024 company forecast revision: The full-year forecast has been revised, although the rate of progress of profits against the previous full-year forecast was low as of Q2. The net sales forecast has been revised up, with the Cosmetics Business and NextEngine Business making up for the shortfall in the Mobile Life Business. On the other hand, the operating income forecast has been revised down, due to a shortfall in the Mobile Life Business and sales expansion costs in the Cosmetics Business, despite higher profits in the NextEngine Business. However, the revised full-year operating income is still strong at JPY 1.87 billion (+47% YoY).
◇Highlights going forward: As the Commerce and Platform Businesses confirm their autonomous and resilient internal growth, share price valuations are expected to factor in the potential of each business without any discount. The rise in share prices following the announcement of financial results may indicate this trend. Particular attention will be paid to (1) the timing of the Cosmetics Business in the Commerce Business returning to profitability and the increasing profit contribution from the Global Business, and (2) the NextEngine Business returning to growth in GMV and the Number of orders received.
Table of contents
| Summary | 1 |
| Key financial data | 2 |
| Q3 results for FY04/2024 | 3 |
| Share price trend | 10 |
| Points of interest | 12 |
| Financial results | 12 |
| Useful information | 14 |
Key financial data
| Fiscal Year | FY04/2017 | FY04/2018 | FY04/2019 | FY04/2020 | FY04/2021 | FY04/2022 | FY04/2023 | |
| Net sales | JPY, mn | 8,502 | 9,377 | 10,303 | 11,325 | 12,364 | 13,413 | 14,038 |
| Ordinary profit | JPY, mn | 1,048 | 1,267 | 1,179 | 1,757 | 2,149 | 2,330 | 1,400 |
| Net profit attributable to owners | JPY, mn | 696 | 873 | 821 | 1,069 | 1,556 | 1,744 | 945 |
| Number of shares outstanding | Shares, mn | 15.8 | 16.1 | 16.1 | 16.1 | 16.3 | 16.3 | 16.3 |
| Net asset | JPY, mn | 2,756 | 3,597 | 4,189 | 4,824 | 6,528 | 8,253 | 8,961 |
| Total asset | JPY, mn | 4,240 | 5,042 | 5,761 | 8,097 | 8,339 | 10,518 | 12,320 |
| Book value per share | JPY | 170 | 216 | 254 | 297 | 405 | 513 | 557 |
| EPS | JPY | 44 | 55 | 51 | 67 | 98 | 110 | 59 |
| Equity to asset | % | 64 | 69 | 70 | 58 | 77 | 78 | 72 |
| ROE | % | 30 | 28 | 22 | 25 | 28 | 24 | 11 |
| Cash flow from operating activities | JPY, mn | 576 | 1,246 | 651 | 1,934 | 1,941 | 1,186 | 695 |
| Cash flow from investing activities | JPY, mn | -433 | -674 | -671 | -1,020 | -412 | -886 | -1,507 |
| Cash flow from financing activities | JPY, mn | 69 | -230 | -7 | 933 | -1,736 | 298 | 263 |
| Cash and cash equivalents at end of period | JPY, mn | 1,324 | 1,695 | 1,660 | 3,453 | 3,355 | 4,026 | 3,536 |
| Number of employees | Person | 233 | 285 | 309 | 353 | 387 | 403 | 428 |
Source: Omega Investment from company data, rounded to the nearest whole number.
Q3 results for FY04/2024
Hamee Corp. announced its financial results for Q3 FY04/2024 (November 2023 – January 2024) after the market close on 15 March 2024.
Continued increase in sales and profits
In Q3, the recovery in Q2 continued, with net sales of JPY 5.15 billion (+32% YoY), operating income of JPY 730 million (+23% YoY) and net income of JPY 491 million (+56% YoY). These were good results.
The details of each business are discussed below, but to give an overview, the Commerce Business saw an increase in sales and a slight decrease in profit. Although Mobile Life Business profits were sluggish, the underlying profit base is expanding due to higher sales and reduced losses in Cosmetics Business and higher earnings in Global Business. The Platform Business increased revenues and profits. Despite sluggish growth in the Number of orders received, ARPU is rising due to an increase in the Number of stores introduced and a low churn rate, as well as the effect of rate revisions and the alliance with Mercari.
Source: Omega Investment from company materials.
Full-year forecasts revised downwards in terms of profits
The company’s profit progress up to Q2 against its previous full-year forecasts was low, but it has now revised its forecasts.
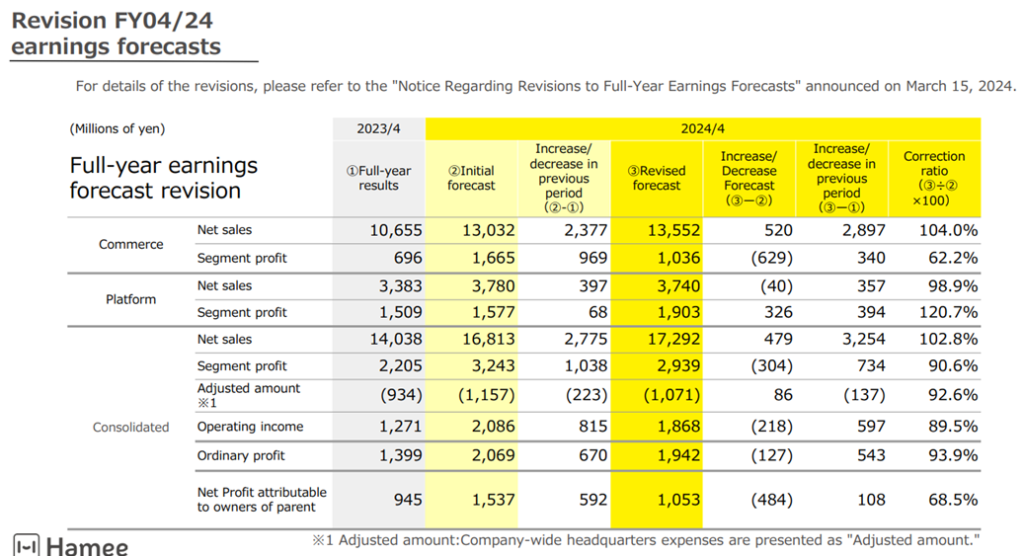
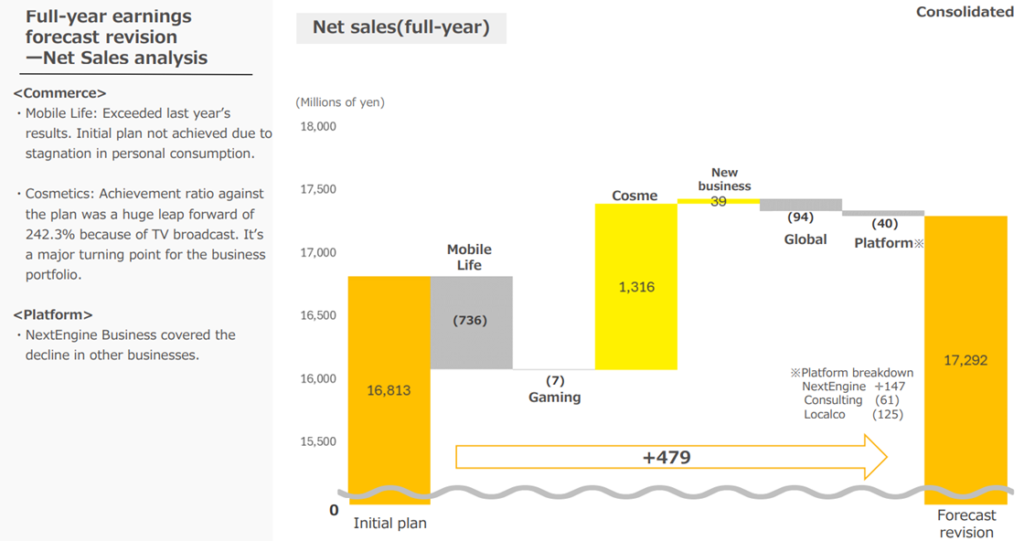
First, net sales were revised upwards from the previous forecast of JPY 16.8 billion to JPY 17.3 billion.
By sector, the Mobile Life Business was revised down in the Commerce Business, but this was offset by solid growth in the Cosmetics Business. In the Platform Business, net sales in the NextEngine Business were revised up, while the Localco Business and Consulting Business were revised down, resulting in a slight downward revision for the business as a whole.
Profits, meanwhile, have been revised down, with operating income revised from JPY 2.1 billion to JPY 1.9 billion and net profit attributable to owners of parent company from JPY 1.5 billion to JPY 1.1 billion.
Operating income has been revised down due to the failure of Mobile Life Business net sales in the Commerce Business to reach the previous plan and costs associated with increased sales in the Cosmetics Business, although Platform Business profits are expected to rise by JPY 300 million due to the strong performance of NextEngine Business.
Concerning the downward revision of net profit attributable to owners of parent, the increase in tax expenses, such as foreign withholding taxes levied in the countries where the overseas subsidiaries are located, is associated with the commencement of dividends from overseas consolidated subsidiaries to the company from the year under review. This does not mean a decline in the company’s secular profitability.
The company plans to pay a full-year dividend of JPY 22.50 per share as before.
Landing on higher revenues and profits after the revision
Although profits have thus been revised downwards, this should not necessarily be viewed negatively.
Firstly, the revised full-year results are strong, with net sales up 23% YoY, operating income up 47% YoY and net profit attributable to owners of parent company up 11% YoY.
Secondly, resilience. As we will see later, in the Commerce Business, even if the Mobile Life Business fell short of expectations, the other divisions were able to compensate to some extent. In the Platform Business, the leading NextEngine Business is on track to generate profits that exceed the initial plan. The measures being taken are working well and should be commended.
Source: Omega Investment from company materials.
Source: Omega Investment from company materials.
Commerce Business
Increase in sales and a slight decrease in profit
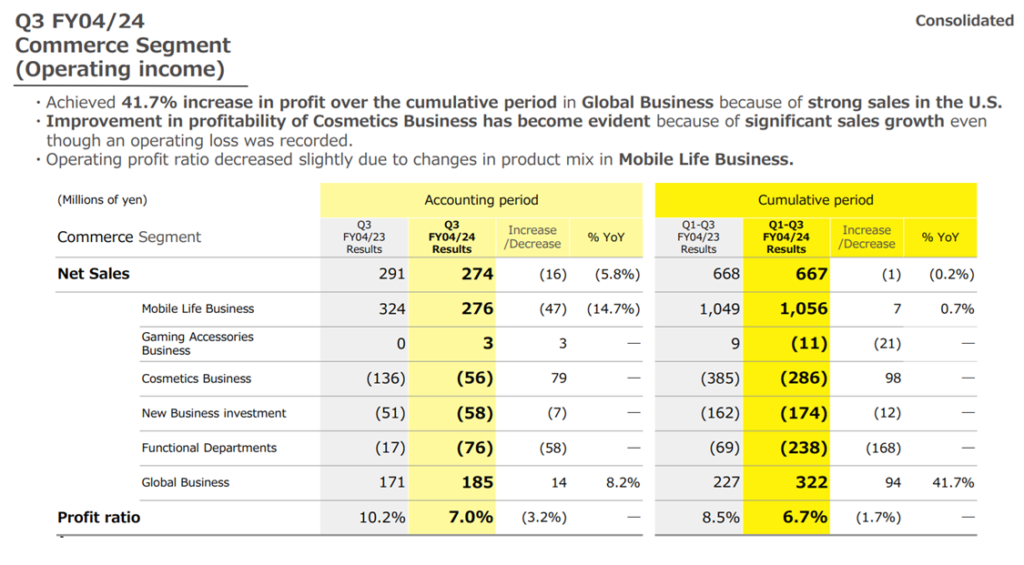
In Q3, the Commerce Business recorded net sales of JPY 3.9 billion (+37% YoY), a segment profit of JPY 270 million (-6% YoY) and a profit margin of 7.0% (-3.2% YoY).
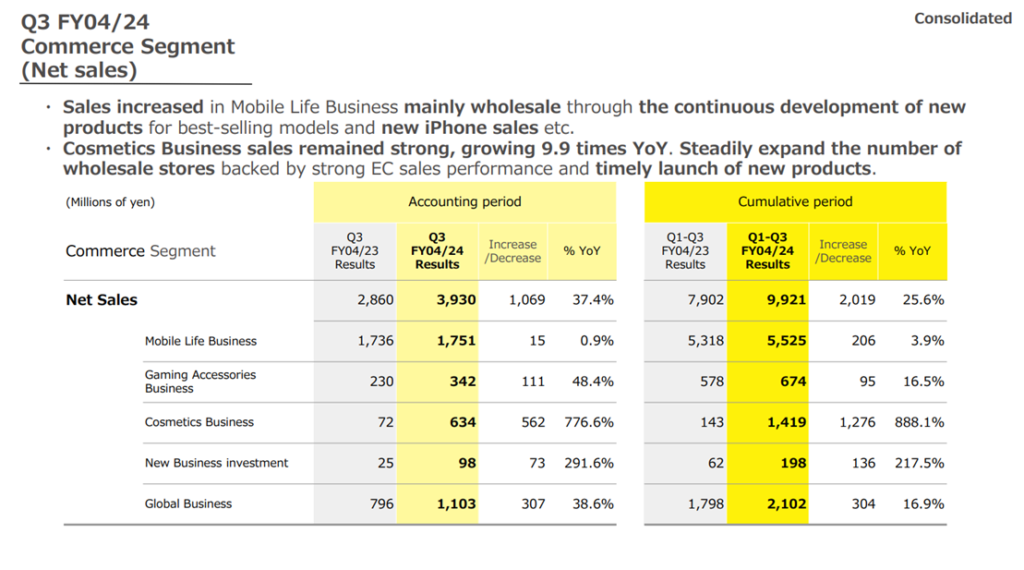
The Cosmetics and Global Business drove the increase in sales, followed by the Gaming Accessories Business, which compensated for the sluggish growth in the Mobile Life Business. The Cosmetics Business is rapidly gaining recognition, and net sales continue to grow rapidly (560 million; 8.8 times YoY, +35% QoQ). In the Global Business, overseas sales of Otamatone, which was taken over in January 2023, are steadily growing. The Gaming Accessories Business also returned to a growth trajectory thanks to the successful expansion of its product line-up.
The Mobile Life Business, which accounts for the largest portion of net sales, saw an increase in revenue. According to the company, it was able to maintain its market share. The growth did not appear as strong as the company’s plan, which may be because it was somewhat aggressive.
In terms of profits, a change in the product mix of the Mobile Life Business has led to a slight decrease in profits. On the other hand, despite increased costs in Functional Departments in the remaining divisions, the Cosmetics Business’s deficit narrowed, and Global Business’s profits increased, resulting in an overall increase in profits.
Although the Mobile Life Business, the traditional mainstay of the business, has experienced sluggish growth, other divisions have generally compensated for this. The Global Business has become profitable, the Cosmetics Business is close to returning to profitability, and the Commerce Business as a whole can be considered to be on a resilient growth trajectory.
Source: Omega Investment from company materials.
Source: Omega Investment from company materials.
Platform Business
Increase in sales and profit
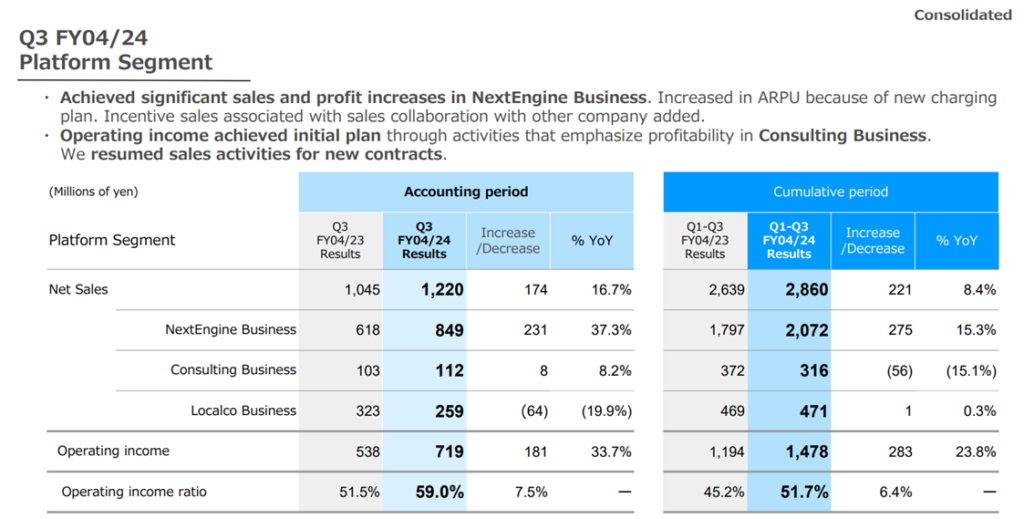
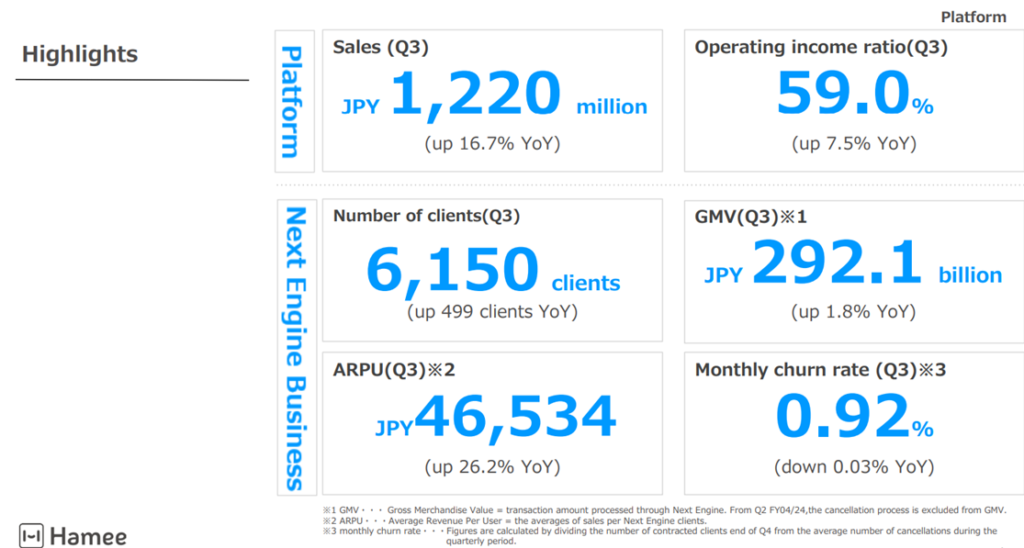
In Q3, the Platform Business recorded net sales of JPY 1.22 billion (+17% YoY), segment profit of JPY 0.72 billion (+34% YoY) and a profit margin of 59.0% (+7.5 percentage points YoY).
In Q2, the Localco Business compensated for the stalling of the NextEngine Business, but in the current quarter, the NextEngine Business’s net sales increased significantly to JPY 850 million (+37% YoY), driving operating income. It can be said that the expansion of the NextEngine Business’ customer base, the effect of the rate revision to improve ARPU, and the collaboration with Mercari were realised as expected.
The KPIs for NextEngine Business show that the total number of clients increased steadily to 6,150 at the end of the quarter (a net increase of 117 from the end of the previous quarter), the Monthly churn rate remained low at 0.92%, and ARPU increased to JPY 46,534 (+26% YoY).
Meanwhile, the Number of orders received continued to decline to 36.38 million (-12% YoY).
In general, growth in the mainstay NextEngine Business has accelerated. However, it is hoped that the Number of orders received will return to positive growth in about a year when the effects of the fee revision and other factors will have run their course.
Source: Omega Investment from company materials.
Source: Omega Investment from company materials.
Reorganisation, etc.
The announced share-distribution-type spin-off of NE Inc. on 14 July 2023 and the spin-off IPO of NE Inc. remain unchanged in this plan.
Share price trend
Hamee share price trends
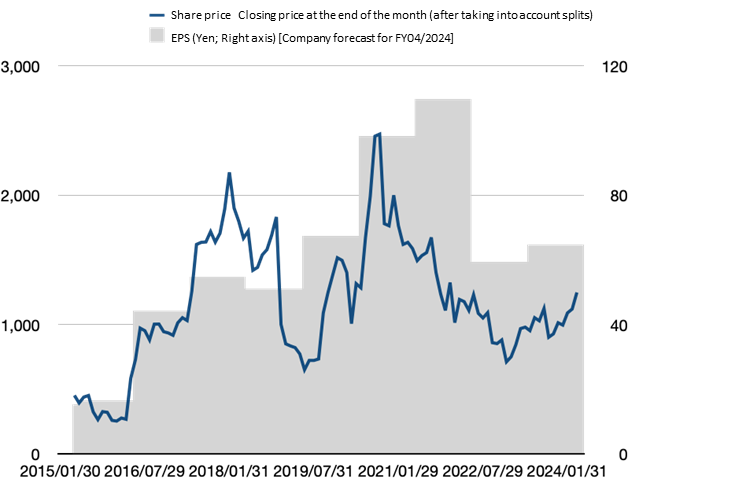
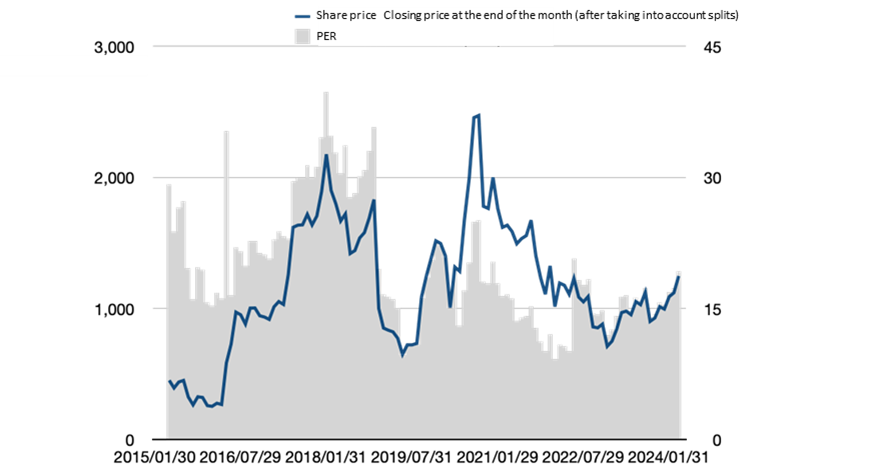
The month-end closing price of the company’s share price and EPS by year (company forecast for FY04/2024), as well as the share price and PER, are shown in this graph.
The share price fell briefly after the Q2 results announcement but has since risen consistently. It should be noted that EPS was also revised down this time, but the share price has risen and the forecast PER has continued to increase, approaching 20 times.
It can be inferred that the Commerce Business is generally on a growth trajectory while reducing its dependence on the Mobile Life Business and that the Platform Business is continuing to grow by expanding its customer base and increasing ARPU in the NextEngine Business, which the stock market has well rated.
Points of interest
As the Commerce Platform, businesses confirm their autonomous and resilient internal growth, share price valuations are expected to factor in their respective business potentials without any discount. The current solid share price trend, especially the expansion of the forecast PER, can be interpreted as the germ of such a trend.
The following points are of particular interest going forward.
- Timing of the return to profitability of Cosmetics Business in Commerce Business and the increased profit contribution of Global Business
- A return to growth in GMV and the Number of orders received in the NextEngine Business
- The approach to the company’s forecast for FY04/2025 results will be disclosed at the time of the next results announcement (what assumptions will be made concerning the Mid-Term Management Plan targets).
Financial results
Financial period |
FY04/2017 |
FY04/2018 |
FY04/2019 |
FY04/2020 |
FY04/2021 |
FY04/2022 |
FY04/2023 |
FY04/2024 |
FY04/2025 |
FY04/2026 |
Consolidated,Japanese GAAP |
Company
|
Medium-term
|
Medium-term
|
|||||||
[Statements of income] |
||||||||||
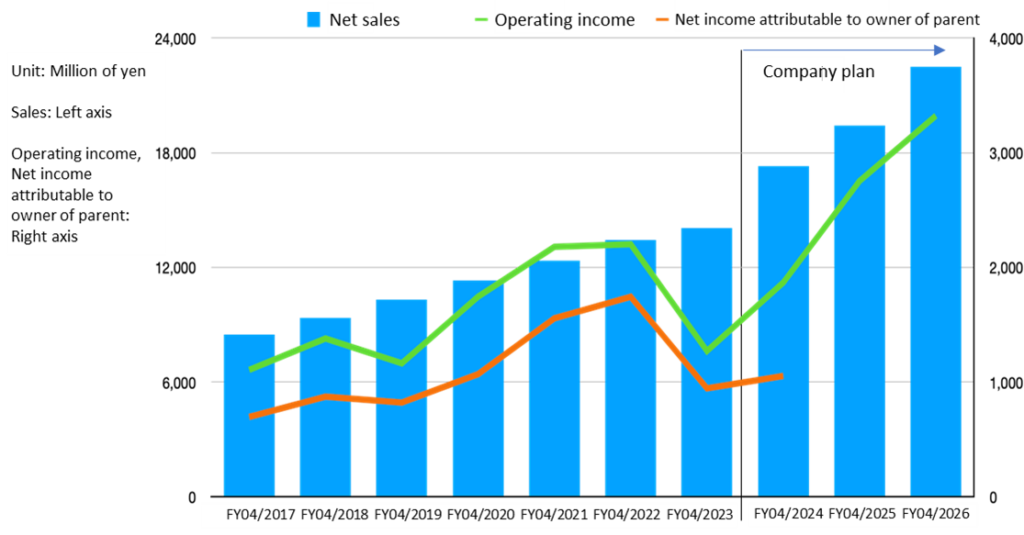
Net sales |
8,502 |
9,377 |
10,303 |
11,325 |
12,364 |
13,413 |
14,038 |
16,813 |
19,408 |
22,515 |
Operating income |
1,106 |
1,380 |
1,164 |
1,745 |
2,180 |
2,202 |
1,271 |
2,086 |
2,754 |
3,323 |
Ordinary profit |
1,048 |
1,267 |
1,179 |
1,757 |
2,149 |
2,330 |
1,400 |
2,069 |
||
Net profit before income taxes |
1,010 |
1,259 |
1,179 |
1,582 |
2,144 |
2,463 |
1,396 |
|||
Net profit attributable to owners of the parent |
696 |
873 |
821 |
1,069 |
1,556 |
1,744 |
945 |
1,537 |
||
[Balance Sheets] |
||||||||||
Total assets |
4,240 |
5,042 |
5,761 |
8,097 |
8,339 |
10,518 |
12,320 |
|||
Total liabilities |
1,484 |
1,445 |
1,572 |
3,272 |
1,811 |
2,265 |
3,360 |
|||
Total net assets |
2,756 |
3,597 |
4,189 |
4,824 |
6,528 |
8,253 |
8,961 |
|||
Total borrowings |
468 |
298 |
500 |
1,740 |
104 |
544 |
1,300 |
|||
[Statements of cash flows] |
||||||||||
Cash flow from operating activities |
576 |
1,246 |
651 |
1,934 |
1,941 |
1,186 |
695 |
|||
Cash flow from investing activities |
-433 |
-674 |
-671 |
-1,020 |
-412 |
-886 |
-1,507 |
|||
Cash flow from financing activities |
69 |
-230 |
-7 |
933 |
-1,736 |
298 |
263 |
|||
Cash and cash equivalents at end of period |
1,324 |
1,695 |
1,660 |
3,453 |
3,355 |
4,026 |
3,536 |
|||
[Efficiency] |
||||||||||
Ratio of ordinary profit to sales |
12% |
14% |
11% |
16% |
17% |
17% |
10% |
12% |
||
ROA |
19% |
15% |
15% |
19% |
18% |
8% |
||||
ROE |
30% |
28% |
22% |
25% |
28% |
24% |
11% |
|||
[Per-share] Unit : JPY |
||||||||||
EPS |
44 |
55 |
51 |
67 |
98 |
110 |
59 |
94 |
||
BPS |
170 |
216 |
254 |
297 |
405 |
513 |
557 |
|||
DPS |
4.5 |
5.5 |
6.5 |
7.0 |
10.0 |
22.5 |
22.5 |
22.5 |
||
[Number of employees] |
||||||||||
Number of consolidated employees |
233 |
285 |
309 |
353 |
387 |
403 |
428 |
Source: Omega Investment from company materials
Rounding half up
Financial results
Key PL items
Sales, operating margin, and ROE
Source: Omega Investment from company materials.
Useful information
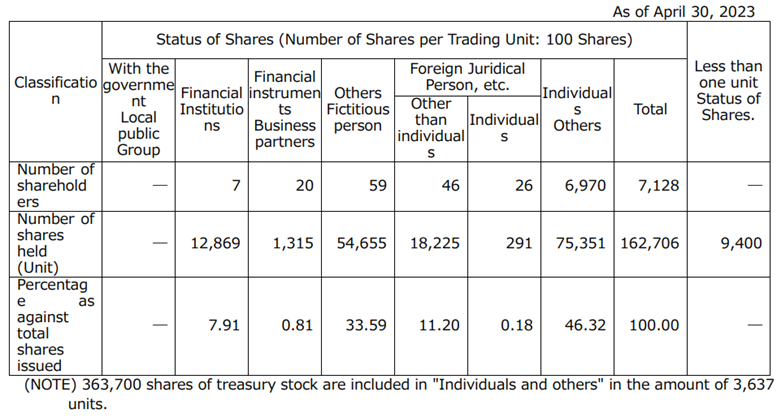
Principal shareholders
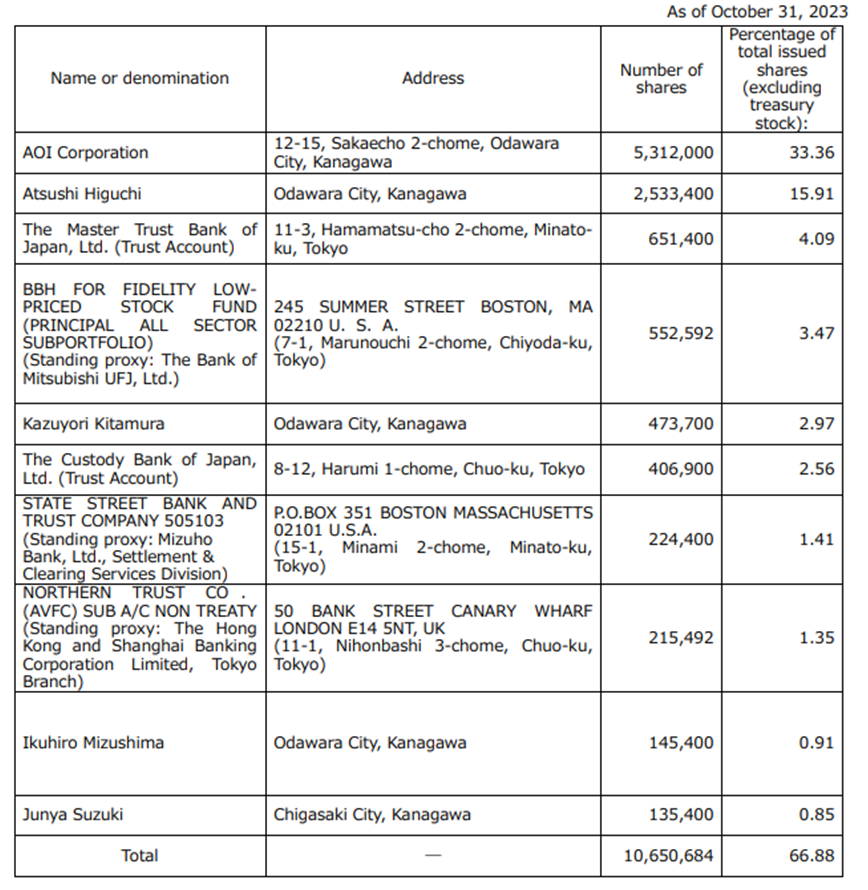
Shareholder composition