2026-07-27
Home
Japanese

Omega Investment Co., Ltd.
BlueMeme (Company note – 3Q update)

| Share price (5/18) | ¥1,180 | Dividend Yield (24/3 CE) | – % |
| 52weeks high/low | ¥2,350 / 1,029 | ROE(TTM) | 9.3 % |
| Avg Vol (3 month) | 15.7 thou shrs | Operating margin (TTM) | 13.8 % |
| Market Cap | ¥4.2 bn | Beta (5Y Monthly) | 0.16 |
| Enterprise Value | ¥2.5 bn | Shares Outstanding | 3.562 mn shrs |
| PER (24/3 CE) | 20.06 X | Listed market | TSE Growth |
| PBR (23/3 act) | 1.61 X |
| Click here for the PDF version of this page |
| PDF Version |
Pioneering Japan’s digital transformation (DX) with low-code and Agile development
Summary
◇BlueMeme is a Japanese pioneer in ‘low-code’ and ‘Agile’ development and has specialised in low-code development since its establishment in 2006. The company is actively investing in promoting its automation concepts, such as Digital Labour and Business Architect. The low-code platform advocated by the company has the potential to overcome the challenge of the shortage and uneven distribution of IT personnel in Japan and accelerate DX initiatives in large companies and SMEs. Therefore, although investment is ahead in the immediate term, a leap in profitability is expected when the development concept takes effect, and the automation of system development progresses.
◇Growth strategy: according to the medium-term management plan (published 14 November 2023), the target is to achieve sales of 4.1 billion yen and an operating profit of 920 million yen in FY3/2026 when the development of Digital Labour is underway, and 10 billion yen in sales by FY3/2028, when Digital Labour is fully applied, and partner businesses are expanded. The key measures to achieve this are as follows:
1) Strengthen the research and development system for Digital Labour and promote its practical application.
2) Shift the billing format from man-monthly person-hours to application generation volume.
3) Expand the number of business architects capable of providing high-unit-price services.
4) Expand indirect sales in collaboration with partner companies.
◇Summary of 3Q results for FY3/2024: Profit down due to planned upfront costs for growth despite higher revenues. The results for the period October-December 2023, announced on 14 February 2024, showed sales of 610 million yen (+9.7% YoY), gross profit of 300 million yen (+12.1% YoY) and operating profit of 49 million yen (-19.7% YoY). Sales in Professional Services, the current core business, grew steadily, and the COGS ratio improved by one percentage point YoY. On the other hand, operating profit fell as upfront costs for growth were recorded as planned. According to the company, sales are broadly in line with expectations, considering seasonality, and the company’s KPIs – order backlog and pro forma EBITDA – are also progressing well.
The company’s full-year forecasts for FY3/2024 remain unchanged. It should be noted that earnings tend to be weighted towards the fourth quarter, but progress so far appears to have been generally satisfactory.
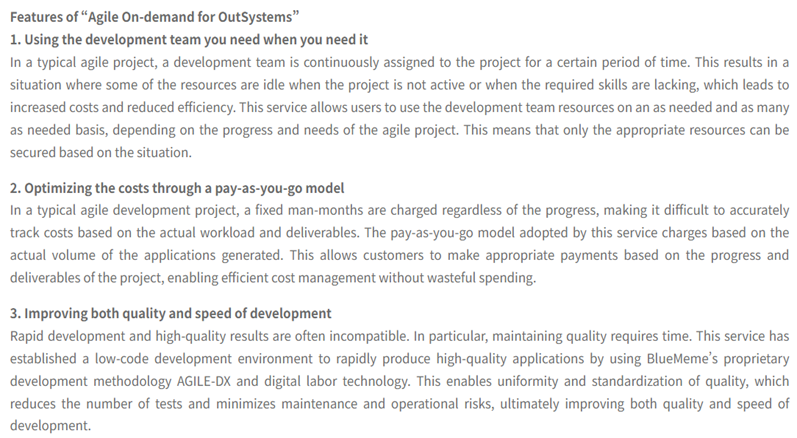
◇’Agile On-demand for OutSystems‘ service launched: On 15 March 2024, the company announced the launch of its Digital Labour-based ‘Agile On-demand for OutSystems’ service and that MITSUI KNOWLEDGE INDUSTRY Co., Ltd, the company’s largest shareholder, would start selling this service. This is a new contract development service for Agile development projects utilising low-code, allowing customers to use low-code experts as and when required, eliminating the need for excessive engineers. As a result, the company expects to be able to charge based on the amount of applications generated rather than man-monthly person-hours and thus manage costs more efficiently. The company is also attracting a lot of attention as it aims to improve the productivity of its engineers and increase the number of customers interested in low-code development.
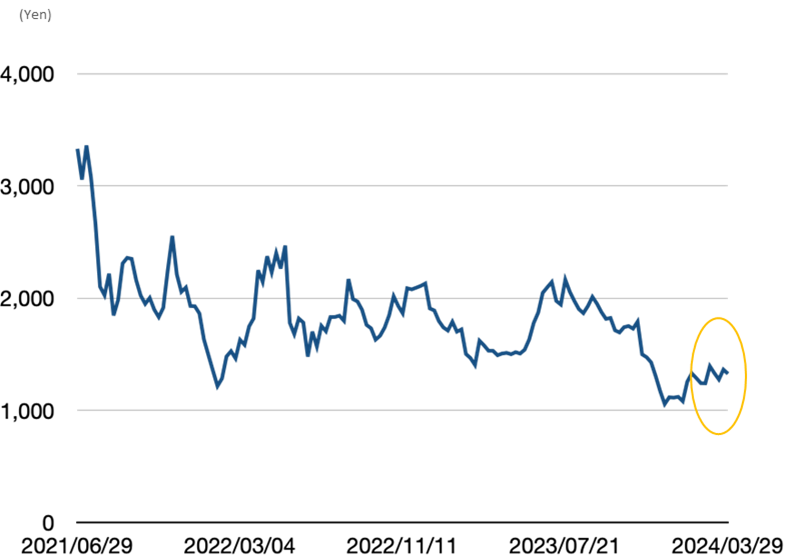
◇Share price trends: The share price fell briefly immediately after the announcement of the results on 15 February 2024 but quickly rebounded and has been on a steady rise, although there have been ups and downs since then. The share price also appears to have reacted positively to the above disclosure on 15 March. Investors rate the increased revenues and the solid KPIs of order backlog and pro forma EBITDA well, which is read as a favourable response to the profit pressure from upfront investment. The next focus will be on FY3/2024 results and FY3/2025 forecasts. Given the share price formation, the contribution of the above-mentioned new services and the progress of the Digital Labour development pipeline are considered essential.
Table of contents
| Summary | 1 |
| Key financial data | 2 |
| Financial results | 3 |
| 3Q results for FY3/2024 | 3 |
| FY3/2024 full-year forecast | 4 |
| Business development update | 5 |
| Share price trends and the focus | 6 |
| Financial data | 7 |
Key financial data
| Fiscal Year | 2019/3 | 2020/3 | 2021/3 | 2022/3 | 2023/3 | 2024/3 (Forecast) |
| Net sales | 1,496 | 1,800 | 2,101 | 1,929 | 2,244 | 2,650 |
| Cost of sales | 1,036 | 1,275 | 1,410 | 885 | 1,132 | – |
| Gross profit | 461 | 524 | 691 | 1,044 | 1,111 | – |
| SG&A expenses | 374 | 492 | 515 | 680 | 801 | – |
| Operating profit | 87 | 31 | 175 | 363 | 309 | 310 |
| Ordinary profit | 86 | 30 | 174 | 348 | 310 | 310 |
| Net profit | 61 | 10 | 130 | 253 | 230 | 230 |
| Current assets | 814 | 1,073 | 1,179 | 2,754 | 2,794 | – |
| Cash and deposits | 363 | 584 | 645 | 2,356 | 2,224 | – |
| Non-current assets | 202 | 199 | 206 | 201 | 222 | – |
| Total assets | 1,016 | 1,272 | 1,386 | 2,956 | 3,016 | – |
| Total liabilities | 668 | 914 | 862 | 601 | 429 | – |
| Total net assets | 348 | 358 | 523 | 2,354 | 2,587 | – |
| Equity ratio (%) | 34.3 | 28.1 | 37.8 | 79.6 | 85.8 | – |
| Cash flow from operating activities | -65 | 174 | 182 | 338 | 94 | – |
| Cash flow from investing activities | -148 | -13 | -21 | -9 | -46 | – |
| Cash flow from financing activities | 279 | 59 | -100 | 1,381 | -179 | – |
| Cash and cash equivalents at end of period | 363 | 584 | 645 | 2,356 | 2,224 | – |
Note: From FY3/2022, the new accounting standard for revenue recognition (new standard) is applied. Therefore, there is no continuity between FY3/2021 and FY3/2022 onwards.
Source: Omega Investment from company materials
Financial results
3Q results for FY3/2024: increased revenues but lower profits due to planned upfront costs for growth
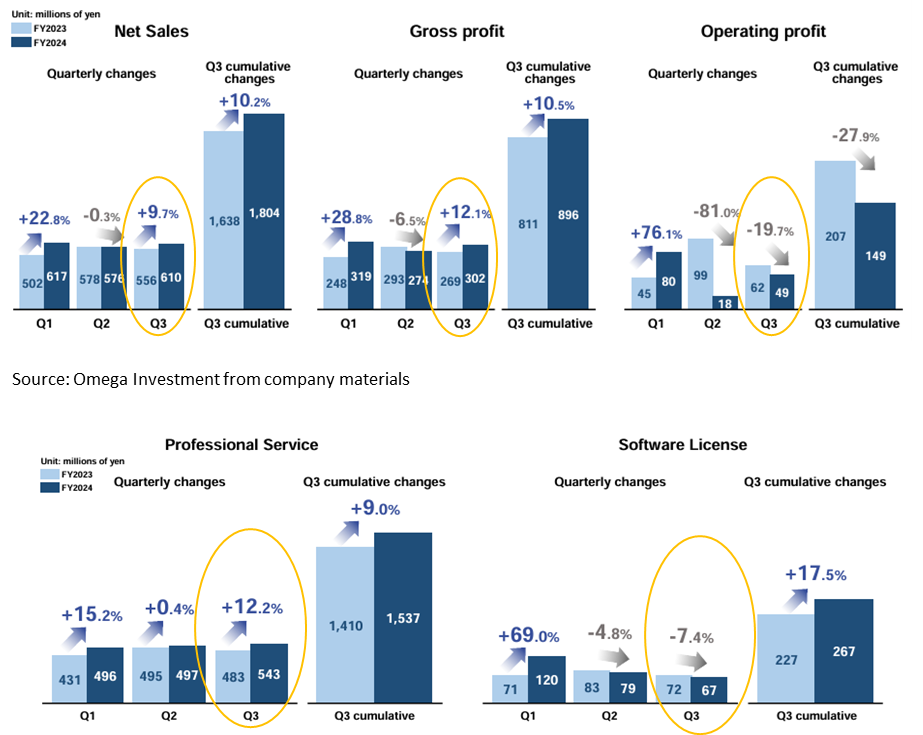
The results for the period October-December 2023, announced on 14 February 2024, showed net sales of 610 million yen (+9.7% YoY), gross profit of 300 million yen (+12.1% YoY) and operating profit of 49 million yen (-19.7% YoY).
Sales of Professional Services (consulting and contracted development services using OutSystems and other low-code platforms and engineering training), the current core business, grew steadily, and the COGS ratio improved by one percentage point YoY.
Sales of Software License fell by 7.4% YoY in the quarter under review, but this is partly due to an increase in upgrades, etc., by existing customers in Q1. On a cumulative basis, sales were up +17.5% YoY, which can also be considered strong.
Source: Omega Investment from company materials
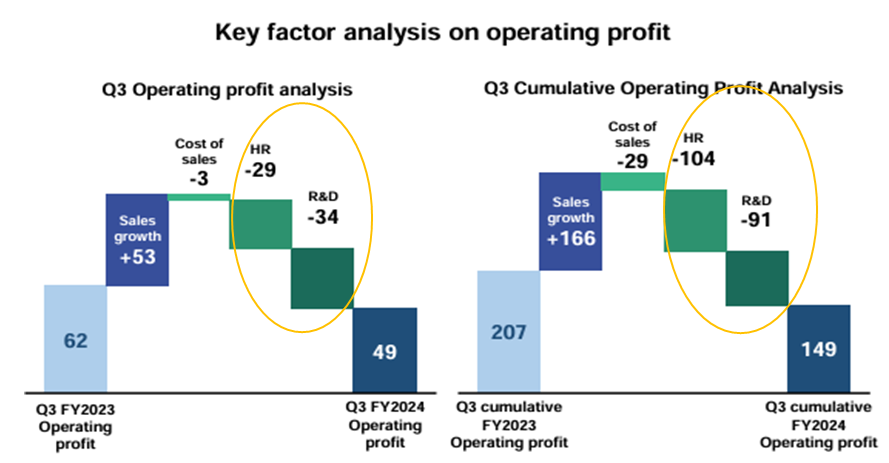
On the other hand, operating profit declined as upfront growth costs were recorded as planned. According to the company, sales are broadly in line with expectations, taking into account seasonality.
Source: Omega Investment from company materials
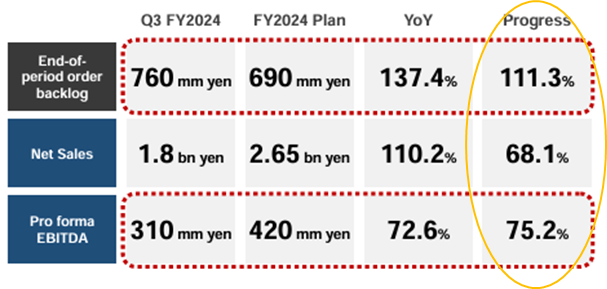
The company’s KPIs—order backlog and pro forma EBITDA—are also on track with the full-year plan.
Source: Omega Investment from company materials
FY3/2024 full-year forecast: forecasts were left unchanged. It should be noted that earnings tend to be weighted towards the fourth quarter, but progress so far appears to have been generally satisfactory.
| JPY, mn, % | Net sales | YoY | Oper. | YoY | Ord. | YoY | Profit | YoY | EPS | DPS |
| % | profit | % | profit | % | ATOP | % | (¥) | (¥) | ||
| 2020/3 | 1,800 | 20.3 | 31 | 99.1 | 30 | 99.0 | 10 | -82.7 | 5.15 | 0.00 |
| 2021/3 | 2,101 | 16.8 | 175 | 448.8 | 174 | 465.3 | 130 | 1133.6 | 62.49 | 0.00 |
| 2022/3 | 1,929 | – | 363 | – | 348 | – | 253 | – | 78.48 | 0.00 |
| 2023/3 | 2,244 | 16.3 | 309 | -14.9 | 310 | -11.0 | 230 | -9.0 | 65.64 | 0.00 |
| 2024/3 (CE) | 2,650 | 18.1 | 310 | 0.0 | 310 | -0.1 | 230 | -0.1 | 65.40 | 0.00 |
| 2023/3 3Q | 1,638 | 16.3 | 207 | -27.6 | 208 | -23.4 | 138 | -25.9 | 39.53 | 0.00 |
| 2024/3 3Q | 1,804 | 10.2 | 149 | -27.9 | 151 | -27.4 | 79 | -42.2 | 22.99 | 0.00 |
Note: The new accounting standard for revenue recognition (new standard) is applied from FY3/2022. Therefore, there is no continuity between FY3/2021 and FY3/2022 onwards.
Business development update
Launch of ‘Agile On-demand for OutSystems‘ service
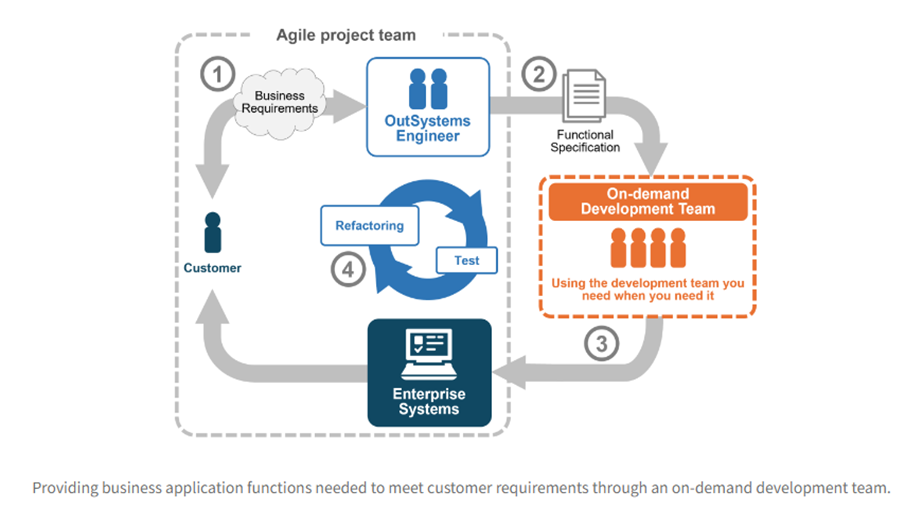
On 15 March 2024, the company announced the launch of the ‘Agile On-demand for OutSystems’ service using Digital Labour and that MITSUI KNOWLEDGE INDUSTRY Co., Ltd, the company’s largest shareholder, will start selling this service. This is a new contracted development service for Agile development projects utilising low-code, which allows customers to use low-code experts as and when required, thereby eliminating the need to have an excessive number of engineers on hand and efficient cost management as billing is based on the amount of applications generated rather than man-monthly person-hours. The company is also attracting a lot of attention as it aims to improve the productivity of its engineers and increase the number of customers interested in low-code development.
Source: Omega Investment from company materials
Source: Omega Investment from company materials
Share price trends and the focus
Share Price Trend
The share price fell briefly immediately after the results were announced on 15 February 2024 but quickly rebounded and has since been on a steady rise, albeit with some ups and downs. Furthermore, the share price has taken the aforementioned disclosure on 15 March positively. The stock market has taken a positive view of the increase in revenues and the solid KPIs of order backlog and pro forma EBITDA, which can be interpreted as a positive reaction to the pressure on profits due to upfront investment.
Points of interest from here on
Given this approach to share price formation in the stock market, the following points are of interest. -FY3/2024 results. Did the company firmly add to sales and pro forma EBITDA in 4Q, which is heavily weighted towards earnings due to seasonality? Are orders on track, and are upfront investments in line with expectations? -FY3/2025 forecasts: trends in revenue growth, order backlog forecast, and profitability. Contribution of the ‘Agile On-demand for OutSystems’ service. -Headcount plan. -Progress of the Digital Labour development pipeline.
The share price valuation could change significantly if the company can drive growth in the low-code development market and develop a business model with high marginal returns. The company’s quarterly progress will be the focus of increasing attention.
4069:BlueMeme share price move
Financial data (quarterly basis)
| FY(\mn) | 2021/3* | 2022/3 | 2023/3 | 2023/3 | |||||||||||
| 1Q | 2Q | 3Q | 4Q | 1Q | 2Q | 3Q | 4Q | 1Q | 2Q | 3Q | 4Q | 1Q | 2Q | 3Q | |
| [Statements of income] | |||||||||||||||
| Net sales | 485 | 541 | 482 | 594 | 426 | 463 | 519 | 521 | 502 | 578 | 556 | 606 | 617 | 576 | 610 |
| Year-on-year basis (%) | – | – | – | – | – | – | – | – | 17.8% | 25.0% | 7.3% | 16.3% | 22.8% | -0.3% | 9.7% |
| Professional Services | – | – | – | – | 378 | 392 | 437 | 457 | 431 | 495 | 483 | 556 | 496 | 497 | 543 |
| Year-on-year basis (%) | – | – | – | – | – | – | – | – | 14.0% | 26.1% | 10.6% | 21.5% | 15.2% | 0.4% | 12.2% |
| Composition of sales | – | – | – | – | 88.7% | 84.8% | 84.3% | 87.8% | 85.8% | 85.6% | 86.9% | 91.8% | 80.4% | 86.2% | 89.0% |
| Software License Sales | – | – | – | – | 48 | 70 | 84 | 63 | 71 | 83 | 72 | 49 | 120 | 79 | 67 |
| Year-on-year basis (%) | – | – | – | – | – | – | – | – | 48.0% | 18.7% | -10.6% | -21.5% | 69.1% | -4.8% | -7.4% |
| Composition of sales | – | – | – | – | 11.3% | 15.2% | 15.7% | 12.2% | 14.2% | 14.4% | 13.1% | 8.2% | 19.6% | 13.8% | 11.0% |
| Cost of sales | 361 | 369 | 311 | 370 | 199 | 206 | 231 | 249 | 254 | 285 | 287 | 306 | 298 | 302 | 308 |
| Cost of sales margin | 74.4% | 68.2% | 64.5% | 62.3% | 46.7% | 44.4% | 44.5% | 47.8% | 50.5% | 49.5% | 51.5% | 50.5% | 48.1% | 52.5% | 50.5% |
| Gross profit | 125 | 171 | 171 | 224 | 227 | 258 | 288 | 271 | 248 | 293 | 269 | 300 | 319 | 274 | 302 |
| SG&A expenses | 124 | 124 | 127 | 141 | 153 | 160 | 173 | 194 | 203 | 194 | 207 | 198 | 239 | 256 | 253 |
| SG&A expenses margin | 25.6% | 22.9% | 26.3% | 23.7% | 35.9% | 34.5% | 33.3% | 37.2% | 40.4% | 33.6% | 37.2% | 32.7% | 38.7% | 44.4% | 41.5% |
| Operating profit | 0 | 49 | 43 | 83 | 74 | 96 | 114 | 78 | 45 | 99 | 62 | 103 | 80 | 18 | 49 |
| Year-on-year basis (%) | – | – | – | – | – | – | – | – | -38.4% | 2.7% | -46.1% | 32.1% | 76.1% | -81.0% | -19.7% |
| Operating profit margin (%) | 0.0% | 9.1% | 8.9% | 14.0% | 17.6% | 20.7% | 22.2% | 15.0% | 9.1% | 17.1% | 11.1% | 17.0% | 13.1% | 3.3% | 8.0% |
| Non-operating income | 0 | 0 | 0 | 2 | 0 | 0 | 0 | 0 | 0 | 0 | 1 | 1 | 1 | 1 | 1 |
| Non-operating expenses | 1 | 0 | 1 | 1 | 13 | 2 | 0 | 1 | 1 | 0 | 0 | 0 | 0 | 0 | 2 |
| Ordinary profit | 0 | 47 | 43 | 84 | 62 | 95 | 115 | 77 | 46 | 99 | 63 | 102 | 82 | 20 | 49 |
| Year-on-year basis (%) | – | – | – | – | – | – | – | – | -26.6% | 4.2% | -45.2% | 32.5% | 78.3% | -79.8% | -23.0% |
| Ordinary profit margin (%) | 0.0% | 8.7% | 8.9% | 14.1% | 14.6% | 20.5% | 22.2% | 14.8% | 9.1% | 17.1% | 11.3% | 16.8% | 13.3% | 3.5% | 8.0% |
| Income before income taxes | 0 | 47 | 43 | 84 | 62 | 95 | 115 | 77 | 46 | 99 | 63 | 91 | 82 | 17 | 50 |
| Total income taxes | 1 | 10 | 17 | 16 | 19 | 31 | 36 | 9 | 15 | 33 | 22 | -2 | 34 | 17 | 18 |
| Net income | -1 | 37 | 26 | 68 | 43 | 64 | 79 | 67 | 30 | 67 | 41 | 92 | 48 | 0 | 32 |
| Year-on-year basis (%) | – | – | – | – | – | – | – | – | -28.7% | 4.7% | -48.1% | 37.3% | 60.0% | -99.5% | -22.2% |
| Net income margin (%) | -0.2% | 6.8% | 5.4% | 11.4% | 10.1% | 13.8% | 15.2% | 12.9% | 6.0% | 11.6% | 7.4% | 15.2% | 7.8% | 0.0% | 5.2% |
| [Balance Sheets] | |||||||||||||||
| Current assets | 1,051 | 1,008 | 1,001 | 1,180 | 2,105 | 2,507 | 2,664 | 2,754 | 2,662 | 2,723 | 2,688 | 2,794 | 2,703 | 2,600 | 2,562 |
| Cash and deposits | 590 | 520 | 555 | 645 | 1,826 | 2,202 | 2,271 | 2,356 | 2,267 | 2,392 | 2,377 | 2,224 | 2,193 | 2,190 | 2,070 |
| Notes and accounts receivable – trade, and contract assets | 170 | 167 | 161 | 228 | 252 | 266 | 357 | 366 | 348 | 270 | 252 | 439 | 356 | 254 | 323 |
| Non-current assets | 205 | 208 | 207 | 206 | 197 | 199 | 197 | 201 | 191 | 188 | 181 | 222 | 239 | 284 | 314 |
| Property, plant and equipment | 102 | 99 | 95 | 93 | 90 | 90 | 87 | 91 | 89 | 86 | 83 | 80 | 83 | 96 | 133 |
| Intangible assets | 17 | 23 | 26 | 24 | 23 | 21 | 20 | 18 | 17 | 15 | 14 | 0 | 0 | 0 | 0 |
| Investments and other assets | 86 | 86 | 86 | 89 | 85 | 88 | 90 | 91 | 85 | 86 | 84 | 141 | 155 | 187 | 181 |
| Total assets | 1,256 | 1,216 | 1,208 | 1,386 | 2,302 | 2,707 | 2,861 | 2,956 | 2,853 | 2,911 | 2,869 | 3,016 | 2,943 | 2,885 | 2,876 |
| Current liabilities | 683 | 639 | 632 | 733 | 398 | 425 | 521 | 564 | 420 | 410 | 325 | 393 | 383 | 375 | 335 |
| Non-current liabilities | 215 | 183 | 155 | 129 | 104 | 79 | 53 | 37 | 37 | 37 | 37 | 36 | 36 | 51 | 53 |
| Total liabilities | 897 | 822 | 787 | 862 | 502 | 503 | 575 | 601 | 458 | 447 | 362 | 429 | 420 | 427 | 388 |
| Total net assets | 358 | 395 | 421 | 524 | 1,800 | 2,204 | 2,286 | 2,354 | 2,395 | 2,464 | 2,506 | 2,587 | 2,523 | 2,457 | 2,488 |
| Shareholders’ equity | 358 | 394 | 421 | 524 | 1,800 | 2,203 | 2,286 | 2,354 | 2,395 | 2,463 | 2,506 | 2,587 | 2,522 | 2,455 | 2,488 |
| Share capital | 189 | 189 | 189 | 206 | 790 | 959 | 962 | 962 | 967 | 968 | 969 | 970 | 970 | 971 | 971 |
| Capital surplus | 180 | 180 | 180 | 197 | 781 | 950 | 953 | 953 | 958 | 959 | 960 | 961 | 961 | 962 | 962 |
| Retained earnings | -11 | 26 | 52 | 120 | 229 | 293 | 372 | 439 | 470 | 537 | 578 | 669 | 717 | 717 | 750 |
| Treasury shares | 0 | 0 | 0 | 0 | 0 | 0 | -14 | -127 | -195 | -196 | |||||
| Total liabilities and net assets | 1,256 | 1,216 | 1,208 | 1,386 | 2,302 | 2,707 | 2,861 | 2,957 | 2,853 | 2,911 | 2,869 | 3,016 | 2,943 | 2,885 | 2,876 |
*: The new accounting standard for revenue recognition has been applied from FY3/2022; FY3/2021 figures are based on the old standard.
Note: Due to rounding, number of significant digits, etc., there may be minor discrepancies in figures.
Source: Omega Investment from company materials
Financial data (full-year basis)
| FY(\mn) | 2019/3 | 2020/3 | 2021/3 | 2022/3 | 2023/3 |
| [Statements of income] | |||||
| Net sales | 1,496 | 1,800 | 2,101 | 1,929 | 2,244 |
| Year-on-year basis (%) | 95.7 | 20.2 | 16.8 | – | 16.3 |
| Cost of sales | 1,036 | 1,275 | 1,410 | 885 | 1,132 |
| Gross profit | 461 | 524 | 691 | 1,044 | 1,111 |
| Gross profit margin (%) | 30.8 | 29.2 | 32.9 | 54.1 | 49.5 |
| SG&A expenses | 374 | 492 | 515 | 680 | 801 |
| Operating profit | 87 | 31 | 175 | 363 | 309 |
| Year-on-year basis (%) | – | -63.2 | 446.9 | – | -14.9 |
| Operating profit ratio (%) | 5.8 | 1.8 | 8.3 | 18.9 | 13.8 |
| Non-operating income | 0 | 0 | 2 | 0 | 1 |
| Non-operating expenses | 1 | 1 | 3 | 15 | 0 |
| Ordinary profit | 86 | 30 | 174 | 348 | 310 |
| Ordinary profit margin (%) | 5.7 | 1.7 | 8.3 | – | -11.0 |
| Extraordinary income | 0 | 0 | – | – | |
| Extraordinary expenses | 19 | – | 11 | ||
| Income before income taxes | 67 | 30 | 174 | 348 | 298 |
| Total income taxes | 6 | 20 | 44 | 95 | 68 |
| Net income | 61 | 10 | 130 | 253 | 230 |
| Year-on-year basis (%) | -82.0 | 1,081.8 | – | -9.0 | |
| Net income ratio (%) | 4.1 | 0.6 | 6.2 | 13.1 | 10.3 |
| [Balance Sheets] | |||||
| Current assets | 814 | 1,073 | 1,179 | 2,754 | 2,794 |
| Cash and deposits | 363 | 584 | 645 | 2,356 | 2,224 |
| Notes and accounts receivable – trade, and contract assets | 264 | 294 | 227 | 366 | 439 |
| Non-current assets | 202 | 199 | 206 | 201 | 222 |
| Property, plant and equipment | 116 | 105 | 92 | 91 | 80 |
| Intangible assets | 0 | 7 | 24 | 18 | 0 |
| Investments and other assets | 85 | 85 | 89 | 91 | 141 |
| Total assets | 1,016 | 1,272 | 1,386 | 2,956 | 3,016 |
| Current liabilities | 584 | 666 | 733 | 564 | 393 |
| Short-term borrowings | 235 | 135 | 116 | 96 | 1 |
| Non-current liabilities | 84 | 247 | 129 | 37 | 36 |
| Long-term borrowings | 53 | 212 | 96 | 4 | 3 |
| Total liabilities | 668 | 914 | 862 | 601 | 429 |
| Total net assets | 348 | 358 | 523 | 2,354 | 2,587 |
| Shareholders’ equity | 348 | 358 | 523 | 2,354 | 2,587 |
| Share capital | 189 | 188 | 206 | 962 | 970 |
| Capital surplus | 180 | 179 | 197 | 953 | 961 |
| Retained earnings | -21 | -10 | 120 | 439 | 669 |
| Treasury shares | -0 | -14 | |||
| Total liabilities and net assets | 1,016 | 1,272 | 1,386 | 2,956 | 3,016 |
| [Statements of cash flows] | |||||
| Cash flow from operating activities | -65 | 174 | 182 | 338 | 94 |
| Cash flow from investing activities | -148 | -13 | -21 | –9 | -46 |
| Cash flow from financing activities | 279 | 59 | -100 | 1,381 | -179 |
| Free cash flow | -213 | 162 | 162 | 328 | 48 |
| Net increase in cash and cash equiv. | 66 | 221 | 61 | 1,710 | -131 |
| Cash and cash equiv. at beginning of period | 297 | 363 | 584 | 645 | 2,356 |
| Cash and cash equiv. at end of period | 363 | 584 | 645 | 2,356 | 2,224 |
Source: Omega Investment from company materials