2026-07-27
Home
Japanese

Omega Investment Co., Ltd.
Kidswell Bio (Company note – 4Q update)

| Share price (5/29) | ¥123 | Dividend Yield (25/3 CE) | – % |
| 52weeks high/low | ¥276/119 | ROE(24/3 act) | -166.6 % |
| Avg Vol (3 month) | 547 thou shrs | Operating margin (24/3 act) | -54.9 % |
| Market Cap | ¥4.7 bn | Beta (5Y Monthly) | N/A |
| Enterprise Value | ¥5.5 bn | Shares Outstanding | 38.939 mn shrs |
| PER (25/3 CE) | – X | Listed market | TSE Growth |
| PBR (24/3 act) | 5.76 X |
| Click here for the PDF version of this page |
| PDF Version |
Despite the risk of a delay in the full-year sales forecast, expectations are high for measures to enhance corporate value
◇ FY2024/3 Full Year Financial Summary:
For FY2024/3, Kidswell Bio (hereafter referred to as “the company”) reported net sales of 2.43 billion yen (down 12% YoY), an operating loss of 1.33 billion yen (compared to a loss of 550 million yen in the previous fiscal year), and a net loss of 1.42 billion yen (a loss of 650 million yen in the previous fiscal year).
Although these figures were slightly below the sales and profit forecasts revised on March 25, there were few surprises as the losses were smaller than the estimates at the beginning of the period before the revision.
Sales decreased from the previous fiscal year. While the biosimilar business made steady progress and obtained manufacturing and marketing approvals for GBS-007 for additional indications and GBS-010, sales were affected by the decline in NHI drug prices, the postponement of delivery dates for some products and changes in payment terms, and the absence of the sales impact from the completion of the master cell bank construction that was recorded in the previous period. In terms of profit and loss, changes in the sales mix of biosimilar products, the depreciation of the yen, and the impact of overseas inflation reduced the profit margin, and an increase in R&D expenses due to steady progress in R&D activities led to an increase in the deficit.
In the cell therapy (regenerative medicine) business, a clinical study for cerebral palsy (chronic stage) was initiated at Nagoya University, a joint research partner, and the first patient was enrolled in October 2023. In FY2024/3, the company completed manufacturing of SHED MCB in compliance with the U.S. FDA standards and is preparing to manufacture investigational products using MCB and is consulting with the Pharmaceuticals and Medical Devices Agency to submit a clinical trial plan by the end of FY2025.
In the BS business , the business operation is supported by proceeds from the issuance of shares due to the exercise of stock acquisition rights of approximately 1.0 billion yen, a net increase in long-term debt of approximately 600 million yen, and an increase in contractual liabilities of approximately 1.1 billion yen due to the change in payment terms as mentioned above. Cash and cash equivalents at the end of the period totaled 2.2 billion yen.
◇ FY2025/3 full-year forecast:
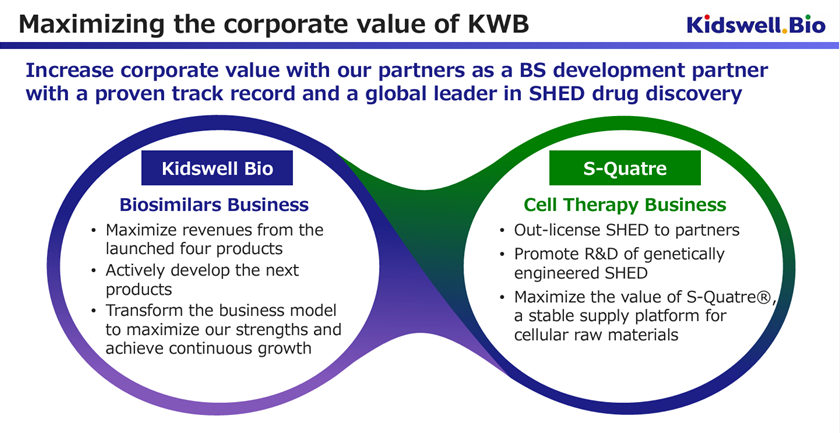
The company will shift to consolidated accounting from FY2025/3. This is because the cell therapy business has been transferred to a new company, S-Quatre Corporation, which was established as a subsidiary on April 1, 2024.
The company’s full-year sales forecast is 3.5 to 4.5 billion yen, which is higher than the initial sales forecast of 3.5 billion yen for the previous fiscal year. In addition to the favorable market environment, such as the expected booking of the deferred portion from the previous fiscal year and strong demand for GBS-007 and GBS-010, the company expects to sign a contract with a potential development partner for cerebral palsy in the cell therapy business, a key growth area, during FY2025/3. These are expected to contribute to the company’s performance and are points to watch closely going forward.
| JPY, mn, % | Net sales | YoY | Oper. | YoY | Ord. | YoY | Profit | YoY | EPS |
| % | profit | % | profit | % | ATOP | % | (¥) | ||
| 2020/3 | 1,077 | – | -1,161 | – | -1,187 | – | -7,316 | – | -264.65 |
| 2021/3 | 996 | -7.5 | -969 | – | -991 | – | -1,001 | – | -34.79 |
| 2022/3 | 1,569 | 62.3 | -651 | – | -968 | – | -535 | – | -17.86 |
| 2023/3 | 2,776 | 76.9 | -550 | – | -624 | – | -657 | – | -20.77 |
| 2024/3 | 2,431 | -12.4 | -1,335 | – | -1,389 | – | -1,422 | – | -40.23 |
| 2025/3 (CE) | 3,500〜4,500 | – | – | – | – | – | – | – | – |
* Consolidated basis from FY2020/3 to FY2022/3. FY2023/3 and FY2024/3 are on a non-consolidated basis. Consolidated basis from FY2025/3.
On the other hand, in addition to the increased R&D costs, the biosimilar business faces unfavorable factors such as NHI price revisions, yen depreciation, overseas inflation, and continued adjustments to the manufacturing and delivery schedule for APIs and other products in response to solid demand. In response, the company appears to be making thorough consultations and adjustments with its pharmaceutical partners and contract manufacturers. In addition, as mentioned above, the company is actively pursuing partnering activities in the cell therapy business. As mentioned above, many uncertainties could have a significant impact on profits, so the company has decided not to disclose its profit forecast.
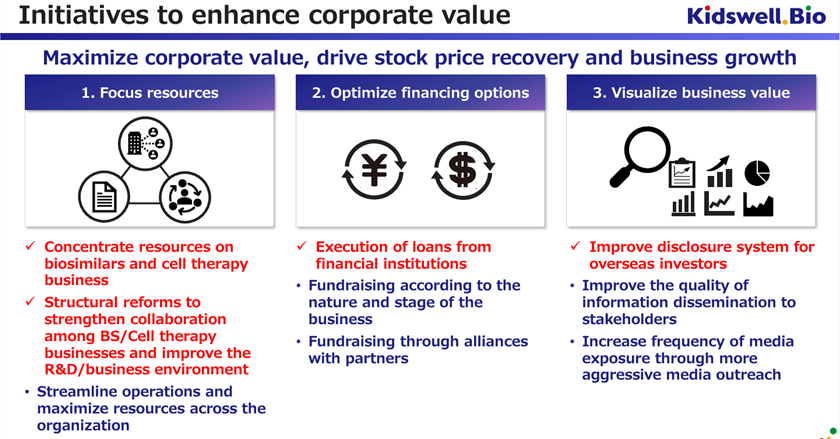
◇ Corporate Value Enhancement Measures:
The company announced its policy of selecting and concentrating its businesses, optimizing financing methods, and visualizing their value. The company will concentrate its management resources on the biosimilar and cell therapy businesses, and in the new biopharmaceutical business, it will promote business development through alliances and collaborations with external parties.
Furthermore, on April 1, 2024, the cell therapy business was spun off into a wholly owned subsidiary, S-Quatre Corporation.
As a result, the biosimilar business, the company’s main business on a stand-alone basis, has already launched four products and is now in the revenue generation phase. The company is expected to be able to smoothly finance its manufacturing working capital through indirect financing and other sources and gain momentum in acquiring new BS projects for the purpose of continued future growth.
S-Quatre Corporation, which was spun off, will promote research and development Stem cells from Human Exfoliated Deciduous teeth (SHED), an advanced modality, and will also engage in fundraising and partnership activities to promote the business. The plan is to apply for a corporate clinical trial by the end of FY2025. As a high-risk, high-return area, it is suitable for equity financing. The new company plans to pursue flexible funding, including obtaining various research and development grants and procurements from business corporations and venture capitalists.
◇ Future Highlights:
The share price has been trading in the 130-160 yen range recently. In the long term, the share price has gradually consolidated since October 2023. This indicates that the company is expanding its biosimilar business lineup and that the potential of its cell therapy business is attracting a certain amount of attention. At the same time, the stock market is waiting for the next catalyst regarding the stabilization of earnings in the biosimilar business and the value of the cell therapy business.
Therefore, future attention will focus on the effects of the company’s concentration and spin-off of the two businesses mentioned above, which began this fiscal year.
Specifically, the following three points are worth noting.
– In the biosimilar business (Kidswell Bio on a non-consolidated basis from this fiscal year onward), whether the company will be able to shift to a system that will steadily generate profits and cash over the medium term even in the face of headwinds such as NHI price cuts, yen depreciation, and overseas inflation by increasing sales of four products already launched and taking appropriate cost measures, and whether the company will gain momentum in developing new product projects
– In the cell therapy business (S-Quatre Corporation from this fiscal year onward), what are the trends in the development of the production system, etc., necessary to steadily file for clinical trials for the same type of SHED in FY2026/3, and whether an alliance agreement with a development partner will be concluded during FY2026/3, and what are the economic conditions (their valuation of the business, the amount of capital raised)?
– Will the company be restrained from raising funds through equity issuance in the future, given the above?
Financial data
FY (¥mn) |
2016/3 |
2017/3 |
2018/3 |
2019/3 |
2020/3 |
2021/3 |
2022/3 |
2023/3 |
2024/3 |
2025/3(CE) |
[Statements of income] |
||||||||||
Net sales |
1,160 |
1,089 |
1,059 |
1,021 |
1,077 |
996 |
1,569 |
2,776 |
2,431 |
3,500~4,500 |
Cost of sales |
500 |
397 |
422 |
412 |
653 |
119 |
550 |
1,250 |
1,391 |
|
Gross profit |
660 |
692 |
637 |
609 |
424 |
876 |
1,018 |
1,525 |
1,039 |
|
SG&A expenses |
1,480 |
1,876 |
1,550 |
1,414 |
1,585 |
1,846 |
1,937 |
2,076 |
2,374 |
|
R&D expenses |
1,075 |
1,433 |
1,107 |
945 |
898 |
963 |
1,150 |
1,216 |
1,453 |
|
Operating loss |
-820 |
-1,184 |
-913 |
-806 |
-1,161 |
-969 |
-919 |
-550 |
-1,335 |
|
Non-operating income |
50 |
35 |
11 |
3 |
1 |
2 |
2 |
3 |
6 |
|
Non-operating expenses |
15 |
27 |
0 |
14 |
27 |
24 |
36 |
77 |
60 |
|
Ordinary loss |
-785 |
-1,176 |
-903 |
-816 |
-1,187 |
-991 |
-952 |
-624 |
-1,389 |
|
Extraordinary income |
|
|
0 |
7 |
5 |
|
418 |
– |
4 |
|
Extraordinary expenses |
|
45 |
|
45 |
6,132 |
8 |
31 |
-35 |
||
Loss before income taxes |
-785 |
-1,222 |
-902 |
-854 |
-7,314 |
-999 |
-533 |
-656 |
-1,420 |
|
Total income taxes |
1 |
2 |
1 |
1 |
2 |
1 |
1 |
1 |
1 |
|
Net loss |
-787 |
-1,224 |
-904 |
-856 |
-7,316 |
-1,001 |
-535 |
-657 |
-1,422 |
|
[Balance Sheets] |
||||||||||
Current assets |
1,520 |
3,421 |
2,692 |
2,821 |
3,322 |
3,346 |
3,325 |
3,697 |
4,924 |
|
Cash and cash equivalents |
817 |
2,379 |
1,891 |
2,009 |
2,032 |
1,461 |
1,187 |
1,067 |
2,231 |
|
Non-current assets |
173 |
284 |
332 |
329 |
269 |
587 |
177 |
197 |
161 |
|
Tangible assets |
2 |
1 |
1 |
1 |
1 |
3 |
1 |
1 |
1 |
|
Investments and other assets |
171 |
282 |
330 |
328 |
267 |
581 |
172 |
193 |
158 |
|
Total assets |
1,694 |
3,706 |
3,025 |
3,151 |
3,592 |
3,933 |
3,503 |
3,894 |
5,085 |
|
Current liabilities |
1,279 |
189 |
404 |
400 |
880 |
1,114 |
1,128 |
1,055 |
2,375 |
|
Short-term borrowings |
810 |
|
|
|
25 |
|
75 |
375 |
737 |
|
Non-current liabilities |
11 |
16 |
16 |
19 |
1,223 |
1,209 |
656 |
1,605 |
1,878 |
|
Total liabilities |
1,290 |
205 |
421 |
420 |
2,104 |
2,323 |
1,784 |
2,661 |
4,254 |
|
Total net assets |
403 |
3,500 |
2,604 |
2,731 |
1,487 |
1,610 |
1,718 |
1,233 |
831 |
|
Total shareholders’ equity |
383 |
3,472 |
2,568 |
2,695 |
1,451 |
1,291 |
1,533 |
1,037 |
669 |
|
Capital stock |
2,037 |
4,194 |
100 |
591 |
611 |
1,032 |
1,421 |
1,509 |
2,036 |
|
Legal capital reserve |
1,940 |
4,097 |
3,372 |
3,864 |
9,917 |
10,337 |
10,726 |
10,815 |
11,342 |
|
Retained earnings |
-3,594 |
-4,818 |
-904 |
-1,760 |
-9,077 |
-10,078 |
-10,613 |
-11,287 |
-12,709 |
|
Evaluation/conversion difference |
-0 |
3 |
2 |
1 |
-21 |
202 |
||||
Subscription rights to shares |
21 |
23 |
32 |
34 |
57 |
116 |
184 |
195 |
161 |
|
Total liabilities and net assets |
1,694 |
3,706 |
3,025 |
3,151 |
3,592 |
3,933 |
3,503 |
3,894 |
5,085 |
|
[Statements of cash flows] |
||||||||||
Cash flow from operating activities |
-607 |
-1,759 |
-438 |
-860 |
-1,325 |
-1,267 |
-1,169 |
-1,421 |
-453 |
|
Loss before income taxes |
-785 |
-1,222 |
-902 |
-854 |
-7,314 |
-999 |
-533 |
-656 |
||
Cash flow from investing activities |
-121 |
-149 |
-50 |
-0 |
-137 |
-22 |
526 |
-28 |
– |
|
Purchase of investment securities |
-116 |
-149 |
|
|
-100 |
|
|
-50 |
||
Cash flow from financing activities |
946 |
3,471 |
|
978 |
1,221 |
718 |
369 |
1,356 |
1,617 |
|
Proceeds from issuance of common shares |
486 |
3,932 |
|
973 |
40 |
138 |
369 |
34 |
||
Net increase in cash and cash equiv. |
217 |
1,562 |
-488 |
118 |
-240 |
-571 |
-273 |
-93 |
||
Cash and cash equiv. at beginning of period |
599 |
817 |
2,379 |
1,891 |
2,009 |
2,032 |
1,461 |
1,160 |
||
Cash and cash equiv. at end of period |
817 |
2,379 |
1,891 |
2,009 |
2,032 |
1,461 |
1,187 |
1,067 |
2,231 |
|
FCF |
-729 |
-1,909 |
-488 |
-860 |
-1,462 |
-1,289 |
-643 |
-1,450 |
-453 |
Note: *Consolidated basis from FY2020/3 to FY2022/3. FY2023/3 and FY2024/3 are on a non-consolidated basis. Consolidated basis from FY2025/3.
Source: Omega Investment from company materials