2026-07-27
Home
Japanese

Omega Investment Co., Ltd.
Itoki (Company note – 1Q update)

| Share price (5/30) | ¥1,560 | Dividend Yield (24/12 CE) | 3.33 % |
| 52weeks high/low | ¥2,200/817 | ROE(23/12 act) | 11.3 % |
| Avg Vol (3 month) | 616 thou shrs | Operating margin (23/12 act) | 6.4 % |
| Market Cap | ¥83.2 bn | Beta (5Y Monthly) | 1.56 |
| Enterprise Value | ¥92.5 bn | Shares Outstanding | 49.100 mn shrs |
| PER (24/12 CE) | 11.9 X | Listed market | TSE Prime |
| PBR (23/12 act) | 1.28 X |
| Click here for the PDF version of this page |
| PDF Version |
Excellent start to the year
◇Summary of FY12/2024 1Q Financial Results: Excellent start of the first quarter to the new medium-term management plan
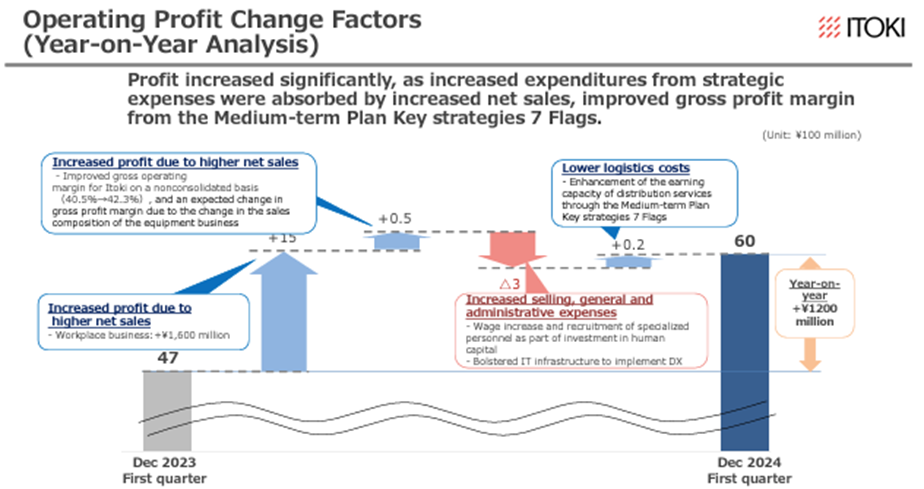
Itoki announced its FY12/2024 1Q results after the close of trading on May 13, 2024, with sales of 40.9 billion yen (+11% YoY), operating profit of 6 billion yen (+26% YoY), and quarterly net profit attributable to owner of parent of 4.1 billion yen (+24% YoY), a significant increase in sales and profit.
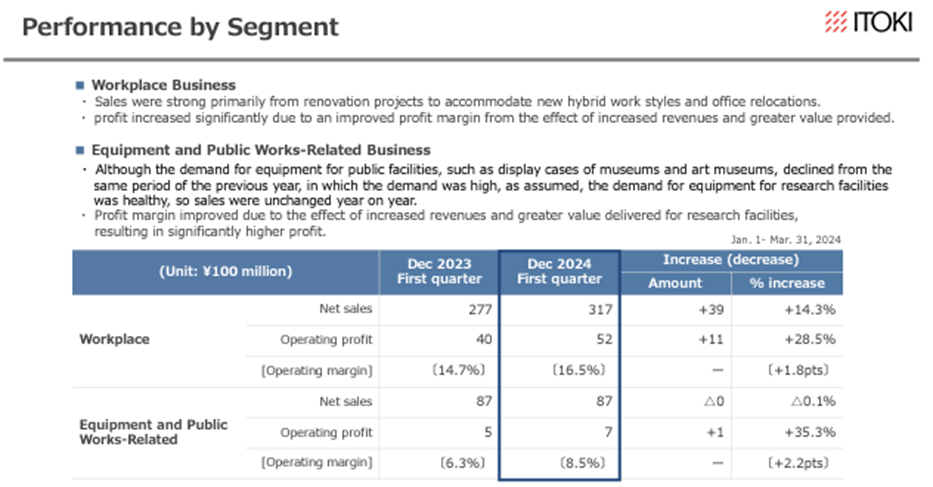
In the mainstay Workplace business, the office renewals and relocations market has been buoyant, reflecting the growing enthusiasm for human capital investment. The company steadily captures office renewal and relocation projects while enhancing customer value and profit margins. The Equipment and Public Works-Related business has also made progress in improving its profit margins, and in general, it is a good start to the new medium-term management plan, with perfect quality and performance.
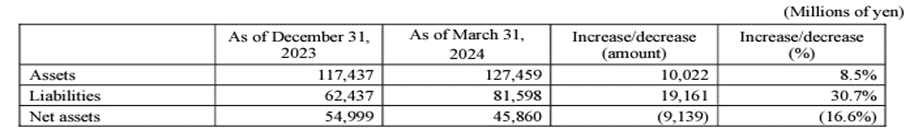
In addition, there have been changes to the balance sheet. Advantage Advisors has exercised its share warrants. In response, the company increased its short-term borrowings repurchased, and canceled its shares. Compared to the end of the previous year, total assets increased by approximately 9%, liabilities increased by approximately 31%, and net assets decreased by approximately 17%. As a result, the equity ratio stood at 35.9% (down 10.9 percentage points YoY). However, with current profitability, net debt does not seem excessive and is expected to lead to a lower cost of capital.
It should also be noted that the number of shares outstanding (excluding treasury shares) stood at 49.1 million at the end of March (+8.3% YoY).
◇FY12/2024 company forecast: Initial company forecasts are unchanged. Price revision from July
The full-year company forecasts remain unchanged (no 2Q forecast disclosed). The company will absorb the cost increase by raising office furniture prices in its catalog by 5-8% from July. This price increase has not been factored into the company’s forecasts. Against solid demand, increased sales increase and improvement of profit margins are expected.
◇ Share Price Trend and Highlights:
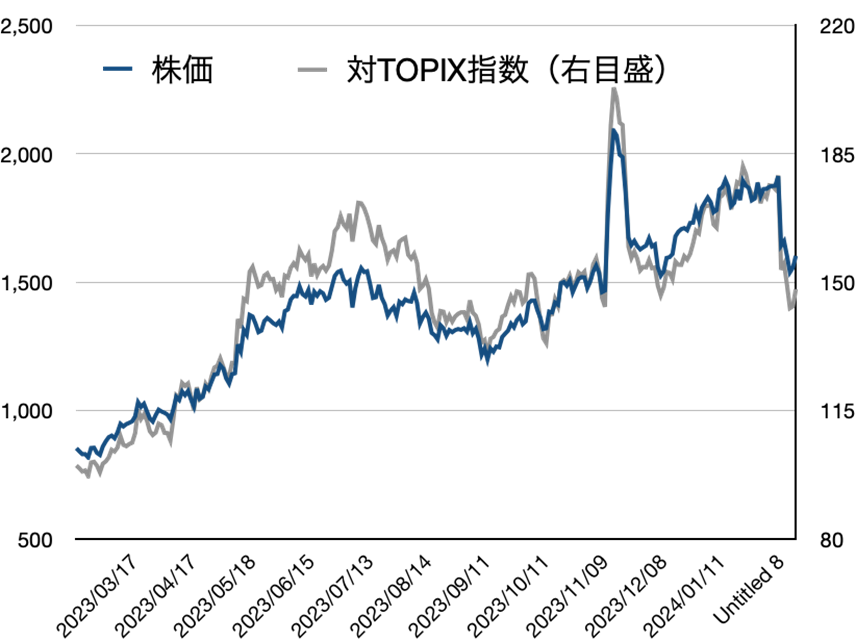
The share price fell following the announcement of the results, naturally reflecting a sell-off by some shareholders who thought the company had “run out of immediate good news,” as there was no upward revision to the full-year forecast, despite the company’s strong 1Q results and good progress against the full-year forecast.
The share price immediately before the announcement of the full-year results and new medium-term plan for FY12/2023 was 1,467 yen. The recent share price adjustment is considered attractive to investors, considering the following. Continued earnings growth with improved management structure, no overheating in the forecast PER, new information expected to be disclosed in the Q2 results, such as progress with ‘7Flags’, shareholder benefits for shareholders at the end of June, and expected effects of price increases not incorporated in the company forecast.
| JPY, mn, % | Net sales | YoY % |
Oper. profit |
YoY % |
Ord. profit |
YoY % |
Profit ATOP |
YoY % |
EPS (¥) |
DPS (¥) |
| 2020/12 | 116,210 | -4.9 | 1,798 | 99.1 | 1,881 | 99.0 | -235 | – | -5.18 | 13.00 |
| 2021/12 | 115,839 | -0.3 | 2,536 | 41.0 | 2,437 | 29.5 | 1,166 | – | 25.82 | 15.00 |
| 2022/12 | 123,324 | 6.4 | 4,582 | 79.0 | 4,177 | 71.4 | 5,294 | 353.9 | 116.99 | 37.00 |
| 2023/12 | 132,985 | 7.8 | 8,523 | 86.0 | 8,555 | 104.8 | 5,905 | 11.5 | 130.29 | 42.00 |
| 2024/12 (CE) | 137,500 | 3.4 | 10,000 | 17.3 | 10,000 | 16.9 | 7,000 | 18.5 | 144.12 | 52.00 |
| 2023/12 1Q | 36,965 | 4.6 | 4,777 | 20.5 | 4,824 | 21.4 | 3,296 | -2.7 | 72.80 | 0 |
| 2024/12 1Q | 40,918 | 10.7 | 6,039 | 26.4 | 6,015 | 24.7 | 4,101 | 24.4 | 85.71 | 0 |
◇Summary of FY12/2024 1Q Financial Results: The first quarter of the new medium-term management plan is off to a good start
Itoki announced its 1Q results for FY12/2024 after the close of trading on May 13, 2024. Sales were 40.9 billion yen (+11% YoY), operating profit was 6 billion yen (+26% YoY), and quarterly net profit attributable to owner of parent was 4.1 billion yen (+24% YoY), a significant increase in sales and profit. The results are presumed to be in line with the company’s initial assumptions.
Source: Omega Investment from company materials
In the mainstay Workplace business, there was evidence of a steady uptake of office renewal and relocation projects. The market has been buoyed by the growing enthusiasm for human capital investment while enhancing customer value and improving profit margins.
Sales remained flat in the Equipment and Public Works-Related business, but profit margins improved.
Overall, the quarterly results are perfect in quality and quantity and are an excellent start to the new medium-term management plan.
Source: Omega Investment from company materials
◇Summary of FY12/2024 1Q Financial Results: The first quarter of the new medium-term management plan is off to a good start
In addition, there have been changes to the balance sheet.
Advantage Advisors exercised its share warrants. In response, the company increased its short-term borrowings, carried out a share buyback, and canceled its shares. Compared to the end of the previous year, total assets increased by approximately 9%, liabilities increased by approximately 31%, and net assets decreased by approximately 17%. As a result, the equity ratio stood at 35.9% (down 10.9 percentage points YoY).
Source: Omega Investment from company materials
However, this decline in the equity ratio should not be considered a cause for concern at present. The net debt at the end of March was around 13.9 billion yen, but this is seen as more than one times the EBITDA for the year, so it is unlikely to be excessive. Instead, it is expected to lead to a reduction in the cost of capital.
It should also be noted that the number of shares outstanding (excluding treasury shares) was 49.1 million at the end of March (up 8.3% YoY). For the full year, the company expects net profit attributable to owner of parent to increase by 19% YoY. Therefore, even considering the actual increase in the number of shares, earnings per share will increase by approximately 10%, and there is little risk of dilution.
◇FY12/2024 company forecast: Initial earnings guidance is unchanged. Price revision from July
Full-year company forecast figures remain unchanged (no 2Q forecast disclosed).
The company will absorb the cost increase by raising office furniture prices in its catalog by 5-8% from July. This move is also being seen at other companies and is based on the assumption that there will be strong demand for office renewals. Therefore, the company expects an increase in sales and profitability. According to the company, the price increase has not been factored into the company’s forecasts and could lead to an upward swing in earnings.
◇ Share Price Trend and Highlights:
The company’s share price fell following the announcement of these results. Rather than being disappointed by the 1Q results, it is more natural to consider this as follows: After giving high marks to the 1Q results, the lack of upward revisions despite steady progress against the company’s full-year forecast led some shareholders to sell, believing that the company had run out of good news for the time being.
The share price was 1,467 yen just before the announcement of the full-year results and the new medium-term management plan for FY12/2023, and the share price is currently hovering around this level.
However, considering the following, the recent share price approaching JPY 1,467 is considered attractive to many investors. The company’s performance continues to expand with an improved management structure, and the forecast PER is not overheated; new information is expected to be disclosed in the Q2 results, such as the progress of ‘7Flags’, the company is being managed with an awareness of the cost of capital, aiming for an optimal capital structure through the use of debt, shareholder benefits for shareholders at the end of June will be implemented, and the effect of a price increase, which is not incorporated in the company’s forecast, is expected to kick in.
Financial data (quarterly basis)
| FY (¥mn) | 2021/12 | 2022/12 | 2023/12 | 2024/12 | ||||||||||||
| 1Q | 2Q | 3Q | 4Q | 1Q | 2Q | 3Q | 4Q | 1Q | 2Q | 3Q | 4Q | 1Q | 2Q | 3Q | 4Q | |
| [Statements of income] | ||||||||||||||||
| Net sales | 32,167 | 29,468 | 22,412 | 31,858 | 35,345 | 28,411 | 26,205 | 33,363 | 36,965 | 31,225 | 28,667 | 36,128 | 40,918 | |||
| Year-on-year basis (%) | -14.7 | 9.2 | 4.3 | 6.1 | 9.9 | -3.6 | 16.9 | 4.7 | 4.6 | 9.9 | 9.4 | 8.3 | 10.7 | |||
| Cost of sales | 20,101 | 18,729 | 14,443 | 20,872 | 21,483 | 18,030 | 16,678 | 21,384 | 22,216 | 18,954 | 17,483 | 22,091 | 24,545 | |||
| Gross profit | 12,020 | 10,722 | 7,953 | 10,999 | 13,862 | 10,381 | 9,527 | 11,979 | 14,748 | 12,271 | 11,184 | 14,037 | 16,372 | |||
| SG&A expenses | 10,352 | 9,453 | 9,203 | 10,150 | 9,898 | 9,973 | 9,812 | 11,484 | 9,970 | 10,047 | 11,006 | 12,694 | 10,333 | |||
| Operating income | 1,698 | 1,275 | -1,242 | 829 | 3,964 | 407 | -285 | 496 | 4,777 | 2,225 | 177 | 1,344 | 6,039 | |||
| Year-on-year basis (%) | -43.4 | – | – | -23.2 | 133.4 | -68.7 | – | -40.2 | 20.5 | 446.7 | – | 171.0 | 26.4 | |||
| Operating profit ratio (%) | 5.3 | 4.3 | -5.5 | 2.6 | 11.2 | 1.4 | -1.1 | 1.5 | 12.9 | 7.1 | 0.8 | 3.7 | 14.8 | |||
| Non-operating income | 240 | 161 | 171 | 122 | 125 | 164 | 171 | 96 | 125 | 114 | 141 | 101 | 78 | |||
| Non-operating expenses | 250 | 257 | 101 | 185 | 115 | 130 | 177 | 539 | 79 | 68 | 52 | 249 | 102 | |||
| Ordinary income | 1,657 | 1,173 | -1,179 | 786 | 3,974 | 442 | -291 | 52 | 4,824 | 2,271 | 265 | 1,195 | 6,015 | |||
| Extraordinary income | 1,255 | 78 | 133 | 88 | 786 | 139 | 118 | 6,762 | 1 | 15 | 120 | 50 | 0 | |||
| Extraordinary expenses | 20 | 456 | 518 | 1,474 | 44 | 64 | 38 | 3,465 | 21 | 10 | 24 | 308 | 10 | |||
| Income before income taxes | 2,893 | 795 | -1,565 | -600 | 4,716 | 516 | -211 | 3,351 | 4,804 | 2,275 | 363 | 936 | 6,006 | |||
| Total income taxes | 1,028 | 490 | -132 | -796 | 1,381 | 246 | -21 | 1,585 | 1,506 | 864 | 161 | -60 | 1,901 | |||
| Net income | 1,942 | 348 | -1,440 | 316 | 3,388 | 288 | -159 | 1,777 | 3,296 | 1,411 | 202 | 996 | 4,101 | |||
| Year-on-year basis (%) | 10 | – | – | 496.2 | 74.4 | -17.2 | – | 462.3 | -2.7 | 389.9 | – | -44.0 | 24.4 | |||
| Net income ratio (%) | 6.0 | 1.2 | -6.4 | 1.0 | 9.6 | 1.0 | -0.6 | 5.3 | 8.9 | 4.5 | 0.7 | 2.8 | 10.0 | |||
| [Balance Sheets] | ||||||||||||||||
| Current assets | 65,543 | 62,170 | 55,249 | 57,753 | 69,458 | 64,096 | 59,873 | 71,027 | 72,230 | 68,755 | 68,040 | 73,304 | 81,922 | |||
| Cash and deposits | 19,503 | 22,112 | 18,213 | 17,351 | 19,196 | 20,073 | 17,138 | 26,876 | 20,898 | 24,688 | 23,192 | 24,795 | 24,751 | |||
| Notes and accounts receivable - trade |
32,061 | 26,596 | 21,385 | 26,783 | – | – | – | – | – | – | – | – | ||||
| Notes and accounts receivable - trade, and contract assets |
– | – | – | – | 35,205 | 28,234 | 24,111 | 29,316 | 34,519 | 28,377 | 26,948 | 31,158 | 37,599 | |||
| Non-current assets | 46,925 | 46,369 | 46,046 | 46,144 | 46,647 | 47,395 | 48,126 | 44,260 | 43,611 | 42,918 | 43,533 | 44,132 | 45,537 | |||
| Property, plant and equipment | 25,184 | 24,779 | 24,887 | 24,417 | 25,105 | 26,042 | 26,932 | 24,978 | 24,689 | 24,952 | 24,730 | 24,792 | 24,735 | |||
| Intangible assets | 5,504 | 5,419 | 4,885 | 4,114 | 4,128 | 4,168 | 4,145 | 1,819 | 1,837 | 1,884 | 2,161 | 2,292 | 3,355 | |||
| Goodwill | 2,018 | 2,016 | 1,407 | 1,317 | 1,214 | 1,222 | 1,200 | 517 | 446 | 391 | 346 | 341 | 983 | |||
| Investments and other assets | 16,236 | 16,170 | 16,273 | 17,612 | 17,413 | 17,184 | 17,048 | 17,462 | 17,084 | 16,080 | 16,641 | 17,048 | 17,446 | |||
| Total assets | 112,469 | 108,540 | 101,295 | 103,898 | 116,105 | 111,492 | 108,000 | 115,288 | 115,841 | 111,693 | 111,573 | 117,437 | 127,459 | |||
| Current liabilities | 49,245 | 45,266 | 40,307 | 42,544 | 51,837 | 47,138 | 43,655 | 49,099 | 47,854 | 42,547 | 42,010 | 47,340 | 69,174 | |||
| Short-term borrowings | 13,458 | 12,061 | 12,409 | 12,500 | 15,014 | 11,976 | 11,738 | 11,239 | 10,874 | 10,299 | 10,383 | 10,276 | 34,899 | |||
| Non-current liabilities | 17,506 | 17,088 | 16,257 | 16,277 | 16,334 | 16,020 | 16,178 | 16,278 | 16,238 | 15,727 | 15,724 | 15,096 | 12,424 | |||
| Long-term borrowings | 8,711 | 8,193 | 7,435 | 7,591 | 7,427 | 7,174 | 7,266 | 7,530 | 7,453 | 7,062 | 6,959 | 6,577 | 3,763 | |||
| Total liabilities | 66,751 | 62,354 | 56,565 | 58,822 | 68,172 | 63,158 | 59,833 | 65,377 | 64,092 | 58,275 | 57,734 | 62,437 | 81,598 | |||
| Total net assets | 45,717 | 46,186 | 44,730 | 45,076 | 47,933 | 48,333 | 48,166 | 49,910 | 51,748 | 53,418 | 53,839 | 54,999 | 45,860 | |||
| Shareholders’ equity | 45,047 | 45,419 | 43,979 | 44,301 | 47,249 | 47,567 | 47,408 | 49,185 | 50,806 | 52,267 | 52,469 | 54,960 | 45,818 | |||
| Share capital | 5,294 | 5,294 | 5,294 | 5,294 | 5,294 | 5,294 | 5,294 | 5,294 | 5,294 | 5,294 | 5,294 | 5,294 | 7,351 | |||
| Capital surplus | 9,628 | 9,632 | 9,632 | 9,638 | 9,638 | 9,638 | 9,638 | 9,638 | 9,638 | 9,665 | 9,665 | 9,665 | 11,692 | |||
| Retained earnings | 30,306 | 30,654 | 29,213 | 29,530 | 32,477 | 32,769 | 32,610 | 34,387 | 36,008 | 37,419 | 37,621 | 38,617 | 33,111 | |||
| Treasury shares | -182 | -161 | -161 | -161 | -161 | -134 | -134 | -134 | -314 | -111 | -111 | -111 | -8,278 | |||
| Share acquisition rights | 45 | 45 | 45 | 45 | 45 | 45 | 45 | 45 | 45 | 45 | 45 | 45 | 0 | |||
| Total liabilities and net assets | 112,469 | 108,540 | 101,295 | 103,898 | 116,105 | 111,492 | 108,000 | 115,288 | 115,841 | 111,693 | 111,573 | 117,437 | 127,459 | |||
| [Statements of cash flows] | ||||||||||||||||
| Cash flow from operating activities | 4,577 | -1,803 | 4,581 | 1,223 | 4,078 | 2,243 | ||||||||||
| Cash flow from investing activities | 503 | -1,673 | -1,410 | 6,333 | -3,265 | -747 | ||||||||||
| Cash flow from financing activities | -1,418 | -1,240 | -661 | -765 | -3,266 | -882 | ||||||||||
| Free cash flow | 5,080 | -3,476 | 3,171 | 7,556 | 813 | 1,496 | ||||||||||
| Net increase in cash and cash equiv. | 3,787 | -4,687 | 2,630 | 6,911 | -2,466 | 711 | ||||||||||
| Cash and cash equiv. at beginning of period | 16,697 | 20,485 | 15,797 | 18,509 | 25,420 | 22,953 | ||||||||||
| Cash and cash equiv. at end of period | 20,485 | 15,797 | 18,509 | 25,420 | 22,953 | 23,664 | ||||||||||
Source: Omega Investment from company materials
Financial data (full-year basis)
| FY (¥mn) | 2013/12 | 2014/12 | 2015/12 | 2016/12 | 2017/12 | 2018/12 | 2019/12 | 2020/12 | 2021/12 | 2022/12 | 2023/12 |
| [Statements of income] | |||||||||||
| Net sales | 103,461 | 102,993 | 106,516 | 101,684 | 108,684 | 118,700 | 122,174 | 116,210 | 115,839 | 123,324 | 132,985 |
| Year-on-year basis (%) | -1.9 | -0.5 | 3.4 | -4.5 | 6.9 | 9.2 | 2.9 | -4.9 | -0.3 | 6.4 | 7.8 |
| Cost of sales | 67,118 | 66,797 | 68,374 | 65,021 | 69,966 | 77,436 | 80,495 | 74,322 | 74,145 | 77,575 | 80,744 |
| Gross profit | 36,343 | 36,196 | 38,142 | 36,663 | 38,718 | 41,264 | 41,679 | 41,888 | 41,694 | 45,749 | 52,240 |
| Gross profit ratio (%) | 35.1 | 35.1 | 35.8 | 36.1 | 35.6 | 34.8 | 34.1 | 36.0 | 36.0 | 37.1 | 39.3 |
| SG&A expenses | 32,203 | 33,723 | 33,836 | 33,862 | 35,761 | 39,339 | 40,776 | 40,089 | 39,158 | 41,167 | 43,717 |
| Operating income | 4,140 | 2,472 | 4,306 | 2,800 | 2,956 | 1,925 | 903 | 1,798 | 2,536 | 4,582 | 8,523 |
| Operating profit ratio (%) | 4.0 | 2.4 | 4.0 | 2.8 | 2.7 | 1.6 | 0.7 | 1.5 | 2.2 | 3.7 | 6.4 |
| Non-operating income | 813 | 841 | 898 | 771 | 750 | 889 | 677 | 804 | 694 | 556 | 481 |
| Non-operating expenses | 528 | 495 | 605 | 483 | 412 | 448 | 634 | 720 | 793 | 961 | 448 |
| Ordinary income | 4,425 | 2,818 | 4,599 | 3,087 | 3,295 | 2,365 | 945 | 1,881 | 2,437 | 4,177 | 8,555 |
| Extraordinary income | 685 | 615 | 171 | 97 | 228 | 919 | 27 | 1,111 | 1,554 | 7,805 | 186 |
| Extraordinary expenses | 238 | 262 | 524 | 267 | 121 | 204 | 35 | 1,716 | 2,468 | 3,611 | 363 |
| Income before income taxes | 4,872 | 3,171 | 4,246 | 2,918 | 3,401 | 3,081 | 938 | 1,277 | 1,523 | 8,372 | 8,378 |
| Total income taxes | 876 | 813 | -385 | 1,068 | 959 | 1,339 | 1,517 | 1,632 | 590 | 3,191 | 2,471 |
| Net income | 3,910 | 2,160 | 4,530 | 1,907 | 2,402 | 1,722 | -550 | -235 | 1,166 | 5,294 | 5,905 |
| Net income ratio (%) | 3.8 | 2.1 | 4.3 | 1.9 | 2.2 | 1.5 | -0.5 | -0.2 | 1.0 | 4.3 | 4.4 |
| ROE(%) | 10.2 | 5.2 | 10.4 | 4.2 | 5.2 | 3.7 | -1.2 | -0.5 | 2.6 | 11.1 | 11.3 |
| [Balance Sheets] | |||||||||||
| Current assets | 52,925 | 55,714 | 56,342 | 52,410 | 58,147 | 62,143 | 58,109 | 57,183 | 57,753 | 71,027 | 73,304 |
| Cash and deposits | 19,553 | 21,211 | 21,456 | 19,839 | 19,977 | 16,229 | 17,030 | 18,246 | 17,351 | 26,876 | 24,795 |
| Notes and accounts receivable - trade |
26,243 | 25,965 | 26,138 | 23,241 | 26,869 | 33,160 | 28,244 | 26,599 | 26,783 | ||
| Notes and accounts receivable - trade, and contract assets |
29,316 | 31,158 | |||||||||
| Non-current assets | 42,335 | 41,007 | 41,832 | 43,271 | 44,073 | 46,559 | 49,955 | 47,912 | 46,144 | 44,260 | 44,132 |
| Property, plant and equipment | 28,193 | 27,041 | 26,395 | 25,322 | 24,426 | 26,362 | 27,781 | 26,206 | 24,417 | 24,978 | 24,792 |
| Intangible assets | 1,230 | 1,109 | 1,313 | 1,142 | 3,651 | 4,437 | 4,945 | 5,590 | 4,114 | 1,819 | 2,292 |
| Goodwill | 34 | 26 | 240 | 208 | 2,793 | 3,005 | 2,413 | 2,093 | 1,317 | 517 | 341 |
| Investments and other assets | 12,911 | 12,857 | 14,123 | 16,806 | 15,995 | 15,760 | 17,229 | 16,116 | 17,612 | 17,462 | 17,048 |
| Total assets | 95,261 | 96,721 | 98,175 | 95,681 | 102,221 | 108,703 | 108,778 | 105,096 | 103,898 | 115,288 | 117,437 |
| Current liabilities | 35,359 | 36,677 | 36,106 | 35,390 | 39,683 | 45,133 | 47,559 | 43,646 | 42,544 | 49,099 | 47,340 |
| Short-term borrowings | 11,473 | 11,087 | 10,940 | 11,760 | 12,564 | 11,721 | 15,533 | 13,234 | 12,500 | 11,239 | 10,276 |
| Non-current liabilities | 16,874 | 16,854 | 14,756 | 14,888 | 15,211 | 16,076 | 15,385 | 17,259 | 16,277 | 16,278 | 15,096 |
| Long-term borrowings | 5,124 | 5,089 | 5,171 | 5,296 | 5,328 | 5,113 | 6,633 | 8,508 | 7,591 | 7,530 | 6,577 |
| Total liabilities | 52,234 | 53,532 | 50,863 | 50,278 | 54,894 | 61,210 | 62,944 | 60,906 | 58,822 | 65,377 | 62,437 |
| Total net assets | 43,026 | 43,189 | 47,311 | 45,402 | 47,326 | 47,492 | 45,834 | 44,189 | 45,076 | 49,910 | 54,999 |
| Shareholders’ equity | 41,079 | 41,632 | 45,677 | 44,949 | 46,863 | 46,854 | 45,370 | 43,812 | 44,931 | 49,871 | 54,960 |
| Share capital | 5,277 | 5,277 | 5,277 | 5,277 | 5,277 | 5,277 | 5,294 | 5,294 | 5,294 | 5,294 | 5,294 |
| Capital surplus | 13,061 | 13,061 | 13,222 | 13,140 | 12,404 | 9,786 | 9,201 | 9,628 | 9,638 | 9,638 | 9,665 |
| Retained earnings | 22,073 | 23,556 | 29,223 | 30,504 | 32,315 | 31,104 | 29,862 | 28,950 | 29,530 | 34,387 | 38,617 |
| Treasury shares | -833 | -834 | -3,000 | -4,700 | -4,701 | 0 | -46 | -182 | -161 | -134 | -111 |
| Share acquisition rights | 45 | 45 | 45 | 45 | |||||||
| Total liabilities and net assets | 95,261 | 96,721 | 98,175 | 95,681 | 102,221 | 108,703 | 108,778 | 105,096 | 103,898 | 115,288 | 117,437 |
| [Statements of cash flows] | |||||||||||
| Cash flow from operating activities | 3,162 | 5,715 | 4,522 | 5,072 | 3,565 | 1,384 | 3,586 | 4,561 | 2,774 | 5,804 | 6,321 |
| Cash flow from investing activities | -1,978 | -1,742 | -803 | -4,044 | -2,971 | -3,094 | -3,221 | -1,152 | -1,170 | 4,923 | -4,012 |
| Cash flow from financing activities | 51 | -2,179 | -3,807 | -2,571 | -706 | -2,463 | 0 | -2,267 | -2,658 | -1,426 | -4,148 |
| Free cash flow | 1,184 | 3,973 | 3,719 | 1,028 | 594 | -1,710 | 365 | 3,409 | 1,604 | 10,727 | 2,309 |
| Net increase in cash and cash equiv. | 1,944 | 1,814 | 184 | -1,619 | 88 | -4,031 | 952 | 1,203 | -900 | 9,622 | -1,755 |
| Cash and cash equiv. at beginning of period | 16,156 | 18,102 | 19,918 | 20,103 | 18,483 | 18,571 | 14,540 | 15,494 | 16,697 | 15,797 | 25,420 |
| Cash and cash equiv. at end of period | 18,102 | 19,918 | 20,103 | 18,483 | 18,571 | 14,540 | 15,494 | 16,697 | 15,797 | 25,420 | 23,664 |
Source: Omega Investment from company materials