2026-04-02
Home
Japanese

Omega Investment Co., Ltd.
Sportsfield (Company note – 2Q update)

| Share price (9/19) | ¥603 | Dividend Yield (24/12 CE) | 2.6 % |
| 52weeks high/low | ¥571/923 | ROE(23/12 act) | 56.1 % |
| Avg Vol (3 month) | 55 thou shrs | Operating margin (23/12) | 25.4 % |
| Market Cap | ¥4.4 bn | Beta (5Y Monthly) | 1.3 |
| Enterprise Value | ¥2.7 bn | Shares Outstanding | 7.37 mn shrs |
| PER (24/12 CE) | 7.5 X | Listed market | TSE Growth |
| PBR (23/12 act) | 2.7 X |
| Click here for the PDF version of this page |
| PDF version |
2Q results for FY12/2024 show an increase in revenues and a decrease in profits. Expect a turnaround in the second half of the year.
◇ 2Q FY12/2024 financial highlights
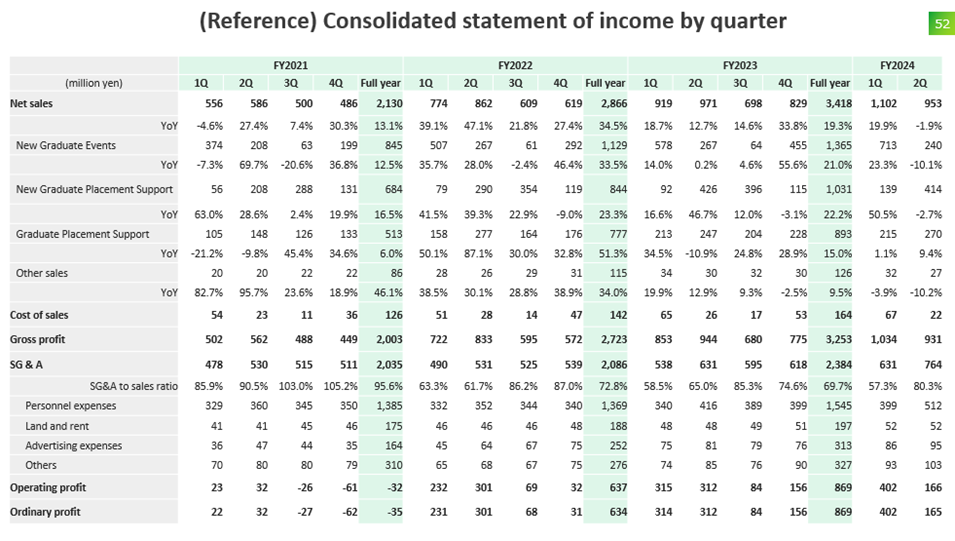
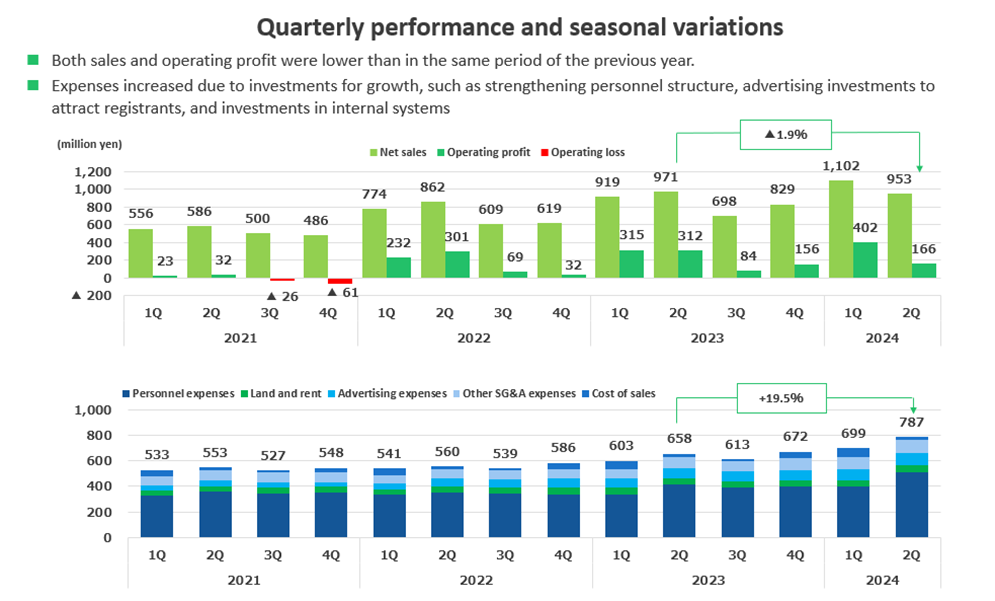
In the 2Q results (cumulative) for FY12/2024 announced by Sportsfield on 9 August 2024, net sales were 2.05 billion yen (+8% YoY), operating profit was 560 million yen (-9% YoY), ordinary profit was 560 million yen (-9% YoY), and net profit attributable to owner of the parent was 360 million yen (-10% YoY). In 2Q (Apr-Jun), sales were 950 million yen (-1% YoY), operating profit was 160 million yen (-46% YoY), and ordinary profit was 160 million yen (-47% YoY), struggling to advance vis-a-vis 1Q.
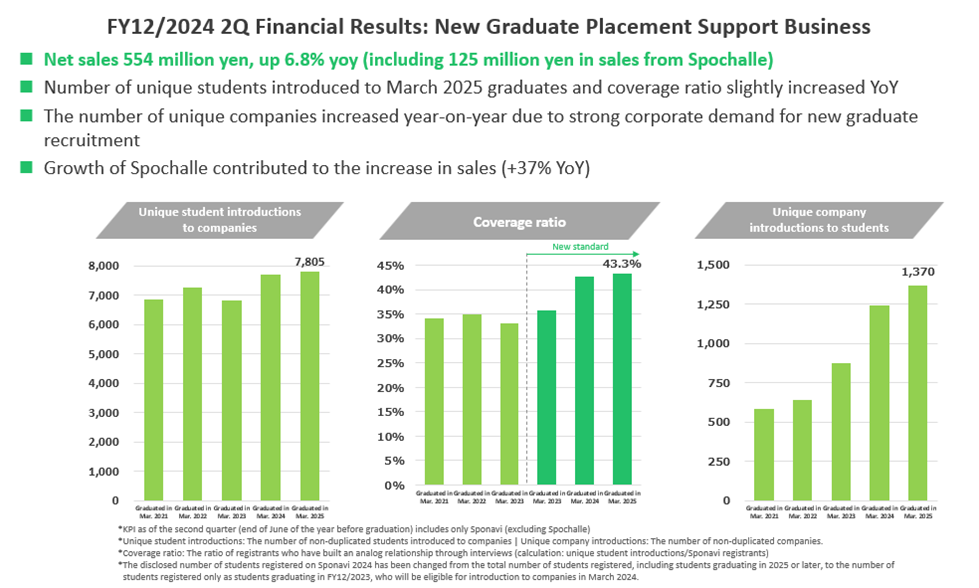
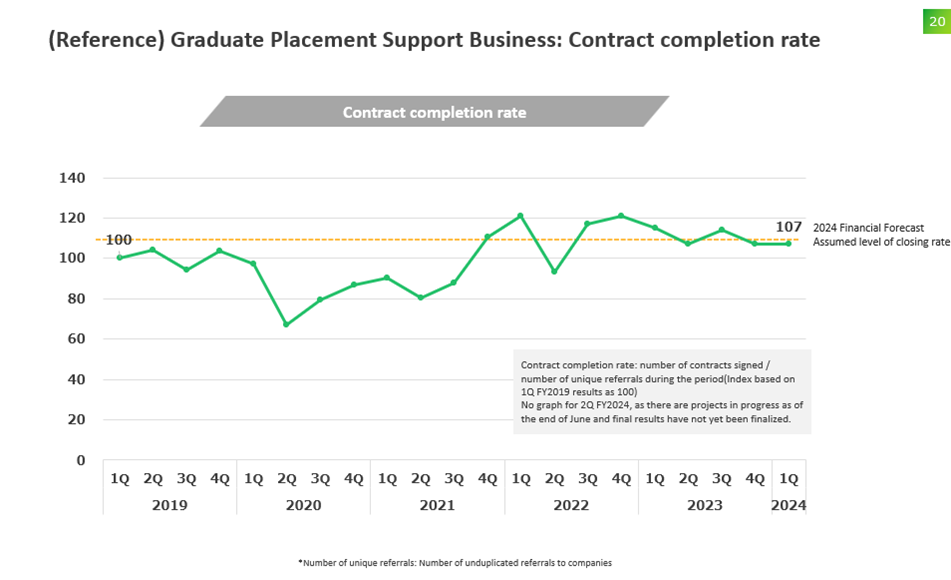
Firstly, to summarise the positive factors, the company’s total sales for the first half of the year and its main businesses – New Graduate Events, New Graduate Placement Support and Graduate Placement Support – all reached record highs, and although ordinary profit fell, the ordinary profit margin on sales was 27.6%, which is in the mid-20% range, which is the company’s target level. Profits, on the other hand, unfortunately declined. This was due, firstly, to sluggish sales growth in the New Graduate Placement Support business (due to slow growth in the number of unique student introductions for the mainstay Sponavi and a YoY decline in its closing ratio; although this has been supported to a certain extent by Spochalle). The second factor was increased personnel costs due to new graduate and mid-career hires and increased performance-linked bonuses. Staff augmentation and appropriate remuneration payments are essential for continued internal growth. The key question is sales; we expect sales in New Graduate Placement Support business to pick up firmly. It should be noted that sales in the New Graduate Events and Graduate Placement Support businesses are in line with expectations, which is a reassuring sign.
◇ Full-year company forecasts
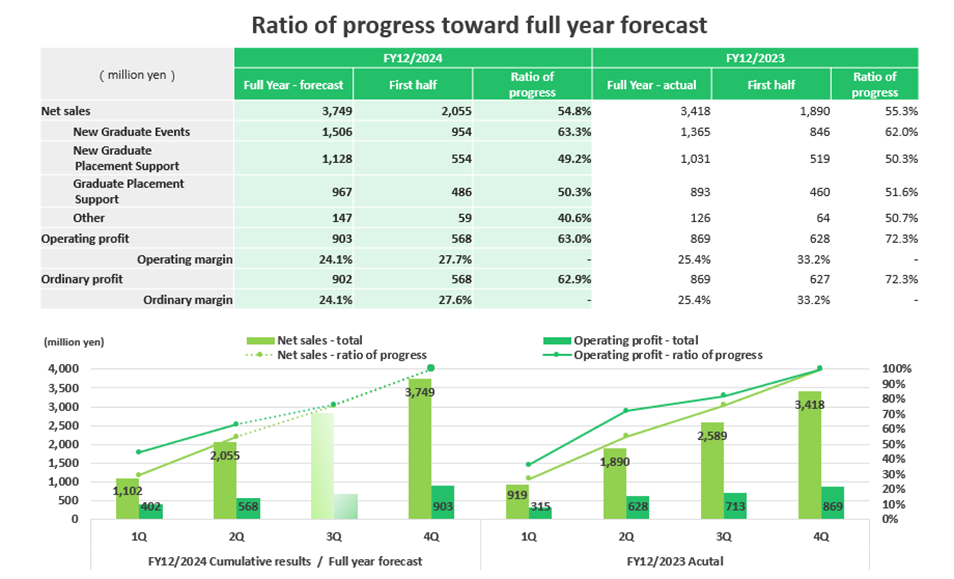
The company’s forecasts for FY2024 remain unchanged from those at the beginning of the year. The company forecasts sales of 3.74 billion (+9% YoY), operating profit of 0.90 billion yen (+3% YoY), ordinary profit of 0.90 billion yen (+3% YoY) and net profit attributable to owner of the parent of 0.58 billion yen (-3% YoY).
Looking at the progress ratio of H1 results to full-year results and forecasts, 54.8% of sales estimate (55.3% in the previous year; similarly below), 63.0% of operating profit target (72.3%) and 62.9% of ordinary profit estimate (72.3%), so a turnaround of profits is critical.
◇ Decision on share buyback
The company decided on 20 August to buy back its shares. The maximum number of shares to be repurchased is 185,000 (2.5% of outstanding shares), the total amount to be repurchased is up to 100 million yen, the repurchase period is from 21 August 2024 to 31 October 2024, and the shares will be purchased on the market.
◇ Share price trends and future points of interest
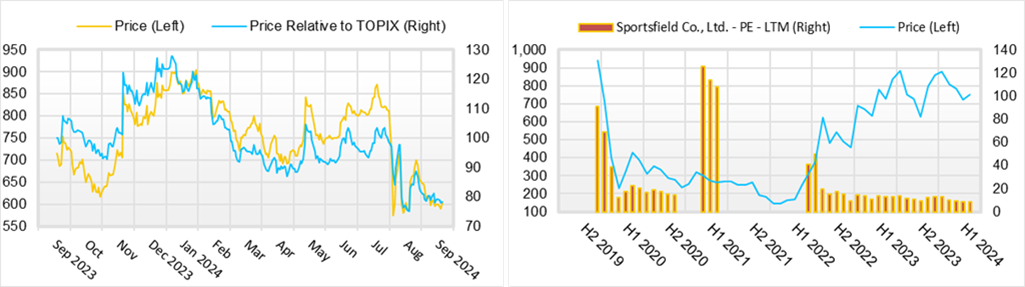
The share price has been in a box range of approximately 600-900 yen since 2023, but the company’s share price temporarily fell to 575 yen as the overall stock market plunged on 2 and 5 August. Although the stock market has since rebounded, the company’s share price hit a yearly low of 571 yen on 15 August in response to the latest results. Although the share price has recently recovered to the high 600 yen range, partly due to the above-mentioned share buyback announcement, it has not kept pace with the stock market’s recovery as a whole.
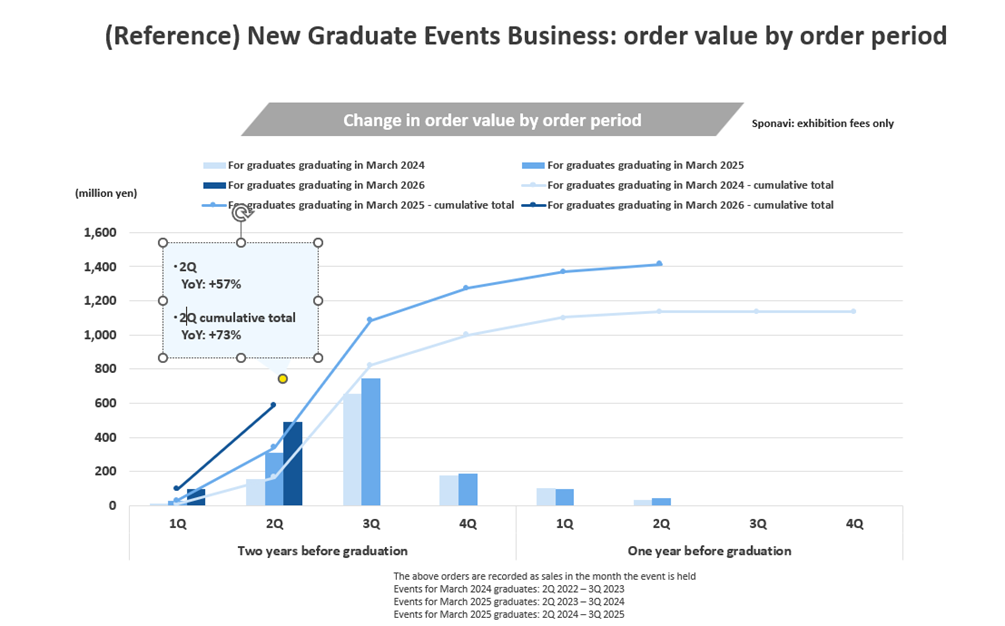
The first point to watch going forward is the certainty of the forecasts for the current year. In the 3Q, sales of the New Graduate Placement Support business for new graduates are usually the key, and in the 4Q, sales of the New Graduate Events business are the key, so the key point is whether these businesses will grow as expected. For the latter, orders for New Graduate Events in March 2026, which are performing well, will provide a tailwind. Labour productivity and overall cost control will be one of the key points to watch.
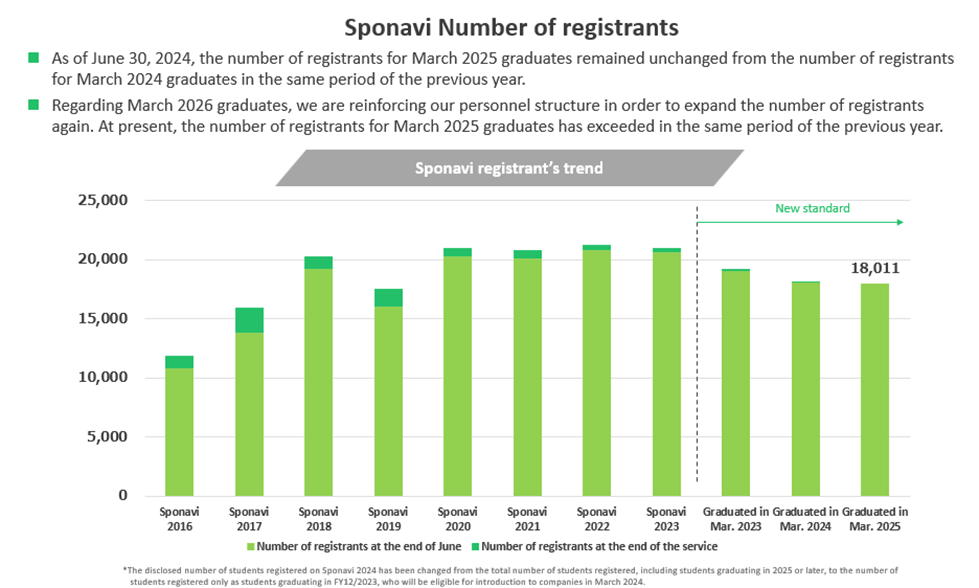
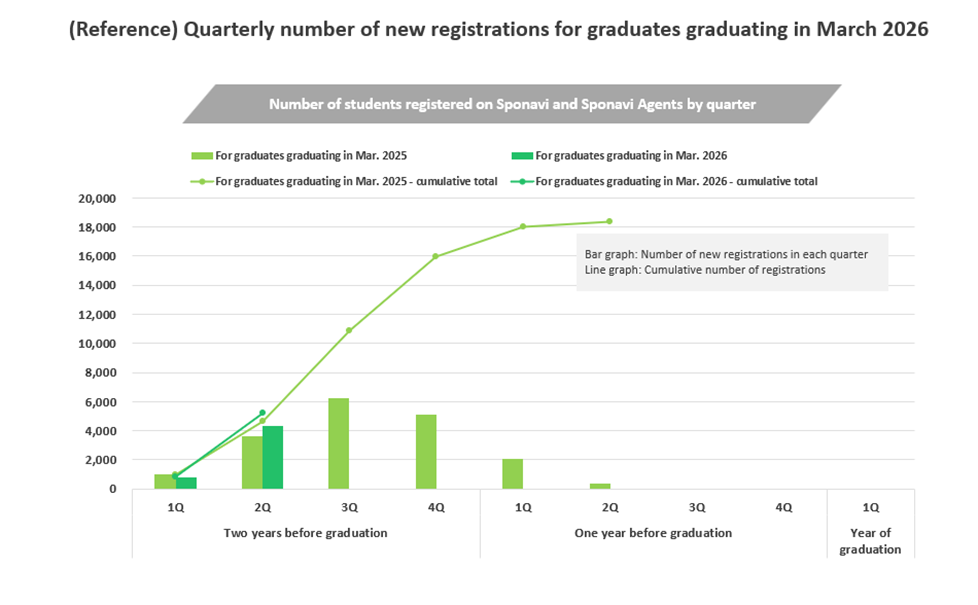
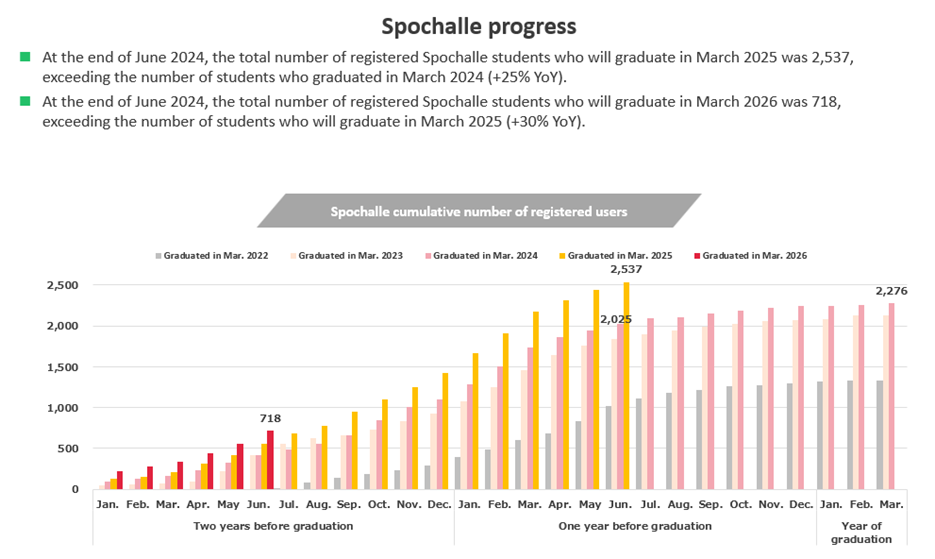
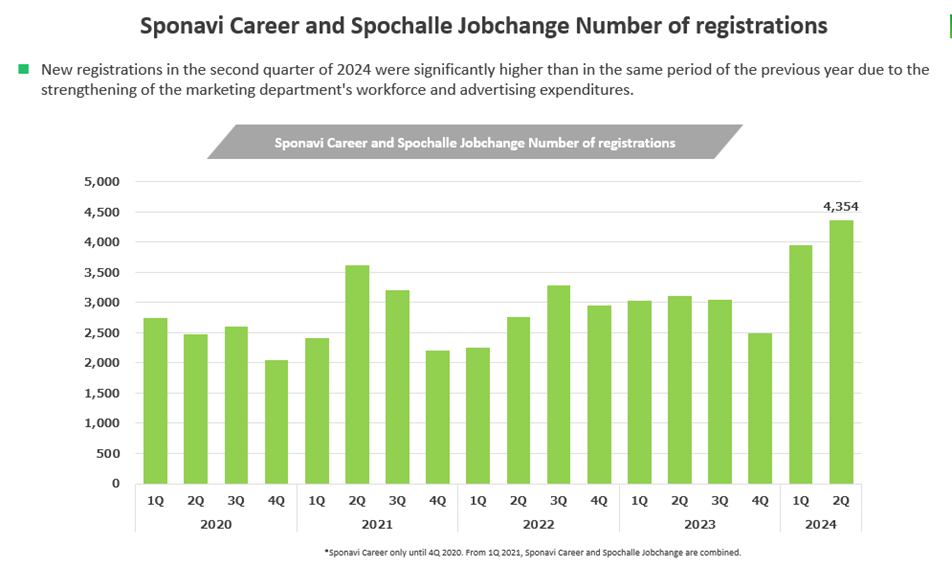
Second, KPIs build up towards FY12/2025. According to the financial results, the cumulative number of students registered on Sponavi and others for students graduating in March 2026 and the cumulative number of students registered on Sponchalle have exceeded the progress during FY3/2025. The number of registrations for Sponavi Career and Spochare job changes is also steady, and we expect further upside in these.
Finally, the forthcoming new medium-term management plan. The period of the current medium-term management plan ends with the current financial year, and we look forward to the contents of the new medium-term management plan, which is expected to be disclosed when the 4Q results are announced. The contents of the measures to expand business, increase market capitalisation and improve share liquidity, which are necessary to aim for the prime market, will be a focus of attention.
Company profile
Sportsfield Co., Ltd. operates placement services for student-athletic teams and students with sports experience and placement services for these sports human capital graduates. The company’s main businesses are New Graduate Events, New Graduate Placement Support and Graduate Placement Support. The new graduate business is characterised by the detailed support provided by the company’s employees to registered students. Financially, the company has achieved growth while maintaining a high operating margin and return on equity.
Key financial data
| Unit: million yen | 2019/12 | 2020/12 | 2021/12 | 2022/12 | 2023/12 | 2024/12 CE |
| Sales | 1,918 | 1,883 | 2,130 | 2,866 | 3,418 | 3,749 |
| EBIT (Operating Income) | 194 | 16 | -32 | 637 | 870 | 903 |
| Pretax Income | 192 | 32 | -81 | 634 | 869 | 902 |
| Net Profit Attributable to Owner of Parent | 133 | 17 | -79 | 412 | 608 | 586 |
| Cash & Short-Term Investments | 696 | 972 | 976 | 1,458 | 1,467 | |
| Total assets | 1,114 | 1,501 | 1,551 | 2,136 | 2,323 | |
| Total Debt | 259 | 259 | 259 | 259 | 259 | |
| Net Debt | -1,208 | -1,208 | -1,208 | -1,208 | -1,208 | |
| Total liabilities | 684 | 1,054 | 1,183 | 1,356 | 934 | |
| Total Shareholders’ Equity | 1,389 | 1,389 | 1,389 | 1,389 | 1,389 | |
| Net Operating Cash Flow | 198 | -89 | 54 | 610 | 449 | |
| Capital Expenditure | 53 | 53 | 53 | 53 | 53 | |
| Net Investing Cash Flow | -25 | -32 | -68 | -7 | -68 | |
| Net Financing Cash Flow | 150 | 396 | 18 | -120 | -371 | |
| Free Cash Flow | 396 | 396 | 396 | 396 | 396 | |
| ROA (%) | 14.34 | 1.30 | -5.19 | 22.36 | 27.27 | |
| ROE (%) | 47.31 | 3.89 | -19.42 | 71.80 | 56.05 | |
| EPS (Yen) | 18.9 | 2.4 | -11.1 | 57.2 | 83.7 | 80.0 |
| BPS (Yen) | 61.0 | 63.3 | 51.3 | 107.9 | 188.7 | |
| Dividend per Share (Yen) | 0.00 | 0.00 | 0.00 | 0.00 | 16.50 | 16.00 |
| Shares Outstanding (Million shrs) | 7.05 | 7.06 | 7.17 | 7.23 | 7.27 |
Source: Omega Investment from company data, rounded to the nearest whole number.
Share price
Quarterly topics
Performance trends
Source: Omega Investment from company materials
Source: Omega Investment from company materials
Performance trends
Source: Omega Investment from company materials
New Graduate Events Business Order trends
Source: Omega Investment from company materials
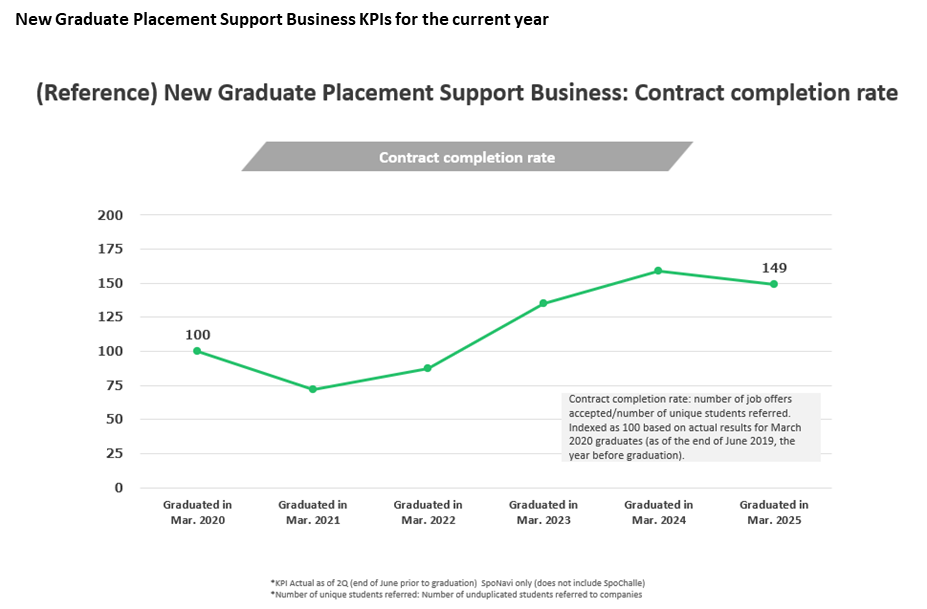
New Graduate Placement Support Business KPIs for the current year
Source: Omega Investment from company materials
Source: Omega Investment from company materials
New Graduate Placement Support Business KPIs for the current year
Source: Omega Investment from company materials
Source: Omega Investment from company materials
New Graduate Placement Support Business KPIs for the next fiscal year
Source: Omega Investment from company materials
Source: Omega Investment from company materials
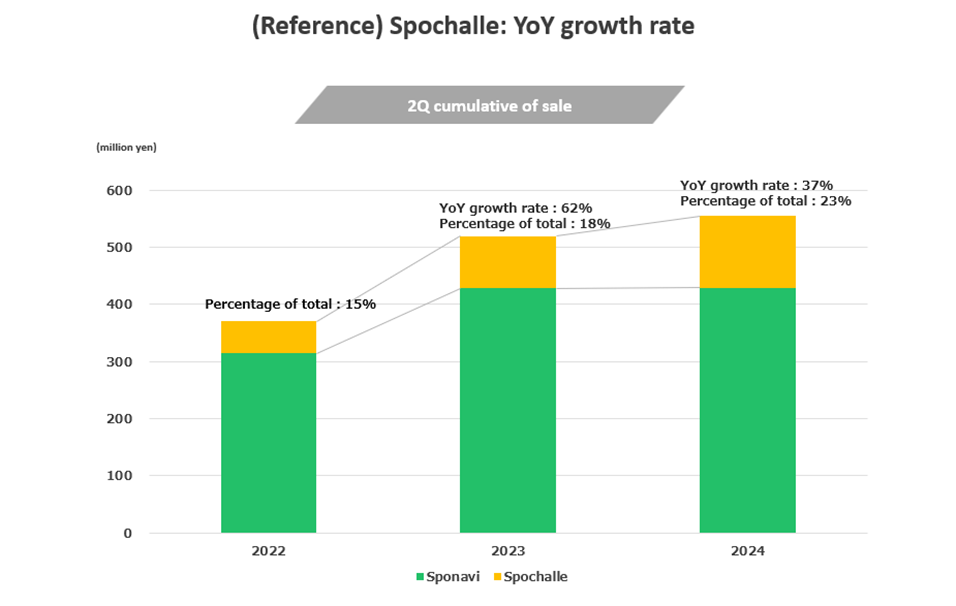
Graduate Placement Support Business KPIs
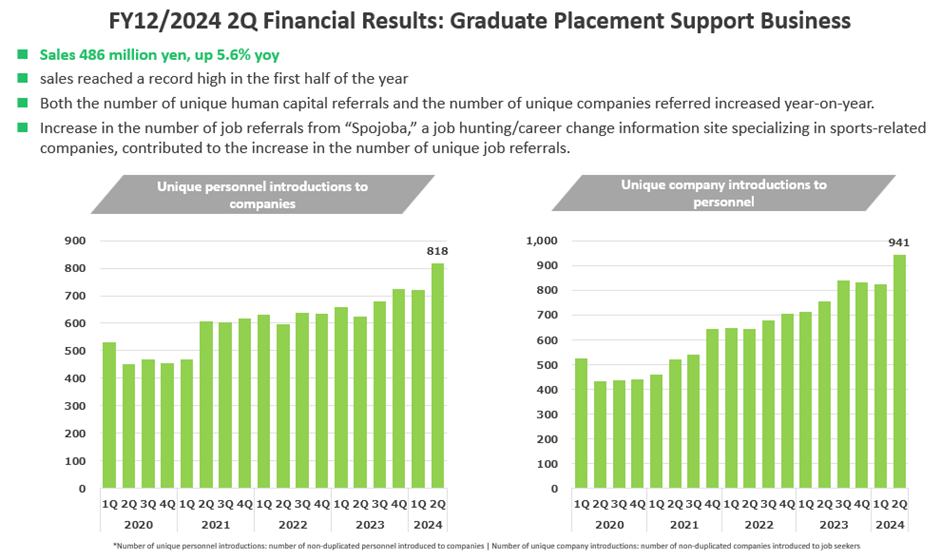
Source: Omega Investment from company materials
Source: Omega Investment from company materials
Source: Omega Investment from company materials
Financial data (quarterly basis)
| Unit: million yen | 2022/12 | 2023/12 | 2024/12 | ||||||
| 2Q | 3Q | 4Q | 1Q | 2Q | 3Q | 4Q | 1Q | 2Q | |
| (Income Statement) | |||||||||
| Sales | 862 | 610 | 620 | 919 | 971 | 698 | 829 | 1,102 | 953 |
| Year-on-year | 47.1% | 21.8% | 27.4% | 18.7% | 12.7% | 14.6% | 33.8% | 19.9% | -1.9% |
| Cost of Goods Sold (COGS) | 33 | 19 | 52 | 70 | 32 | 23 | 60 | 74 | 28 |
| Gross Income | 830 | 591 | 568 | 850 | 940 | 675 | 769 | 1,029 | 925 |
| Gross Income Margin | 96.2% | 96.9% | 91.6% | 92.4% | 96.7% | 96.7% | 92.8% | 93.3% | 97.1% |
| SG&A Expense | 528 | 521 | 535 | 534 | 627 | 590 | 613 | 626 | 759 |
| EBIT (Operating Income) | 302 | 70 | 33 | 316 | 313 | 85 | 156 | 403 | 166 |
| Year-on-year | 826.5% | -361.0% | -152.9% | 35.5% | 3.7% | 22.0% | 377.3% | 27.7% | -46.9% |
| Operating Income Margin | 35.0% | 11.4% | 5.3% | 34.3% | 32.2% | 12.2% | 18.9% | 36.5% | 17.4% |
| EBITDA | 306 | 74 | 37 | 320 | 318 | 90 | 162 | 409 | 172 |
| Pretax Income | 302 | 69 | 32 | 315 | 313 | 85 | 157 | 402 | 166 |
| Consolidated Net Income | 196 | 45 | 23 | 206 | 202 | 53 | 147 | 258 | 105 |
| Minority Interest | 0 | 0 | 0 | 0 | 0 | 0 | 0 | 0 | 0 |
| Net Income ATOP | 196 | 45 | 23 | 206 | 202 | 53 | 147 | 258 | 105 |
| Year-on-year | 823.6% | -161.4% | -155.1% | 38.3% | 3.4% | 17.7% | 544.6% | 25.7% | -47.9% |
| Net Income Margin | 22.7% | 7.4% | 3.7% | 22.4% | 20.8% | 7.6% | 17.8% | 23.4% | 11.1% |
| (Balance Sheet) | |||||||||
| Cash & Short-Term Investments | 1,304 | 1,509 | 1,458 | 1,146 | 1,462 | 1,519 | 1,467 | 1,600 | 1,807 |
| Total assets | 1,986 | 2,146 | 2,136 | 1,919 | 2,214 | 2,257 | 2,323 | 2,464 | 2,598 |
| Total Debt | 644 | 669 | 630 | 373 | 329 | 284 | 259 | 234 | 209 |
| Net Debt | -660 | -840 | -828 | -773 | -1,133 | -1,235 | -1,208 | -1,365 | -1,598 |
| Total liabilities | 1,273 | 1,388 | 1,356 | 932 | 1,025 | 1,015 | 934 | 938 | 966 |
| Total Shareholders’ Equity | 712 | 758 | 781 | 986 | 1,189 | 1,242 | 1,389 | 1,527 | 1,632 |
| (Profitability %) | |||||||||
| ROA | 13.26 | 18.36 | 22.36 | 25.84 | 22.66 | 21.98 | 27.27 | 30.16 | 23.45 |
| ROE | 38.41 | 59.64 | 71.80 | 62.45 | 50.06 | 48.40 | 56.05 | 52.61 | 40.00 |
| (Per-share) Unit: JPY | |||||||||
| EPS | 27.2 | 6.2 | 3.2 | 28.4 | 27.9 | 7.3 | 20.2 | 35.1 | 14.3 |
| BPS | 98.9 | 104.8 | 107.9 | 135.9 | 163.8 | 170.8 | 188.7 | 207.4 | 221.2 |
| Dividend per Share | 0.00 | 0.00 | 0.00 | 0.00 | 0.00 | 0.00 | 16.50 | 16.50 | 16.50 |
| Shares Outstanding (million shrs) | 7.19 | 7.23 | 7.23 | 7.24 | 7.26 | 7.27 | 7.27 | 7.36 | 7.38 |
Financial data (full-year basis)
| Unit: million yen | 2019/12 | 2020/12 | 2021/12 | 2022/12 | 2023/12 |
| (Income Statement) | |||||
| Sales | 1,918 | 1,883 | 2,130 | 2,866 | 3,418 |
| Year-on-year | 26.5% | -1.8% | 13.1% | 34.5% | 19.3% |
| Cost of Goods Sold | 111 | 130 | 151 | 159 | 184 |
| Gross Income | 1,807 | 1,754 | 1,979 | 2,707 | 3,234 |
| Gross Income Margin | 94.2% | 93.1% | 92.9% | 94.4% | 94.6% |
| SG&A Expense | 1,613 | 1,737 | 2,011 | 2,070 | 2,364 |
| EBIT (Operating Income) | 194 | 16 | -32 | 637 | 870 |
| Year-on-year | 52.4% | -91.7% | -300.2% | -2061.9% | 36.5% |
| Operating Income Margin | 10.1% | 0.9% | -1.5% | 22.2% | 25.4% |
| EBITDA | 212 | 36 | -6 | 654 | 890 |
| Pretax Income | 192 | 32 | -81 | 634 | 869 |
| Consolidated Net Income | 133 | 17 | -79 | 412 | 608 |
| Minority Interest | 0 | 0 | 0 | 0 | 0 |
| Net Income ATOP | 133 | 17 | -79 | 412 | 608 |
| Year-on-year | 82.6% | -87.2% | -564.0% | -621.0% | 47.5% |
| Net Income Margin | 6.9% | 0.9% | -3.7% | 14.4% | 17.8% |
| (Balance Sheet) | |||||
| Cash & Short-Term Investments | 696 | 972 | 976 | 1,458 | 1,467 |
| Total assets | 1,114 | 1,501 | 1,551 | 2,136 | 2,323 |
| Total Debt | 334 | 731 | 749 | 630 | 259 |
| Net Debt | -362 | -241 | -226 | -828 | -1,208 |
| Total liabilities | 684 | 1,054 | 1,183 | 1,356 | 934 |
| Total Shareholders’ Equity | 430 | 447 | 368 | 781 | 1,389 |
| (Cash Flow) | |||||
| Net Operating Cash Flow | 198 | -89 | 54 | 610 | 449 |
| Capital Expenditure | 5 | 12 | 51 | 3 | 53 |
| Net Investing Cash Flow | -25 | -32 | -68 | -7 | -68 |
| Net Financing Cash Flow | 150 | 396 | 18 | -120 | -371 |
| Free Cash Flow | 194 | -100 | 3 | 606 | 396 |
| (Profitability %) | |||||
| ROA | 14.34 | 1.30 | -5.19 | 22.36 | 27.27 |
| ROE | 47.31 | 3.89 | -19.42 | 71.80 | 56.05 |
| (Per-share) Unit: JPY | |||||
| EPS | 18.9 | 2.4 | -11.1 | 57.2 | 83.7 |
| BPS | 61.0 | 63.3 | 51.3 | 107.9 | 188.7 |
| Dividend per Share | 0.00 | 0.00 | 0.00 | 0.00 | 16.50 |
| Shares Outstanding (million shrs) | 7.05 | 7.06 | 7.17 | 7.23 | 7.27 |
Source: Omega Investment from company materials