2026-03-12
Home
Japanese

Omega Investment Co., Ltd.
Sansei Landic (Company note – 2Q update)

| Share price (10/4) | ¥981 | Dividend Yield (24/12 CE) | 4.2 % |
| 52weeks high/low | ¥834/1,172 | ROE(23/12 act) | 10.2 % |
| Avg Vol (3 month) | 22.2 thou shrs | Operating margin (23/12 act) | 9.3 % |
| Market Cap | ¥8.42 bn | Beta (5Y Monthly) | 0.47 |
| Enterprise Value | ¥19.2 bn | Shares Outstanding | 8.584 mn shrs |
| PER (24/12 CE) | 8.1 X | Listed market | TSE Standard |
| PBR (23/12 act) | 0.7 X |
| Click here for the PDF version of this page |
| PDF version |
Long-awaited new medium-term plan. The plan’s contents track the strengthening and expansion of the business base and the pursuit of capital efficiency.
◇ FY12/2024 2Q financial highlights: Significant profit decline reversed with the launch of an interim dividend and the announcement of a new medium-term plan.
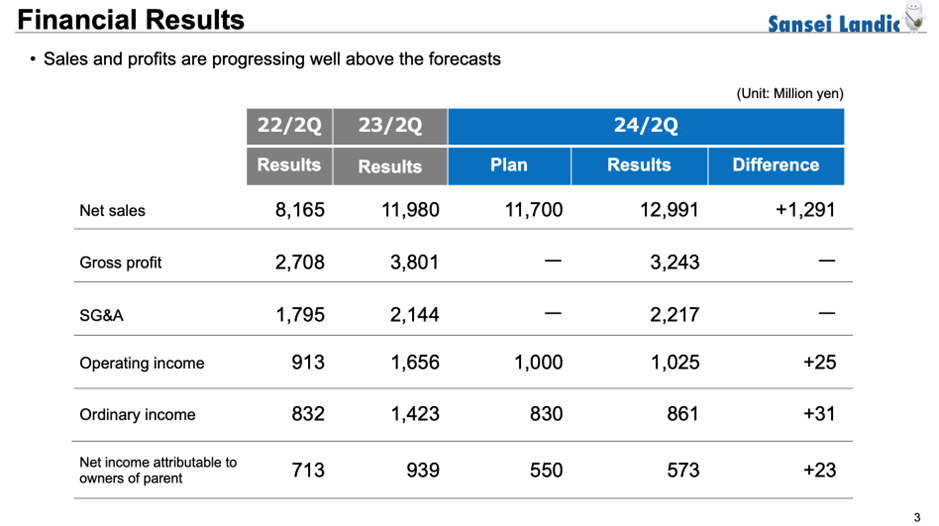
Sansei Landic’s (hereafter referred to as ‘the company’) financial results for Q2 FY12/2024, announced on 9 August 2024, showed a YoY revenue increase and decreased profits. However, the company beat its forecasts, and the performance was more robust than in the same period a year ago, so in the bigger picture, it can be said to be on a growth trajectory.
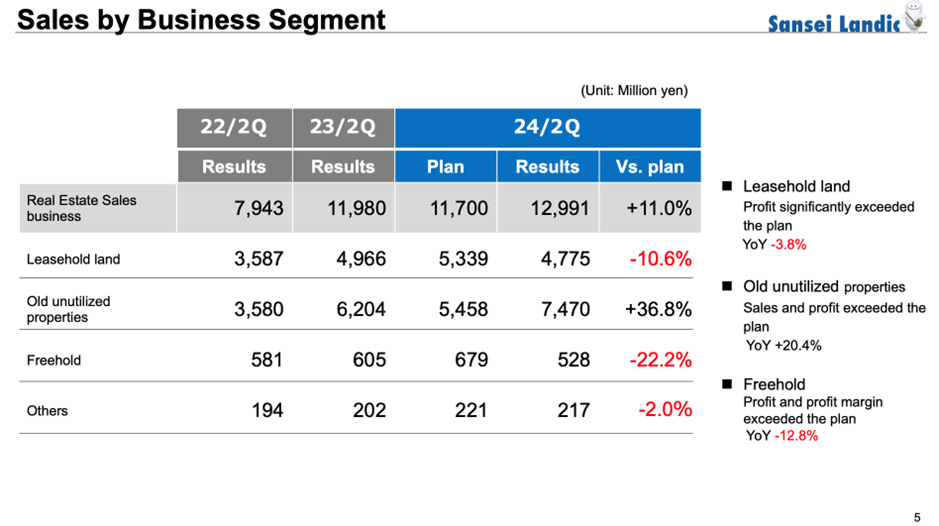
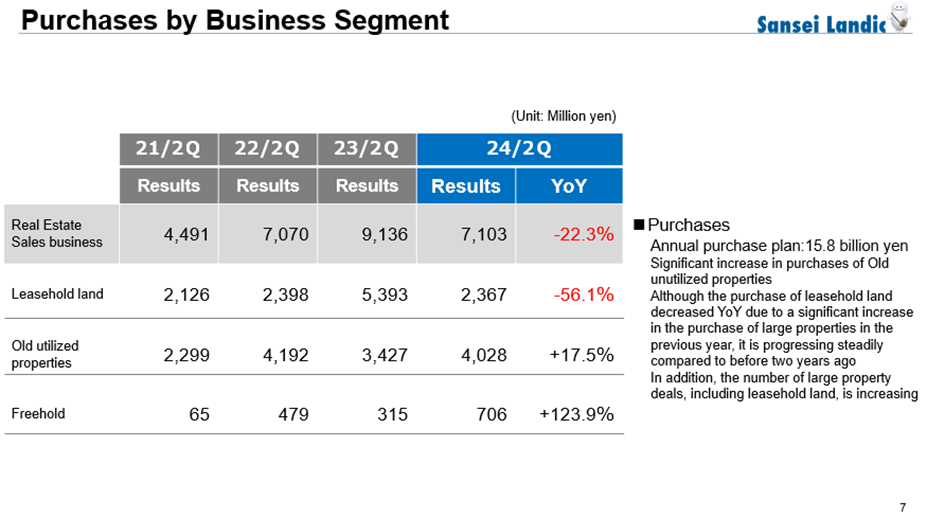
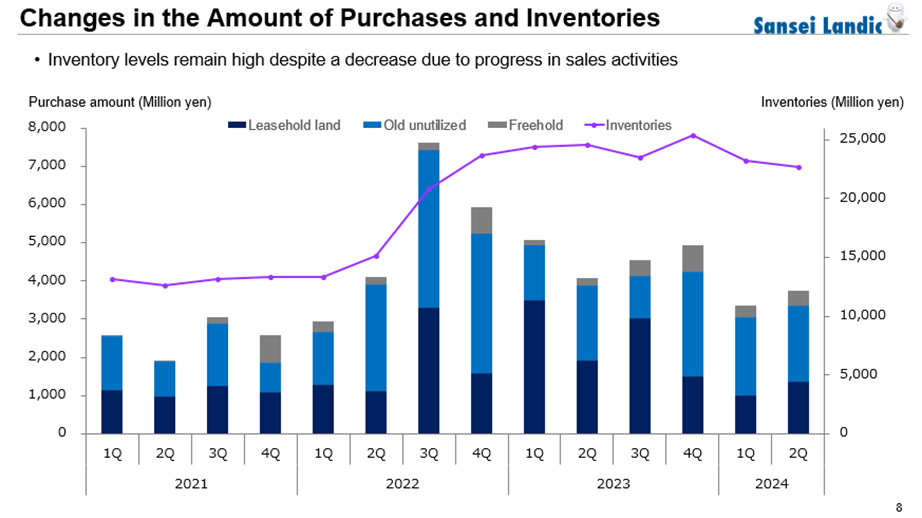
Specifically, sales were 12.99 billion yen (+ 8% YoY), operating income was 1.02 billion yen (- 38% YoY), ordinary income was 860 million yen (- 39% YoY), and interim net profit attributable to owner of parent was 570 million yen (- 39% YoY). In the same period of the previous year, sales and profits increased sharply. In contrast, in the current period, although sales increased, mainly due to growth in the sales of old unutilized properties, gross profit decreased due to some low-profit old unutilized properties and as the sales ratio of old unutilized properties to total sales increased. Accordingly, operating income declined, although the increase in SGAE was suppressed. Purchases were 7.1 billion yen (- 22% YoY), but this can be seen as a result of the sharp rise in purchases of leasehold land in the same period of the previous year.
However, this performance exceeded the initial company forecast (a revision for 2Q was announced on 7 August), and sales, gross profit, operating income, and ordinary income exceeded the results for FY12/2022 2Q, while purchases were at the same level. On the whole, the company is on a steady growth trajectory.
On the balance sheet, the sale of old unutilized properties has progressed, and the balance of property for sale has decreased compared to the end of the previous fiscal year. In response to this, borrowings have also been reduced.
The financial results this time show a significant YoY decrease in profit. Still, the company has taken steps to improve its corporate value and share price, such as starting interim dividend payments (16 yen per share) and announcing a new medium-term management plan (see below).
◇ Full-year forecast: No change from the initial plan
There are no changes to the full-year financial forecasts or dividends. Sales are 23.7 billion yen (+ 1% YoY), operating income is 1.8 billion yen (- 16%), ordinary income is 1.5 billion yen (- 15%), and net profit attributable to owner of parent is 1 billion yen (- 15%). The dividend per share is 41 yen (an increase of 8 yen; the 11th consecutive year of an increase).
Progress ratio versus the full-year forecast for the first two quarters is over 50%. Although this is slightly lower than the previous three years, it is generally considered a reasonable forecast.
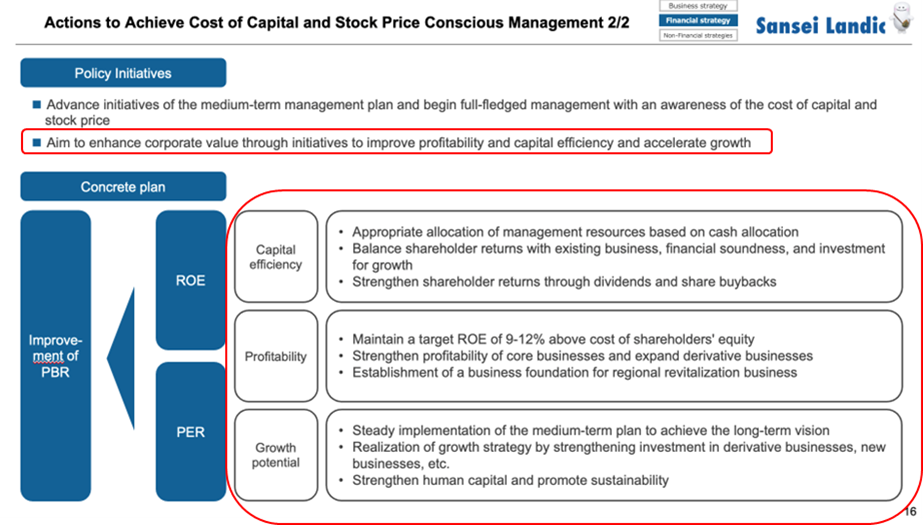
◇ New medium-term management plan: Achieving both the strengthening of the foundation for sustainable growth and the improvement of capital efficiency
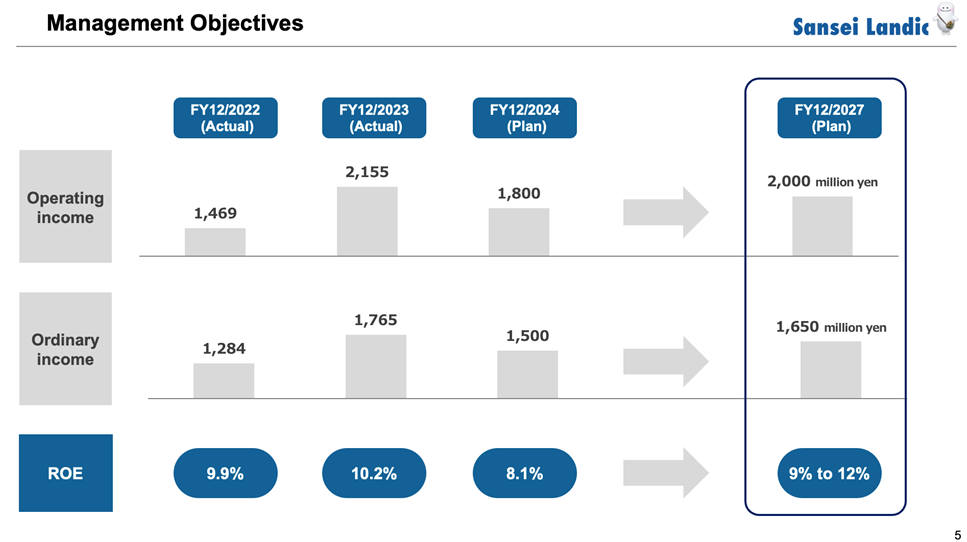
A new medium-term plan was announced alongside the above financial results. The previous plan’s target values (operating income of 1.8 billion yen, ordinary income of 1.65 billion yen, ROE of 9.0%) were achieved in the fiscal year ending December 2023, so the next plan was eagerly awaited.
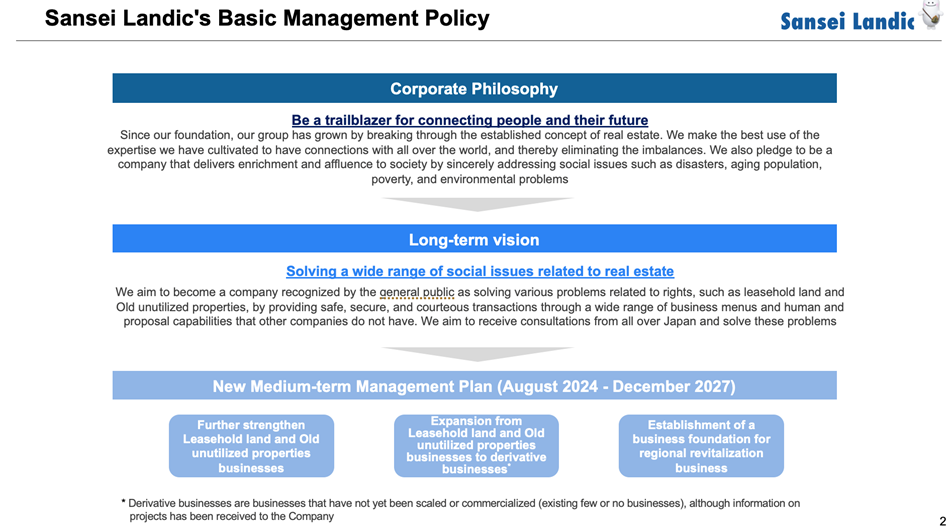
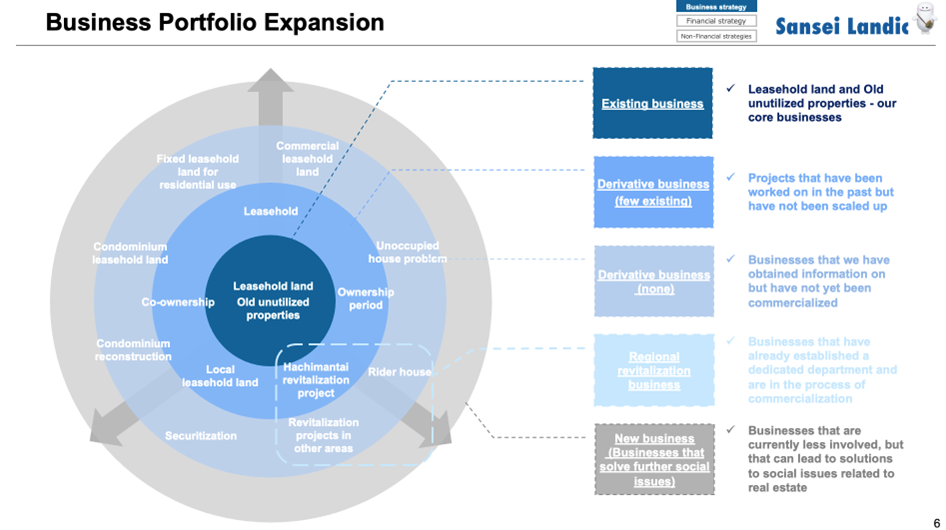
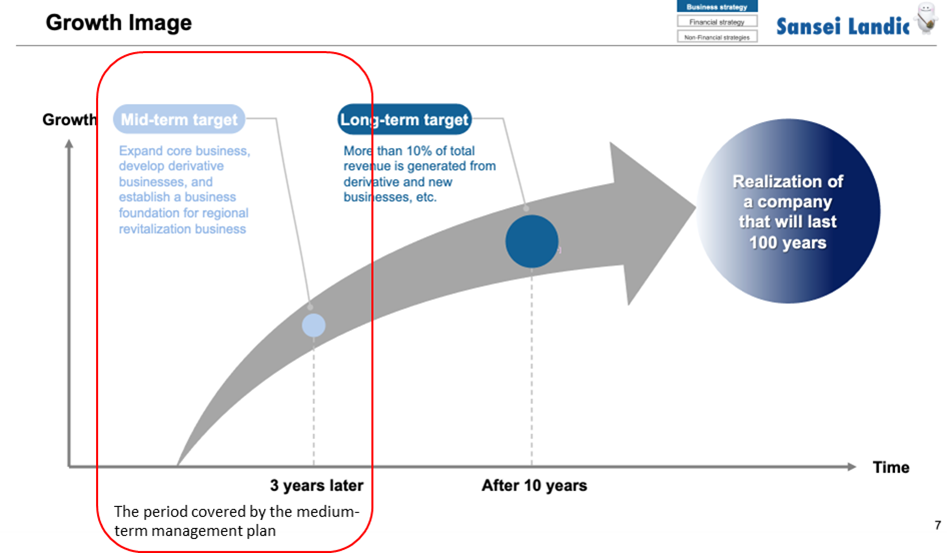
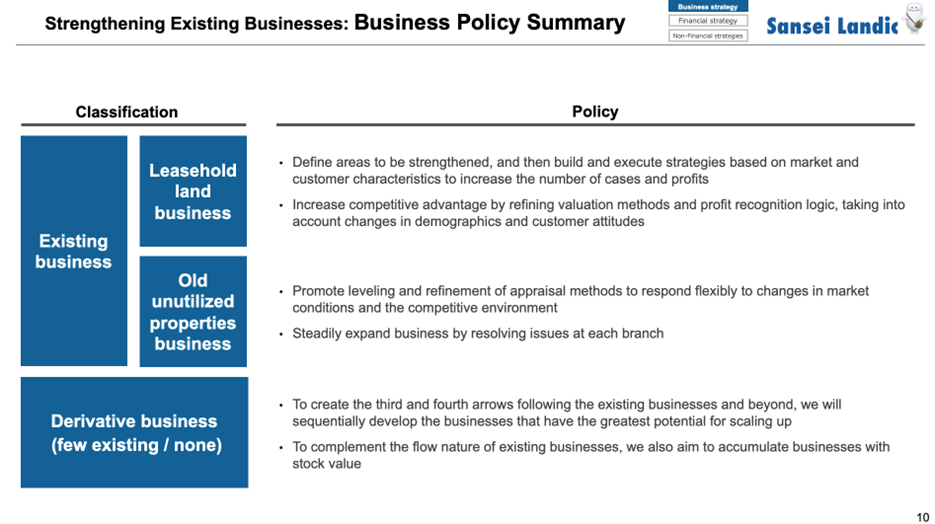
The new medium-term plan covers approximately 3.5 years from August 2024 to fiscal 2027, and its main pillars are to strengthen existing businesses (leasehold land and old unutilized properties), commercialise derivative businesses in peripheral areas of existing businesses, enhance the base of management, and increase shareholder returns and ROE.
The numerical targets for the fiscal year ending December 2027 are operating income of 2.0 billion yen, ordinary income of 1.65 billion yen, and ROE of 9.0-12.0%. The primary profit drivers are the existing businesses, and the profit targets do not exceed those for the fiscal year ending December 2023. The ROE target does not exceed the level the company had achieved before the coronavirus pandemic.
As such, this plan cannot help but give the impression of being numerically passive. However, when considering the following points, one can appreciate the realistic content of the plan.
Firstly, the company is engaged in the real estate flow business, which is subject to large short-term fluctuations, and it is thought that aiming for resilient, stable growth in response to the external environment is a more rational business policy than placing too much emphasis on expanding business performance. Some factors should be of concern in the future business environment, such as rising interest rates and construction costs. For this reason, rather than placing too much emphasis on expanding business performance and increasing business volatility or taking on excessive risk, it is probably better to aim for steady business performance growth and improving the performance of core existing businesses, as this will lead to greater business stability, preserve the strength to promote derivative businesses. There is also a good chance that it will lead to a reduction in the cost of capital.
According to the company, the business potential related to the core business of real estate rights adjustment and the competitive situation has not deteriorated.
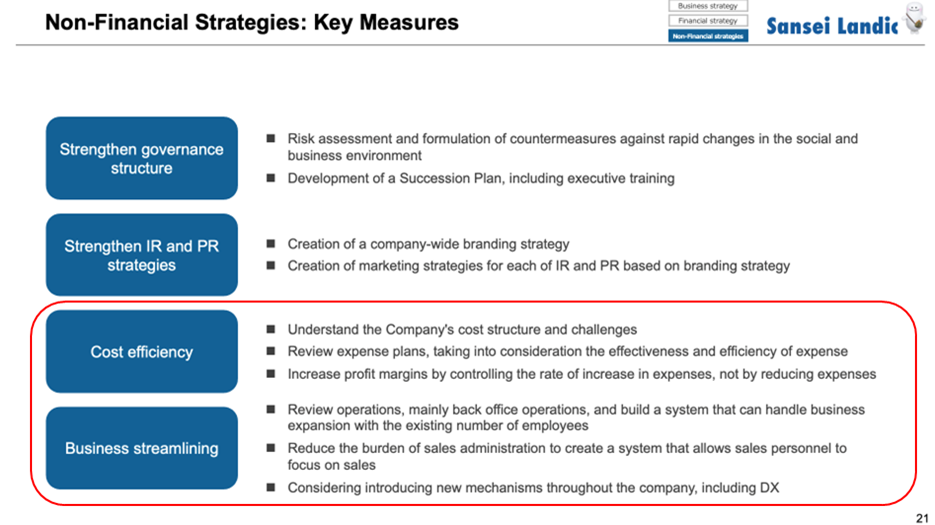
Secondly, concerning strengthening existing businesses, the company plans to expand the area of its leasehold land business and promote the standardization and refinement of appraisal methods for its old unutilized properties business. It has clear strategies for doing so. Furthermore, considering regional characteristics, the company has a system to analyse data from past transactions and apply the results to its business promotion activities. It is also ready to promote the efficiency of back-office work and cost optimisation to improve labour productivity. As a result, the company will likely achieve more stable growth in earnings than in the past.
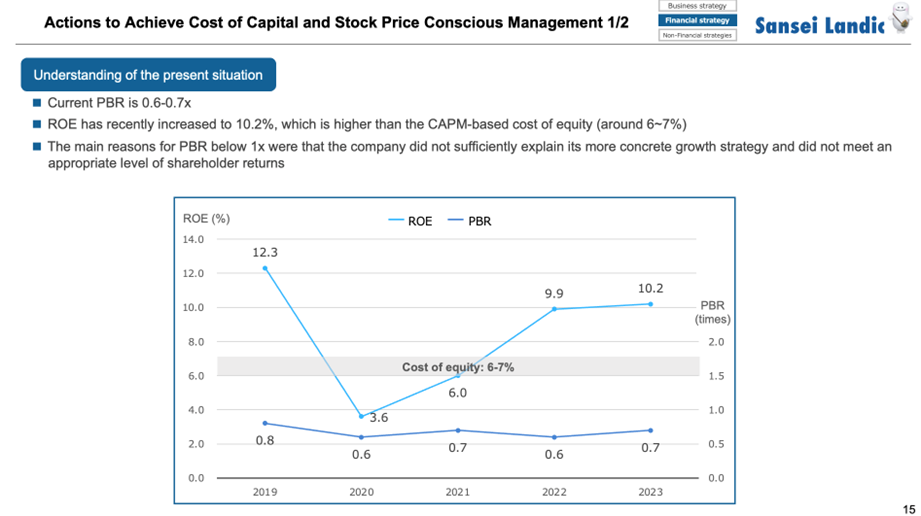
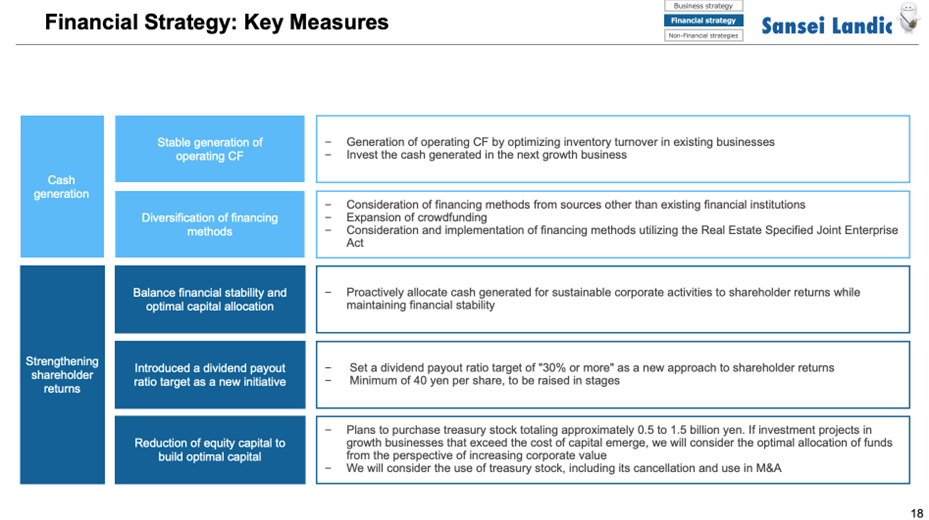
Thirdly, the company has shown a positive approach to achieving management conscious of capital costs and stock prices. The company recognises that, despite its ROE exceeding the estimated cost of equity of 6-7%, its PBR was 0.6-0.7 times, and it decided to aim to improve its corporate value by improving profitability and capital efficiency and accelerating growth. Of particular note, the company has set a target ROE of 9-12%, the level it was achieving before the coronavirus crisis, and has set a target dividend payout ratio of 30% or more (33.7% forecast for the current period ), and that it plans to gradually increase the dividend per share, with a minimum of 40 yen, and that it also plans to acquire its shares worth a total of 500 million to 1.5 billion yen in addition to the dividend of around 1 billion yen between 2025 and 2027. In addition to operating CF, the company is considering raising funds through debt and other means to provide the capital. This suggests that the total return ratio will be around 50% to 80% and that the shareholders’ equity derived from the profit and ROE targets will not increase significantly from the current level. This plan clearly aims to raise ROE and improve PBR. It could become an excellent example of implementing capital cost management, which has produced results in the Japanese stock market in recent years.
◇ Stock price trends and points to watch in the future
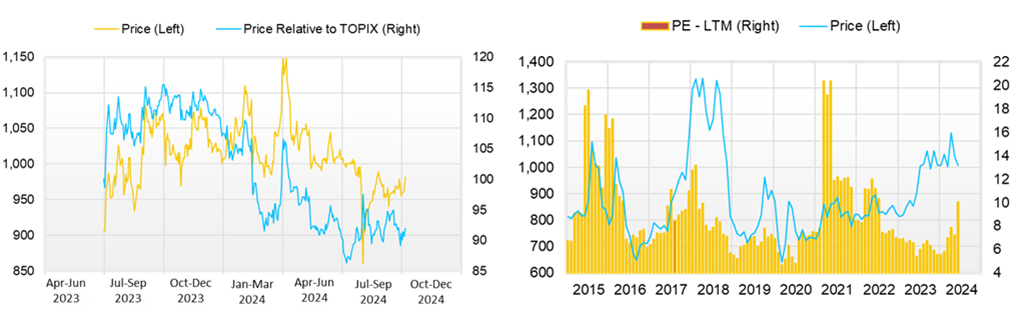
The share price has hovered around 1000 yen since mid-May. Although it briefly dropped to 834 yen in line with the global stock price decline at the start of August, it has since recovered and is currently slightly below 1000 yen after announcing these financial results and the medium-term plan. Forecast PER is around 8 times, PBR is 0.64 times, and the expected dividend yield is around 4.2%, so the share price is not overheated.
The immediate focus is whether the company will achieve its full-year forecasts by making good progress with its high-quality procurement.
From a medium-term perspective, the key questions are how the strengthening of the foundations of existing businesses will drive financial figures, when and how the business potential by derivative business and regional revitalization business will be made visible, and when additional shareholder return measures will be presented.
Company profile
Sansei Landic Co., Ltd. operates a real estate rights adjustment business. The company makes a profit by adjusting the rights to properties it has purchased, mainly leasehold land and old unutilized properties, and then reselling them. It has captured stable profit opportunities in niche markets. In August 2024, the company announced a new medium-term plan covering the period from August 2024 to fiscal 2027. ROE and PBR are expected to improve due to the growth strategy and improved capital efficiency.
Key financial data
| Unit: million yen | 2019/12 | 2020/12 | 2021/12 | 2022/12 | 2023/12 | 2024/12 CE |
| Sales | 18,020 | 17,775 | 16,836 | 15,533 | 23,269 | 23,700 |
| EBIT (Operating Income) | 1,861 | 847 | 1,118 | 1,469 | 2,155 | 1,800 |
| Pretax Income | 1,759 | 712 | 1,004 | 1,270 | 1,756 | 1,500 |
| Net Profit Attributable to Owner of Parent | 1,159 | 358 | 609 | 1,060 | 1,183 | 1,000 |
| Cash & Short-Term Investments | 4,134 | 4,330 | 5,361 | 3,837 | 3,770 | |
| Total assets | 19,294 | 20,071 | 20,051 | 28,977 | 30,976 | |
| Total Debt | 16,879 | 16,879 | 16,879 | 16,879 | 16,879 | |
| Net Debt | 13,109 | 13,109 | 13,109 | 13,109 | 13,109 | |
| Total liabilities | 9,399 | 10,004 | 9,749 | 17,921 | 18,899 | |
| Total Shareholders’ Equity | 12,077 | 12,077 | 12,077 | 12,077 | 12,077 | |
| Net Operating Cash Flow | -420 | -917 | 1,705 | -9,268 | -12 | |
| Capital Expenditure | 304 | 304 | 304 | 304 | 304 | |
| Net Investing Cash Flow | -71 | -288 | -51 | -267 | -766 | |
| Net Financing Cash Flow | 984 | 953 | -608 | 7,971 | 303 | |
| Free Cash Flow | -291 | -291 | -291 | -291 | -291 | |
| ROA (%) | 6.42 | 1.82 | 3.04 | 4.32 | 3.95 | |
| ROE (%) | 12.32 | 3.58 | 5.98 | 9.93 | 10.23 | |
| EPS (Yen) | 137.1 | 42.3 | 73.6 | 129.6 | 143.8 | 121.4 |
| BPS (Yen) | 1,170.2 | 1,192.9 | 1,249.5 | 1,356.8 | 1,465.5 | |
| Dividend per Share (Yen) | 23.00 | 25.00 | 26.00 | 28.00 | 33.00 | 41.00 |
| Shares Outstanding (Million Shares) | 8.46 | 8.47 | 8.47 | 8.49 | 8.58 |
Source: Omega Investment from company data, rounded to the nearest whole number.
Share price
FY12/24 2Q financial result
As mentioned above, profits decreased while revenue increased YoY in the 2Q of FY12/2024. However, profits were higher than the level of the year before last. Please check the following.
Source: Omega Investment from company materials
Source: Omega Investment from company materials
Source: Omega Investment from company materials
Source: Omega Investment from company materials
Medium-term management plan
Source: Omega Investment from company materials
Source: Omega Investment from company materials
Source: Omega Investment from company materials
Source: Omega Investment from company materials
Source: Omega Investment from company materials
Source: Omega Investment from company materials
Source: Omega Investment from company materials
Source: Omega Investment from company materials
Source: Omega Investment from company materials
Financial data (quarterly basis)
| Unit: million yen | 2022/12 | 2023/12 | 2024/12 | ||||||
| 2Q | 3Q | 4Q | 1Q | 2Q | 3Q | 4Q | 1Q | 2Q | |
| (Income Statement) | |||||||||
| Sales | 3,721 | 3,096 | 4,272 | 6,486 | 5,494 | 7,485 | 3,804 | 7,207 | 5,785 |
| Year-on-year | -0.6% | -24.3% | 17.4% | 45.9% | 47.6% | 141.8% | -11.0% | 11.1% | 5.3% |
| Cost of Goods Sold (COGS) | 2,310 | 1,964 | 3,065 | 4,320 | 3,858 | 5,681 | 3,067 | 5,521 | 4,228 |
| Gross Income | 1,411 | 1,132 | 1,207 | 2,166 | 1,635 | 1,803 | 737 | 1,686 | 1,558 |
| Gross Income Margin | 37.9% | 36.6% | 28.2% | 33.4% | 29.8% | 24.1% | 19.4% | 23.4% | 26.9% |
| SG&A Expense | 945 | 845 | 938 | 1,048 | 1,097 | 1,128 | 914 | 1,115 | 1,102 |
| EBIT (Operating Income) | 466 | 287 | 269 | 1,118 | 539 | 676 | -177 | 571 | 455 |
| Year-on-year | 189.9% | -15.1% | 197.7% | 150.0% | 15.6% | 135.5% | -165.8% | -49.0% | -15.5% |
| Operating Income Margin | 12.5% | 9.3% | 6.3% | 17.2% | 9.8% | 9.0% | -4.7% | 7.9% | 7.9% |
| EBITDA | 476 | 297 | 286 | 1,145 | 559 | 692 | -161 | 587 | 476 |
| Pretax Income | 399 | 231 | 205 | 1,046 | 378 | 587 | -254 | 493 | 369 |
| Consolidated Net Income | 338 | 196 | 151 | 684 | 256 | 387 | -144 | 328 | 245 |
| Minority Interest | 0 | 0 | 0 | 0 | 0 | 0 | 0 | 0 | 0 |
| Net Income ATOP | 338 | 196 | 151 | 684 | 256 | 387 | -144 | 328 | 245 |
| Year-on-year | 326.0% | 34.7% | 145.2% | 82.2% | -24.4% | 97.9% | -195.1% | -52.0% | -4.0% |
| Net Income Margin | 9.1% | 6.3% | 3.5% | 10.5% | 4.7% | 5.2% | -3.8% | 4.6% | 4.2% |
| (Balance Sheet) | |||||||||
| Cash & Short-Term Investments | 5,787 | 4,979 | 3,837 | 3,569 | 4,266 | 5,388 | 3,770 | 4,479 | 4,988 |
| Total assets | 22,679 | 27,509 | 28,977 | 29,627 | 30,777 | 30,632 | 30,976 | 30,487 | 30,561 |
| Total Debt | 7,885 | 12,757 | 16,399 | 16,061 | 16,520 | 16,262 | 16,879 | 16,787 | 16,211 |
| Net Debt | 2,098 | 7,778 | 12,562 | 12,493 | 12,254 | 10,874 | 13,109 | 12,308 | 11,223 |
| Total liabilities | 11,986 | 16,622 | 17,921 | 18,064 | 18,944 | 18,412 | 18,899 | 18,354 | 18,163 |
| Total Shareholders’ Equity | 10,693 | 10,886 | 11,056 | 11,563 | 11,833 | 12,220 | 12,077 | 12,133 | 12,398 |
| (Profitability %) | |||||||||
| ROA | 4.48 | 4.10 | 4.32 | 5.50 | 4.81 | 5.08 | 3.95 | 2.75 | 2.66 |
| ROE | 8.85 | 9.19 | 9.93 | 12.43 | 11.42 | 12.79 | 10.23 | 6.98 | 6.74 |
| (Per-share) Unit: JPY | |||||||||
| EPS | 41.2 | 24.1 | 18.6 | 83.5 | 31.0 | 47.0 | -17.4 | 39.8 | 29.7 |
| BPS | 1,316.2 | 1,340.3 | 1,356.8 | 1,406.1 | 1,435.9 | 1,482.9 | 1,465.5 | 1,472.3 | 1,501.2 |
| Dividend per Share | 26.00 | 26.00 | 28.00 | 28.00 | 28.00 | 28.00 | 33.00 | 33.00 | 33.00 |
| Shares Outstanding(Million shares) | 8.48 | 8.48 | 8.49 | 8.58 | 8.58 | 8.58 | 8.58 | 8.58 | 8.58 |
Source: Omega Investment from company materials
Financial data (full-year basis)
| Unit: million yen | 2013/12 | 2014/12 | 2015/12 | 2016/12 | 2017/12 | 2018/12 | 2019/12 | 2020/12 | 2021/12 | 2022/12 | 2023/12 |
| (Income Statement) | |||||||||||
| Sales | 9,189 | 10,446 | 11,569 | 12,300 | 13,099 | 16,833 | 18,020 | 17,775 | 16,836 | 15,533 | 23,269 |
| Year-on-year | -3.0% | 13.7% | 10.8% | 6.3% | 6.5% | 28.5% | 7.1% | -1.4% | -5.3% | -7.7% | 49.8% |
| Cost of Goods Sold | 6,254 | 7,055 | 7,798 | 8,344 | 8,566 | 12,028 | 12,902 | 13,788 | 12,468 | 10,486 | 16,927 |
| Gross Income | 2,935 | 3,391 | 3,770 | 3,957 | 4,532 | 4,805 | 5,119 | 3,986 | 4,368 | 5,047 | 6,342 |
| Gross Income Margin | 31.9% | 32.5% | 32.6% | 32.2% | 34.6% | 28.5% | 28.4% | 22.4% | 25.9% | 32.5% | 27.3% |
| SG&A Expense | 2,034 | 2,204 | 2,216 | 2,295 | 2,434 | 2,702 | 2,891 | 2,750 | 2,877 | 3,031 | 3,569 |
| EBIT (Operating Income) | 902 | 1,187 | 1,300 | 1,446 | 1,762 | 1,766 | 1,861 | 847 | 1,118 | 1,469 | 2,155 |
| Year-on-year | 74.3% | 31.6% | 9.6% | 11.2% | 21.9% | 0.2% | 5.4% | -54.5% | 31.9% | 31.5% | 46.7% |
| Operating Income Margin | 9.8% | 11.4% | 11.2% | 11.8% | 13.5% | 10.5% | 10.3% | 4.8% | 6.6% | 9.5% | 9.3% |
| EBITDA | 968 | 1,260 | 1,406 | 1,532 | 1,833 | 1,822 | 1,912 | 896 | 1,161 | 1,517 | 2,236 |
| Pretax Income | 810 | 1,044 | 1,196 | 1,329 | 1,672 | 1,539 | 1,759 | 712 | 1,004 | 1,270 | 1,756 |
| Consolidated Net Income | 456 | 626 | 724 | 854 | 1,111 | 1,007 | 1,159 | 358 | 609 | 1,060 | 1,183 |
| Minority Interest | 0 | 0 | 0 | 0 | 0 | 0 | 0 | 0 | 0 | 0 | 0 |
| Net Income ATOP | 456 | 626 | 724 | 854 | 1,111 | 1,007 | 1,159 | 358 | 609 | 1,060 | 1,183 |
| Year-on-year | 95.4% | 37.5% | 15.6% | 17.9% | 30.2% | -9.4% | 15.1% | -69.1% | 70.5% | 73.9% | 11.6% |
| Net Income Margin | 5.0% | 6.0% | 6.3% | 6.9% | 8.5% | 6.0% | 6.4% | 2.0% | 3.6% | 6.8% | 5.1% |
| (Balance Sheet) | |||||||||||
| Cash & Short-Term Investments | 1,186 | 2,276 | 2,254 | 2,435 | 3,558 | 3,594 | 4,134 | 4,330 | 5,361 | 3,837 | 3,770 |
| Total assets | 8,919 | 8,793 | 11,398 | 10,833 | 16,916 | 16,777 | 19,294 | 20,071 | 20,051 | 28,977 | 30,976 |
| Total Debt | 3,780 | 2,414 | 3,958 | 2,712 | 7,439 | 6,048 | 7,203 | 8,342 | 8,108 | 16,399 | 16,879 |
| Net Debt | 2,594 | 139 | 1,704 | 277 | 3,881 | 2,454 | 3,069 | 4,012 | 2,747 | 12,562 | 13,109 |
| Total liabilities | 5,051 | 3,531 | 5,363 | 3,977 | 8,909 | 7,869 | 9,399 | 10,004 | 9,749 | 17,921 | 18,899 |
| Total Shareholders’ Equity | 3,868 | 5,262 | 6,034 | 6,856 | 8,006 | 8,908 | 9,895 | 10,067 | 10,302 | 11,056 | 12,077 |
| (Cash Flow) | |||||||||||
| Net Operating Cash Flow | -664 | 1,761 | -1,451 | 1,611 | -3,666 | 1,617 | -420 | -917 | 1,705 | -9,268 | -12 |
| Capital Expenditure | 97 | 91 | 58 | 111 | 57 | 66 | 61 | 21 | 40 | 28 | 304 |
| Net Investing Cash Flow | -175 | -111 | -116 | -184 | 107 | -64 | -71 | -288 | -51 | -267 | -766 |
| Net Financing Cash Flow | 1,136 | -612 | 1,588 | -1,278 | 4,667 | -1,495 | 984 | 953 | -608 | 7,971 | 303 |
| Free Cash Flow | -714 | 1,697 | -1,491 | 1,536 | -3,692 | 1,572 | -446 | -923 | 1,682 | -9,282 | -291 |
| (Profitability %) | |||||||||||
| ROA | 5.69 | 7.07 | 7.17 | 7.68 | 8.01 | 5.98 | 6.42 | 1.82 | 3.04 | 4.32 | 3.95 |
| ROE | 12.48 | 13.72 | 12.82 | 13.24 | 14.96 | 11.90 | 12.32 | 3.58 | 5.98 | 9.93 | 10.23 |
| (Per-share) Unit: JPY | |||||||||||
| EPS | 66.0 | 90.2 | 90.1 | 104.9 | 134.4 | 119.6 | 137.1 | 42.3 | 73.6 | 129.6 | 143.8 |
| BPS | 560.5 | 664.8 | 744.2 | 841.3 | 958.0 | 1,054.5 | 1,170.2 | 1,192.9 | 1,249.5 | 1,356.8 | 1,465.5 |
| Dividend per Share | 3.00 | 6.00 | 10.00 | 12.00 | 18.00 | 21.00 | 23.00 | 25.00 | 26.00 | 28.00 | 33.00 |
| Shares Outstanding (Million shares) | 6.90 | 7.91 | 8.11 | 8.15 | 8.35 | 8.45 | 8.46 | 8.47 | 8.47 | 8.49 | 8.58 |
Source: Omega Investment from company materials