Kidswell Bio (Company note – 2Q update)

| Share price (12/4) | ¥121 | Dividend Yield (25/3 CE) | – % |
| 52weeks high/low | ¥119/122 | ROE(24/3 act) | -166.5 % |
| Avg Vol (3 month) | 266 thou shrs | Operating margin (24/3 act) | -54.9 % |
| Market Cap | ¥4.9 bn | Beta (5Y Monthly) | N/A |
| Enterprise Value | ¥5.4 bn | Shares Outstanding | 40.657 mn shrs |
| PER (25/3 CE) | – X | Listed market | TSE Growth |
| PBR (24/3 act) | 6.4 X |
| Click here for the PDF version of this page |
| PDF Version |
The biosimilar business continues to be profitable. The timing for turning the consolidated operating account into the black has been revised, but efforts have not been slackened to strengthen the company’s structure.
◇ 2Q of FY2025/3 Financial Highlights: Progress as expected
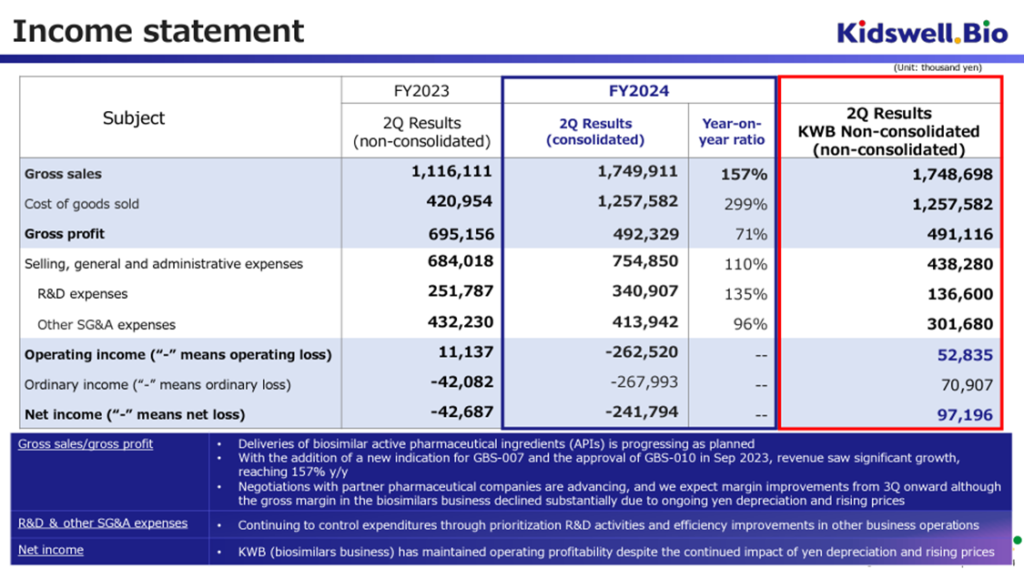
The company announced its financial results for the second quarter of FY2025/3 on November 12, 2024. On a cumulative basis, sales were 1.74 billion yen, operating loss was 260 million yen, ordinary loss was 260 million yen, and interim net loss attributable to owner of parent was 240 million yen. This is in line with expectations.
In the company’s biosimilar business, the addition of indications for GBS-007 and the approval of GBS-010 in the previous fiscal year have benefited from the steady expansion of demand in the medical field. As a result, despite rising costs at overseas production bases due to inflation and the weak yen, the business has maintained a profit-making trend. Due to factors such as increased R&D costs, the company is operating at a loss on a consolidated basis, but this is a typical example of a research and development-oriented bio-venture.
To deal with the increased working capital needs associated with the sales growth of its biosimilar business, the company is working with its partner pharmaceutical companies to improve the efficiency of its working capital. In a situation where sales are growing, the company has already reduced its working capital by over 1 billion yen, which will reduce its dependence on raising funds through the stock market and is therefore a welcome move from a shareholder perspective.
◇ Revision of the full-year earnings forecast for FY2025/3: The likelihood of achieving the forecast has increased
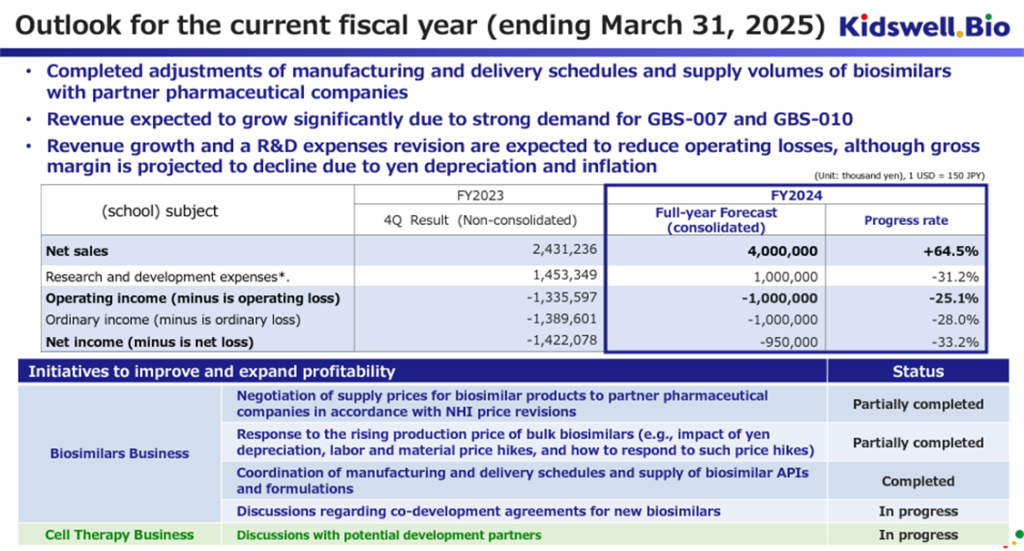
The company has revised its full-year consolidated earnings forecast for FY2025/3. Previously, it had only given a range for sales of 3.5 billion yen to 4.5 billion yen for sales, but this time, it has given specific figures of 4.0 billion yen for sales, 1.0 billion yen for operating loss, 1.0 billion yen for ordinary loss, and 950 million yen for net loss attributable to owner of parent. The company aims to license its cell therapy business during the current fiscal year, but this revenue has not been factored into these earnings forecasts.
We would like to positively evaluate the fact that the company has finalized its manufacturing and delivery plans with partner pharmaceutical companies and contract manufacturing companies in its biosimilar business, which is one of its core businesses, and that demand for the company’s biosimilars in medical settings is strong, resulting in an increase in revenue and a reduction in losses compared to the results for FY2024/3 (on a non-consolidated basis).
However, the company’s biosimilar products are affected by overseas inflation and exchange rate trends, so it is still necessary to pay attention to exchange rate trends (particularly a weak yen).
◇Status of cell therapy business development: Looking forward to the R&D briefing scheduled for December 3
In the second quarter, S-Quatre Corporation concluded a joint research agreement with Dokkyo Medical University and HOYA Technosurgical Corporation to develop new treatments for ischemic bone diseases. However, there was little additional information this time about the clinical research on cerebral palsy led by Nagoya University, which is progressing with the development of autologous SHED, or the corporate clinical trials on allogeneic SHED for cerebral palsy (in the remote period) in Japan. The R&D briefing scheduled for December 3rd is awaited.
◇Change in the timing of achieving consolidated operating profit: profitability is expected in FY2027/3
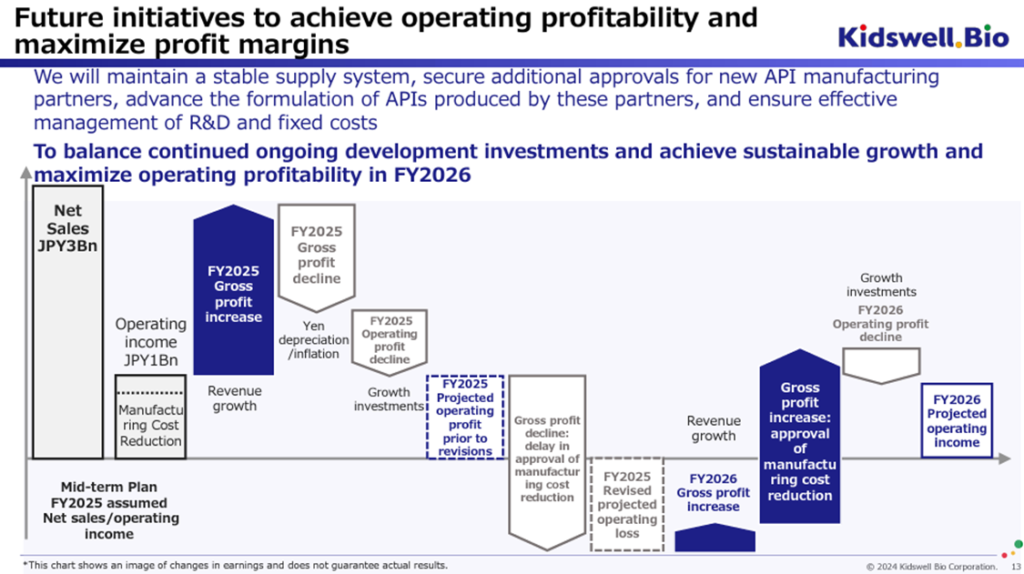
The company had planned to achieve sales of 3.0 billion yen and operating income of 1.0 billion yen in FY2026/3 but has now announced that it will achieve consolidated operating profit in FY2027/3.
As investors are already aware, the company has achieved its sales target as forecast in its consolidated earnings forecast for the year ending March 2025, and demand for the company’s biosimilars and the biosimilar market as a whole is expected to continue to grow steadily, contributing to an improvement in the company’s gross profit.
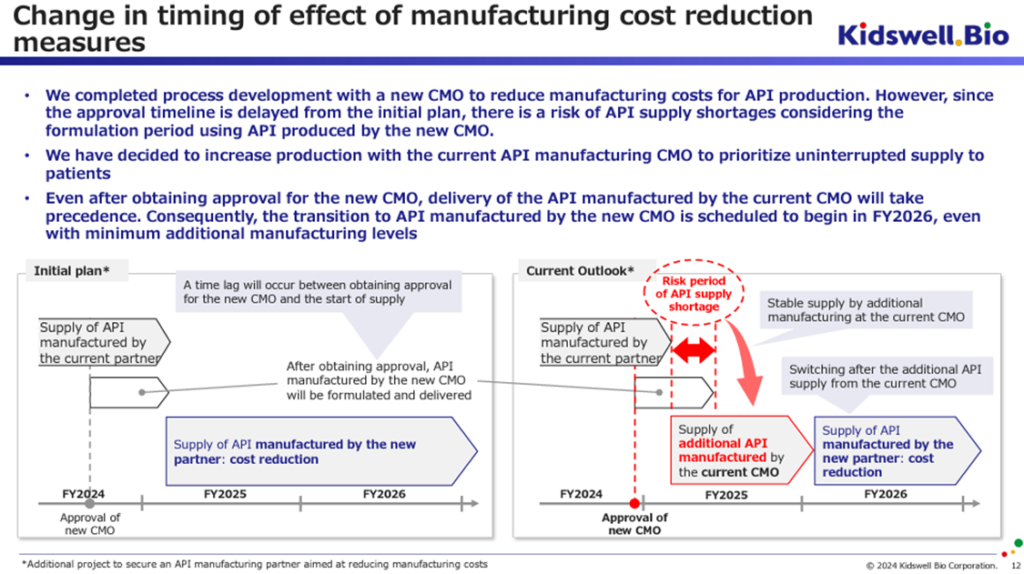
Countervailing factors include a decline in the gross profit margin due to inflation, the depreciation of the yen, and an expected increase in development investment for future growth. Furthermore, although the development of manufacturing processes at new contract manufacturers has been completed to reduce costs and significantly boost the gross profit margin, the expected timing for obtaining approval for this has been delayed by around six months compared to initial estimates. These have led to a postponement of the timing for achieving consolidated operating profitability.
Under the original plan, the company was to start receiving deliveries of bulk pharmaceuticals manufactured by the new contract manufacturer in FY2026/3 and to benefit from lower costs (and stable procurement). However, as the approval period was expected to be delayed, the company placed additional orders with the existing contract manufacturer to ensure a stable supply of biosimilars to medical institutions without interruption. From the perspective of providing a stable supply, the additional manufacturing at the existing contract manufacturer will cover the necessary active pharmaceutical ingredients, etc., during the FY2026/3 period, so the delivery of active pharmaceutical ingredients, etc., manufactured at the new contract manufacturer is expected to begin in the FY2027/3 period.
Looking at it this way, it seems reasonable to change the timing of the consolidated operating profit turnaround. As mentioned earlier, taking into account the actual results of the working capital reduction in the biosimilar business, the possibility of a license-out agreement being concluded by S-Quatre Corporation, the subsidiary in charge of the cell therapy business, and the preparations for a flexible capital policy, it is not necessary to view this matter in a particularly negative light.
◇Stock price trends and points to watch going forward
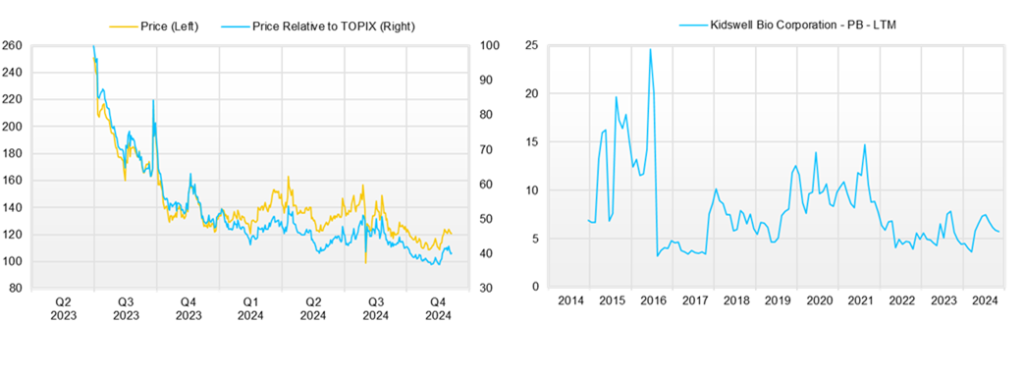
The company’s share price has been falling gradually over the last three months, but there have been signs of a rebound since late October. The share price reaction after the announcement of these results was also limited to a slight fall, and the stock market has begun to appreciate the positive factors for the company we have been discussing.
Based on the above, the critical point to watch in the near term will be whether or not the positive signs that have begun to appear in the stock market continue to develop. In other words, the company must ensure that it achieves its full-year consolidated earnings forecasts and continues to provide a stable supply and profitability of its marketed biosimilars. It must also optimize its cash flow over the FY2026/3 and FY2027/3 periods. It must also progress in the development and collaboration of new biosimilars and conclude contracts with development partners in the cell therapy business, which will be concluded as planned in FY2025/3. An agreement will be reached that clarifies the business potential of the cell therapy business. If additional funding from the stock market is needed, it will be suppressed, and of course, the company will achieve consolidated operating profit in FY2027/3. It is also necessary to continue to pay attention to exchange rate trends.
We look forward to the R&D briefing on December 3.
Company profile
Kidswell Bio Inc. (hereafter, the company) is a drug discovery venture company that originated at Hokkaido University. It is a pioneer in the biosimilar business, has obtained approval for, and supplies four products.
The company is also promoting a cell therapy business (regenerative medicine) that utilizes Stem cells from Human Exfoliated Deciduous teeth (SHED), and clinical research using autologous SHED for cerebral palsy (in the chronic stage) led by Nagoya University has already begun. To begin clinical trials of allogeneic SHED for cerebral palsy (in the chronic phase) in Japan, preparations are underway for the manufacture of the trial product, consultations are being held with the Pharmaceuticals and Medical Devices Agency, and it is planned that a contract will be concluded with the development partner company that will lead this clinical trial during FY2025/3. Preparations for international expansion are also underway.
In FY2025/3, SHED development was transferred to the newly established wholly owned subsidiary S-Quatre Corporation, and the company became a structure that mainly specialized in the biosimilar business, allowing it to visualize the business value of the two businesses and take the most appropriate financial strategy for each business.
The company aims to achieve consolidated operating income in FY2027/3.
Key financial data
| Unit: million yen | 2019/3 | 2020/3 | 2021/3 | 2023/3 | 2024/3 | 2025/3 CE |
| Sales | 1,078 | 997 | 1,569 | 2,776 | 2,431 | 4,000 |
| EBIT (Operating Income) | -1,161 | -970 | -976 | -551 | -1,336 | -1,000 |
| Pretax Income | -7,314 | -1,000 | -550 | -656 | -1,421 | |
| Net Profit Attributable to Owner of Parent | -7,316 | -1,001 | -551 | -657 | -1,422 | -950 |
| Cash & Short-Term Investments | 2,033 | 1,461 | 1,161 | 1,067 | 2,231 | |
| Total assets | 3,592 | 3,934 | 3,470 | 3,895 | 5,086 | |
| Total Debt | 2,575 | 2,575 | 2,575 | 2,575 | 2,575 | |
| Net Debt | 344 | 344 | 344 | 344 | 344 | |
| Total liabilities | 2,105 | 2,324 | 1,767 | 2,661 | 4,254 | |
| Total Shareholders’ Equity | 831 | 831 | 831 | 831 | 831 | |
| Net Operating Cash Flow | -1,325 | -1,267 | -1,170 | -1,421 | -454 | |
| Net Investing Cash Flow | -137 | -22 | 527 | -29 | 0 | |
| Net Financing Cash Flow | 1,222 | 718 | 369 | 1,356 | 1,618 | |
| Free Cash Flow | -1,327 | -1,267 | ||||
| ROA (%) | -216.99 | -26.61 | -14.88 | -17.85 | -31.67 | |
| ROE (%) | -346.86 | -64.66 | -33.25 | -44.78 | -137.73 | |
| EPS (Yen) | -264.7 | -34.8 | -17.9 | -20.8 | -40.2 | |
| BPS (Yen) | 53.8 | 54.4 | 54.2 | 38.5 | 21.4 | |
| Dividend per Share (Yen) | 0.00 | 0.00 | 0.00 | 0.00 | 0.00 | 0.00 |
| Shares Outstanding (Million shares) | 27.65 | 29.06 | 31.44 | 31.90 | 37.31 |
Source: Omega Investment from company data, rounded to the nearest whole number.
Share price
Quarterly topics
2Q earnings results
Source: company materials
Outlook for FY2025/3
Source: company materials
Change in the timing of achieving operating profit

Source: company materials
Source: company materials
Source: company materials
Financial data (quarterly basis)
| Unit: million yen | 2023/3 | 2024/3 | 2025/3 | ||||||
| 2Q | 3Q | 4Q | 1Q | 2Q | 3Q | 4Q | 1Q | 2Q | |
| (Income Statement) | |||||||||
| Sales | 505 | 611 | 1,049 | 46 | 536 | 985 | 864 | 483 | 1,267 |
| Year-on-year | 15.5% | -5.0% | 464.2% | -92.5% | 6.1% | 61.3% | -17.6% | 950.4% | 136.4% |
| Cost of Goods Sold (COGS) | 128 | 233 | 597 | 1 | 351 | 352 | 688 | 259 | 998 |
| Gross Income | 377 | 378 | 453 | 45 | 185 | 633 | 176 | 224 | 269 |
| Gross Income Margin | 74.6% | 61.8% | 43.2% | 98.1% | 34.5% | 64.3% | 20.4% | 46.3% | 21.2% |
| SG&A Expense | 328 | 524 | 868 | 500 | 449 | 580 | 845 | 383 | 372 |
| EBIT (Operating Income) | 49 | -147 | -415 | -455 | -265 | 53 | -669 | -159 | -104 |
| Year-on-year | -134.7% | -915.9% | 90.4% | 1097.7% | -638.6% | -135.9% | 60.9% | -65.1% | -60.9% |
| Operating Income Margin | 9.7% | -24.0% | -39.6% | -989.7% | -49.4% | 5.3% | -77.3% | -32.9% | -8.2% |
| EBITDA | 49 | -146 | -415 | -455 | -264 | 53 | -668 | -159 | -103 |
| Pretax Income | 39 | -152 | -462 | -470 | -309 | 35 | -676 | -176 | -65 |
| Consolidated Net Income | 38 | -152 | -463 | -471 | -310 | 33 | -675 | -177 | -65 |
| Minority Interest | 0 | 0 | 0 | 0 | 0 | 0 | 0 | 0 | 0 |
| Net Income ATOP | 38 | -152 | -463 | -471 | -310 | 33 | -675 | -177 | -65 |
| Year-on-year | -125.6% | -141.3% | 1.3% | 481.4% | -909.1% | -121.6% | 45.9% | -62.5% | -79.0% |
| Net Income Margin | 7.6% | -24.9% | -44.1% | -1023.6% | -57.8% | 3.3% | -78.0% | -36.6% | -5.1% |
| (Balance Sheet) | |||||||||
| Cash & Short-Term Investments | 1,875 | 1,500 | 1,067 | 625 | 622 | 2,187 | 2,231 | 1,167 | 1,695 |
| Total assets | 4,260 | 4,173 | 3,895 | 3,044 | 3,194 | 5,199 | 5,086 | 4,609 | 4,646 |
| Total Debt | 2,175 | 2,075 | 1,950 | 1,850 | 1,775 | 2,275 | 2,575 | 2,402 | 2,131 |
| Net Debt | 300 | 575 | 883 | 1,225 | 1,153 | 88 | 344 | 1,235 | 436 |
| Total liabilities | 2,560 | 2,485 | 2,661 | 2,276 | 2,119 | 3,755 | 4,254 | 3,895 | 3,789 |
| Total Shareholders’ Equity | 1,700 | 1,688 | 1,234 | 769 | 1,075 | 1,444 | 831 | 714 | 857 |
| (Profitability %) | |||||||||
| ROA | -3.21 | -16.14 | -17.85 | -28.50 | -37.43 | -25.82 | -31.67 | -29.48 | -22.54 |
| ROE | -7.05 | -34.05 | -44.78 | -86.81 | -100.55 | -77.27 | -137.73 | -152.15 | -91.46 |
| (Per-share) Unit: JPY | |||||||||
| EPS | 1.2 | -4.8 | -14.4 | -14.7 | -9.3 | 0.9 | -17.5 | -4.5 | -1.6 |
| BPS | 54.0 | 52.7 | 38.5 | 24.0 | 30.0 | 37.6 | 21.4 | 18.1 | 21.1 |
| Dividend per Share | 0.00 | 0.00 | 0.00 | 0.00 | 0.00 | 0.00 | 0.00 | 0.00 | 0.00 |
| Shares Outstanding(million shares) | 31.45 | 31.90 | 32.06 | 32.06 | 37.09 | 37.31 | 38.43 | 39.41 | 40.66 |
Source: Omega Investment from company materials
Financial data (full-year basis)
| Unit: million yen | 2014/3 | 2015/3 | 2016/3 | 2017/3 | 2018/3 | 2019/3 | 2020/3 | 2021/3 | 2022/3 | 2023/3 | 2024/3 |
| (Income Statement) | |||||||||||
| Sales | 301 | 61 | 1,161 | 1,089 | 1,060 | 1,022 | 1,078 | 997 | 1,569 | 2,776 | 2,431 |
| Year-on-year | 397.8% | -79.9% | 1817.7% | -6.2% | -2.7% | -3.6% | 5.5% | -7.5% | 57.5% | 76.9% | -12.4% |
| Cost of Goods Sold | 142 | 15 | 501 | 398 | 423 | 413 | 653 | 120 | 553 | 1,251 | 1,393 |
| Gross Income | 159 | 45 | 660 | 692 | 637 | 609 | 425 | 877 | 1,017 | 1,525 | 1,038 |
| Gross Income Margin | 52.8% | 74.5% | 56.9% | 63.5% | 60.1% | 59.6% | 39.4% | 88.0% | 64.8% | 54.9% | 42.7% |
| SG&A Expense | 672 | 403 | 1,480 | 1,876 | 1,551 | 1,414 | 1,586 | 1,847 | 1,992 | 2,076 | 2,374 |
| EBIT (Operating Income) | -512 | -358 | -820 | -1,184 | -913 | -806 | -1,161 | -970 | -976 | -551 | -1,336 |
| Year-on-year | 43.1% | -30.1% | 129.1% | 44.4% | -22.9% | -11.8% | 44.2% | -16.5% | 0.6% | -43.5% | 142.4% |
| Operating Income Margin | -170.0% | -591.6% | -70.7% | -108.7% | -86.2% | -78.8% | -107.8% | -97.3% | -62.2% | -19.8% | -54.9% |
| EBITDA | -512 | -358 | -820 | -1,184 | -913 | -805 | -1,161 | -969 | -973 | -550 | -1,335 |
| Pretax Income | -517 | -374 | -786 | -1,222 | -903 | -854 | -7,314 | -1,000 | -550 | -656 | -1,421 |
| Consolidated Net Income | -519 | -377 | -788 | -1,225 | -905 | -856 | -7,316 | -1,001 | -551 | -657 | -1,422 |
| Minority Interest | 0 | 0 | 0 | 0 | 0 | 0 | 0 | 0 | 0 | 0 | 0 |
| Net Income ATOP | -519 | -377 | -788 | -1,225 | -905 | -856 | -7,316 | -1,001 | -551 | -657 | -1,422 |
| Year-on-year | 37.7% | -27.4% | 108.9% | 55.5% | -26.1% | -5.3% | 754.4% | -86.3% | -45.0% | 19.3% | 116.3% |
| Net Income Margin | -172.3% | -622.9% | -67.9% | -112.4% | -85.4% | -83.8% | -678.9% | -100.5% | -35.1% | -23.7% | -58.5% |
| (Balance Sheet) | |||||||||||
| Cash & Short-Term Investments | 1,610 | 887 | 817 | 2,380 | 1,891 | 2,009 | 2,033 | 1,461 | 1,161 | 1,067 | 2,231 |
| Total assets | 1,887 | 922 | 1,694 | 3,706 | 3,025 | 3,151 | 3,592 | 3,934 | 3,470 | 3,895 | 5,086 |
| Total Debt | 775 | 0 | 810 | 0 | 0 | 0 | 1,225 | 1,100 | 700 | 1,950 | 2,575 |
| Net Debt | -835 | -887 | -7 | -2,380 | -1,891 | -2,009 | -808 | -361 | -461 | 883 | 344 |
| Total liabilities | 834 | 34 | 1,291 | 206 | 421 | 420 | 2,105 | 2,324 | 1,767 | 2,661 | 4,254 |
| Total Shareholders’ Equity | 1,053 | 888 | 403 | 3,500 | 2,604 | 2,731 | 1,487 | 1,610 | 1,703 | 1,234 | 831 |
| (Cash Flow) | |||||||||||
| Net Operating Cash Flow | -730 | -305 | -607 | -1,759 | -438 | -860 | -1,325 | -1,267 | -1,170 | -1,421 | -454 |
| Capital Expenditure | 0 | 0 | 2 | 0 | 0 | 0 | 2 | 3 | 0 | 0 | 0 |
| Net Investing Cash Flow | -2 | -0 | -122 | -150 | -50 | -0 | -137 | -22 | 527 | -29 | 0 |
| Net Financing Cash Flow | 1,454 | 907 | 947 | 3,472 | 0 | 978 | 1,222 | 718 | 369 | 1,356 | 1,618 |
| (Profitability %) | |||||||||||
| ROA | -36.97 | -26.84 | -60.21 | -45.35 | -26.88 | -27.73 | -216.99 | -26.61 | -14.88 | -17.85 | -31.67 |
| ROE | -53.51 | -38.85 | -122.00 | -62.74 | -29.64 | -32.10 | -346.86 | -64.66 | -33.25 | -44.78 | -137.73 |
| (Per-share) Unit: JPY | |||||||||||
| EPS | -60.0 | -59.6 | -75.7 | -68.5 | -47.3 | -43.8 | -264.7 | -34.8 | -17.9 | -20.8 | -40.2 |
| BPS | 110.4 | 106.7 | 34.9 | 182.9 | 136.1 | 134.3 | 53.8 | 54.4 | 54.2 | 38.5 | 21.4 |
| Dividend per Share | 0.00 | 0.00 | 0.00 | 0.00 | 0.00 | 0.00 | 0.00 | 0.00 | 0.00 | 0.00 | 0.00 |
| Shares Outstanding (million shrs) | 8.59 | 9.54 | 10.85 | 18.74 | 19.14 | 19.68 | 27.65 | 29.06 | 31.44 | 31.90 | 37.31 |
Source: Omega Investment from company materials
