2026-07-27
Home
Japanese

Omega Investment Co., Ltd.
Cosmo Bio (Company note – 3Q update)

| Share price (12/11) | ¥1,153 | Dividend Yield (24/12 CE) | 4.3 % |
| 52weeks high/low | ¥1,150/1,160 | ROE(23/12) | 5.4 % |
| Avg Vol (3 month) | 6.0 thou shrs | Operating margin (23/12) | 5.6 % |
| Market Cap | ¥6.97 bn | Beta (5Y Monthly) | 0.3 |
| Enterprise Value | ¥3.47 bn | Shares Outstanding | 6.048 mn shrs |
| PER (24/12 CE) | 21.7 X | Listed market | TSE Standard |
| PBR (23/12 act) | 0.8 X |
| Click here for the PDF version of this page |
| PDF version |
The 3Q cumulative total was in line with the plan despite an increase in revenue and a decrease in profit. We would like to see the progress of strategic measures confirmed in the full-year results.
◇ 3Q FY12/2024 Financial Highlights
Cosmo Bio’s 3Q FY12/2024 results, announced on November 7,2024, showed an increase in revenue but a decrease in profit but were generally in line with forecasts. On a cumulative basis, sales were 7.4 billion yen (+7% YoY), operating profit was 360 million yen (-17% YoY), and ordinary profit was 380 million yen (-30% YoY). Quarterly profit attributable to owner of parent was 290 million yen (-20% YoY).
Sales growth has accelerated since the 2Q, and the performance now exceeds the company’s expectations. Both research reagents and equipment have seen sales increase by 7%. Sales are progressing smoothly with university and corporate customers, and business with bio-ventures is also picking up.
However, the dollar-yen exchange rate fell to 150 yen per dollar on a cumulative basis (a depreciation of 12 yen YoY), and the gross profit margin fell 2.4 percentage points to 33.4% on a cumulative basis. Meanwhile, the company increased personnel expenses and other costs as expected, resulting in declining profits.
◇ FY12/2024 full-year earnings forecast unchanged
The company has again left its full-year earnings forecast unchanged. The forecast for the second half of the year is 150 yen to the dollar, sales of 9.8 billion yen (+4% YoY), operating profit of 390 million yen (-25% YoY), ordinary profit of 450 million yen (-31% YoY), and net profit attributable to owner of parent of 310 million yen (-30% YoY).
The current market rate for the dollar-yen exchange rate is weaker than the assumed rate, so caution is needed. However, the company believes that there is no need to change its initial plan, as the results up to the 3Q have progressed as expected, and it is also feeling a response to the increasing revenue trend.
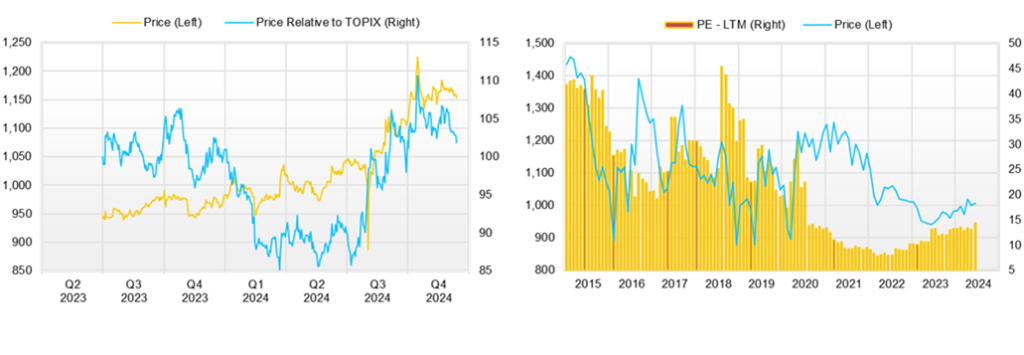
◇Stock Price Trends and Points to Watch
The company announced its 2Q results on August 5, 2024, when the stock market was in a sharp decline, and announced a full-year dividend increase and a share buyback ‘to achieve management conscious of capital costs and stock prices.’ The company’s share price has since performed strongly, outperforming the TOPIX. The yen has weakened since October, but the company’s share price has had no negative impact.
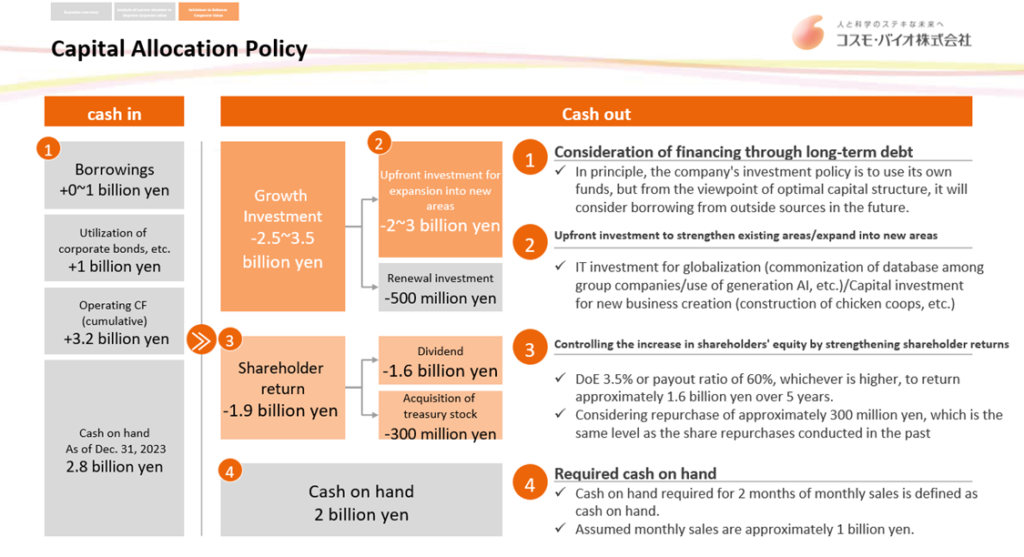
The main reasons for this are that, in addition to the fact that sales have been strong and profits are on track to meet expectations, there is little concern about a fall in valuations (although the 22x forecast PER is no longer considered undervalued), with a PBR of 0.77x and a forecast dividend yield of 4.25% (3.07% for the year-end dividend alone). Furthermore, the company has repurchased 95,200 shares worth approximately 100 million yen in total by the end of October, and it is expected to buy back approximately 200 million yen worth of shares by July 31, 2025. In addition, the company has set out a medium-term plan for improving its performance and ROE, with the aim of ‘to achieve management conscious of capital costs and stock prices’.
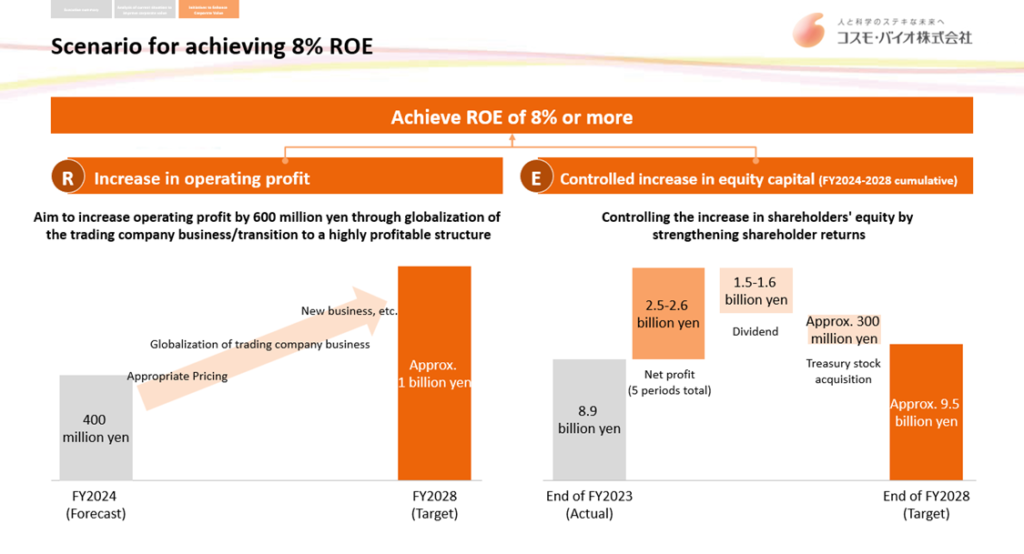
The next point to watch, on top of the dollar to yen rate, is whether the full-year results for FY12/2024 will be in line with expectations, whether the full-year earnings forecast for FY12/2025 will show an increase in profits, whether shareholder returns will be maintained or increased, and what progress will be shown in strategic measures that will lead to medium-term earnings growth and the achievement of an ROE of 8%.
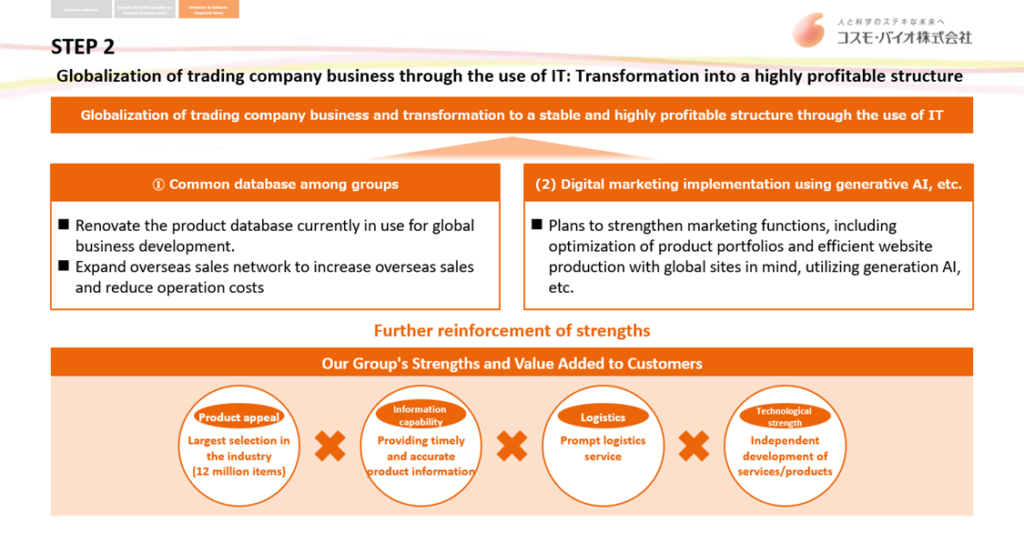
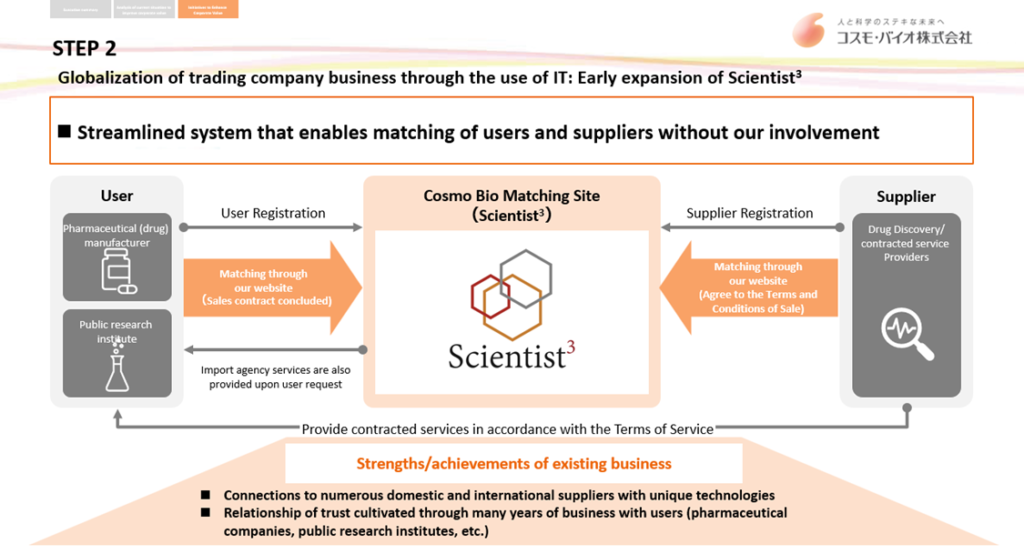
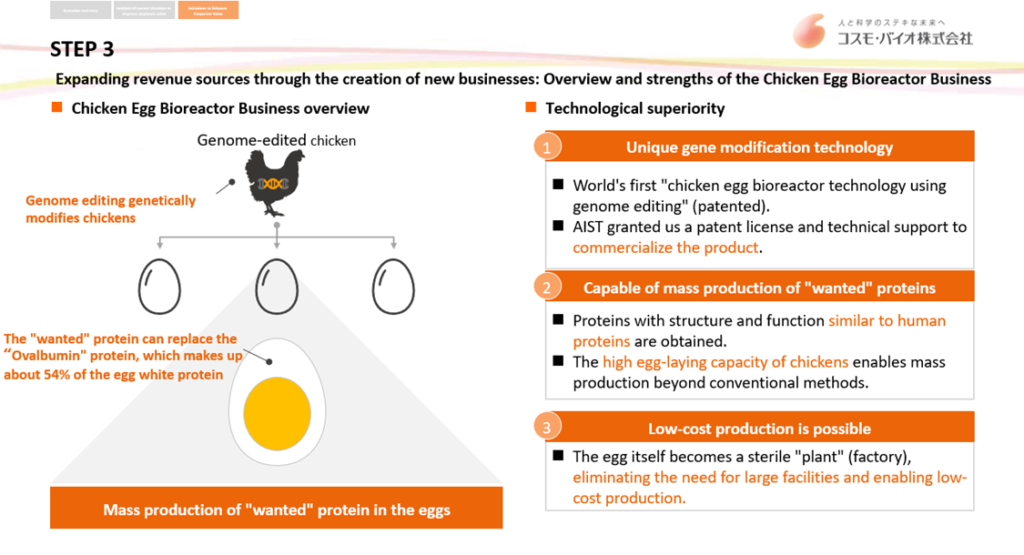
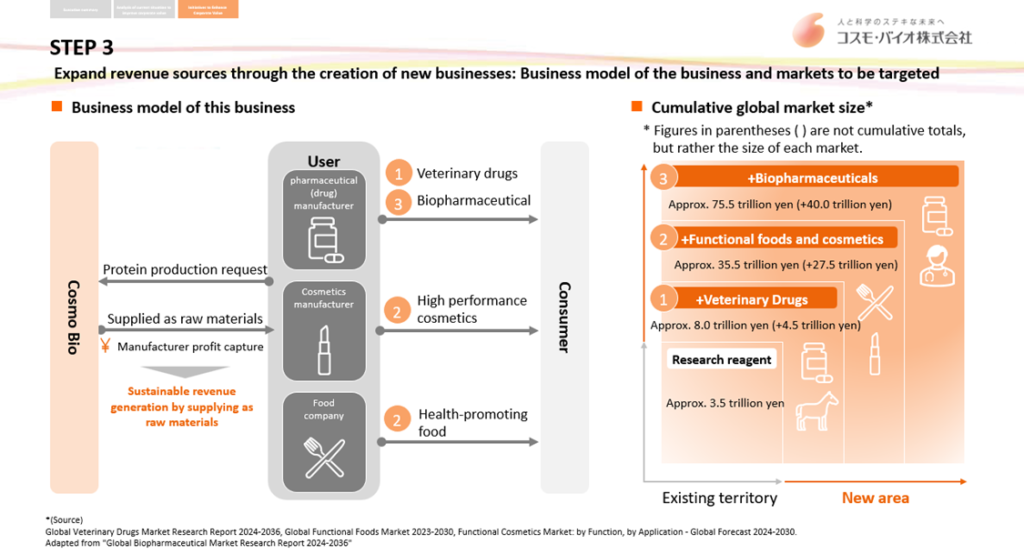
In particular, we are looking forward to seeing the globalization of the trading company business through the use of IT (we expect to see an increase in profits and a reduction in foreign exchange risk through the strengthening of exports), the launch of Scientist3, a matching site for commissioned services, and the visualization of the potential of the Chicken egg bioreactor business.
Company profile
Cosmo Bio Co., Ltd. is a trading company specializing in biotechnology with the objective of ‘contributing to the advancement of life science’. It is one of the leading providers of life science research reagents, offering as many as 12 million items from approximately 500 manufacturers worldwide. In recent years, it has expanded its trading company functions globally and entered into contract services and proprietary manufacturing and sales business. Expectations are high for this contribution to earnings, improved capital efficiency and higher PBR.
Key financial data
| Unit: million yen | 2019/12 | 2020/12 | 2021/12 | 2022/12 | 2023/12 | 2024/12CE |
| Sales | 7,590 | 8,092 | 9,231 | 9,553 | 9,340 | 9,800 |
| EBIT (Operating Income) | 406 | 753 | 1,050 | 817 | 521 | 390 |
| Pretax Income | 388 | 1,008 | 1,099 | 790 | 653 | 450 |
| Net Profit Attributable to Owner of Parent | 237 | 674 | 737 | 517 | 442 | 310 |
| Cash & Short-Term Investments | 2,516 | 3,259 | 3,555 | 3,036 | 3,025 | |
| Total assets | 8,890 | 9,640 | 10,072 | 10,313 | 10,872 | |
| Total Debt | 25 | 25 | 25 | 25 | 25 | |
| Net Debt | -3,000 | -3,000 | -3,000 | -3,000 | -3,000 | |
| Total liabilities | 1,566 | 1,776 | 1,750 | 1,693 | 1,844 | |
| Total Shareholders’ Equity | 8,445 | 8,445 | 8,445 | 8,445 | 8,445 | |
| Net Operating Cash Flow | 569 | 803 | 648 | 306 | 744 | |
| Capital Expenditure | 120 | 120 | 120 | 120 | 120 | |
| Net Investing Cash Flow | -135 | 42 | -145 | -313 | -766 | |
| Net Financing Cash Flow | -85 | -97 | -420 | -236 | -201 | |
| Free Cash Flow | 677 | 677 | 677 | 677 | 677 | |
| ROA (%) | 2.74 | 7.27 | 7.48 | 5.07 | 4.17 | |
| ROE (%) | 3.55 | 9.49 | 9.73 | 6.53 | 5.36 | |
| EPS (Yen) | 40.0 | 113.7 | 126.9 | 89.1 | 75.8 | |
| BPS (Yen) | 1,154.4 | 1,241.2 | 1,344.5 | 1,385.1 | 1,447.2 | |
| Dividend per Share (Yen) | 14.00 | 34.00 | 36.00 | 36.00 | 30.00 | 36.00 |
| Shares Outstanding (Million shrs) | 6.05 | 6.05 | 6.05 | 6.05 | 6.05 |
Source: Omega Investment from company data, rounded to the nearest whole number.
Share price
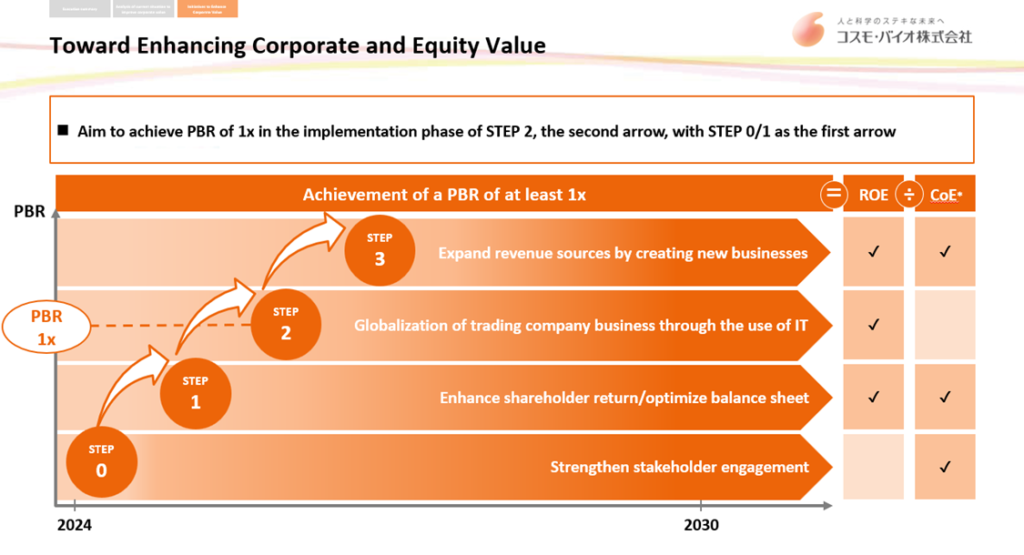
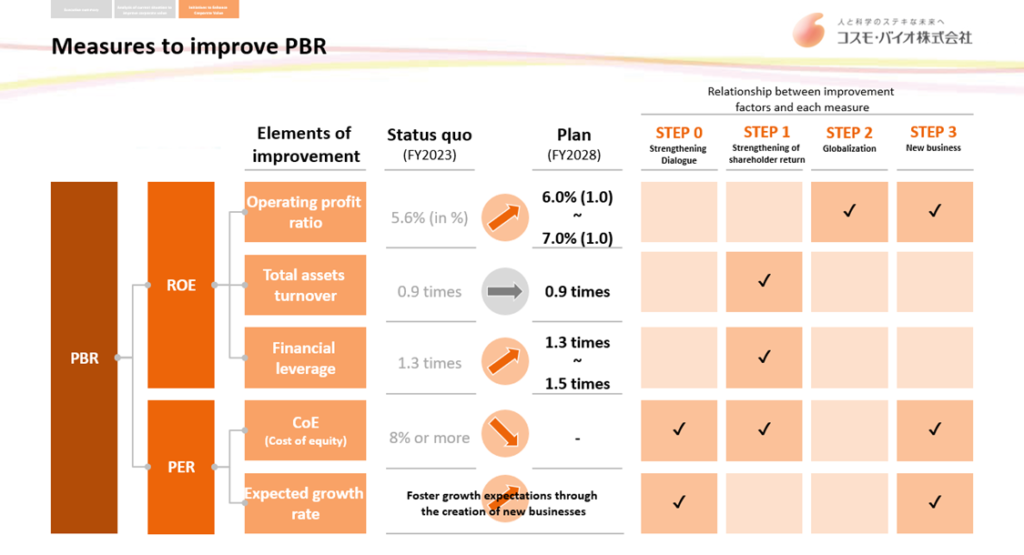
【Reposted】Key points in ‘Towards cost of capital and share price conscious management’
Source: Omega Investment from company materials
Source: Omega Investment from company materials
Source: Omega Investment from company materials
Source: Omega Investment from company materials
Source: Omega Investment from company materials
Source: Omega Investment from company materials
Source: Omega Investment from company materials
Source: Omega Investment from company materials
Source: Omega Investment from company materials
Financial data (quarterly basis)
| Unit: million yen | 2022/12 | 2023/12 | 2024/12 | ||||||
| 3Q | 4Q | 1Q | 2Q | 3Q | 4Q | 1Q | 2Q | 3Q | |
| (Income Statement) | |||||||||
| Sales | 2,016 | 2,426 | 2,828 | 1,999 | 2,050 | 2,463 | 2,943 | 2,186 | 2,280 |
| Year-on-year | -1.5% | 3.2% | -7.2% | -3.1% | 1.7% | 1.5% | 4.1% | 9.4% | 11.2% |
| Cost of Goods Sold (COGS) | 1,305 | 1,576 | 1,789 | 1,273 | 1,350 | 1,678 | 1,956 | 1,460 | 1,522 |
| Gross Income | 711 | 850 | 1,039 | 726 | 700 | 785 | 987 | 726 | 758 |
| Gross Income Margin | 35.3% | 35.0% | 36.7% | 36.3% | 34.1% | 31.9% | 33.5% | 33.2% | 33.2% |
| SG&A Expense | 635 | 736 | 638 | 668 | 711 | 712 | 681 | 708 | 713 |
| EBIT (Operating Income) | 76 | 114 | 401 | 58 | -11 | 73 | 306 | 18 | 45 |
| Year-on-year | -57.5% | -26.0% | -30.9% | 23.4% | -114.5% | -36.0% | -23.7% | -69.0% | -509.1% |
| Operating Income Margin | 3.8% | 4.7% | 14.2% | 2.9% | -0.5% | 3.0% | 10.4% | 0.8% | 2.0% |
| EBITDA | 112 | 153 | 435 | 94 | 28 | 112 | 336 | 50 | 79 |
| Pretax Income | 70 | 100 | 416 | 136 | 2 | 99 | 353 | 37 | 48 |
| Consolidated Net Income | 51 | 76 | 279 | 98 | 1 | 83 | 240 | 27 | 34 |
| Minority Interest | 5 | 13 | 15 | 1 | -5 | 8 | 10 | -2 | 2 |
| Net Income ATOP | 47 | 63 | 264 | 97 | 5 | 76 | 230 | 28 | 33 |
| Year-on-year | -62.4% | -48.4% | -27.9% | 136.6% | -89.4% | 20.6% | -12.9% | -71.1% | 560.0% |
| Net Income Margin | 2.3% | 2.6% | 9.3% | 4.9% | 0.2% | 3.1% | 7.8% | 1.3% | 1.4% |
| (Balance Sheet) | |||||||||
| Cash & Short-Term Investments | 3,347 | 3,036 | 3,026 | 3,852 | 3,637 | 3,025 | 2,813 | 3,224 | 3,044 |
| Total assets | 10,098 | 10,313 | 10,695 | 10,852 | 10,773 | 10,872 | 11,594 | 11,739 | 11,333 |
| Total Debt | 136 | 27 | 183 | 228 | 219 | 25 | 316 | 418 | 370 |
| Net Debt | -3,211 | -3,009 | -2,843 | -3,624 | -3,418 | -3,000 | -2,497 | -2,806 | -2,674 |
| Total liabilities | 1,565 | 1,693 | 1,865 | 1,762 | 1,772 | 1,844 | 2,101 | 1,953 | 1,853 |
| Total Sharehjolders’ Equity | 7,979 | 8,052 | 8,250 | 8,509 | 8,426 | 8,445 | 8,903 | 9,197 | 8,889 |
| (Profitability %) | |||||||||
| ROA | 5.79 | 5.07 | 3.91 | 4.44 | 4.12 | 4.17 | 3.66 | 3.01 | 3.31 |
| ROE | 7.34 | 6.53 | 5.13 | 5.69 | 5.24 | 5.36 | 4.76 | 3.84 | 4.23 |
| (Per-share) Unit: JPY | |||||||||
| EPS | 8.1 | 10.8 | 45.4 | 16.6 | 0.9 | 13.0 | 39.4 | 4.8 | 5.7 |
| BPS | 1,372.3 | 1,385.1 | 1,419.2 | 1,458.0 | 1,443.9 | 1,447.2 | 1,525.8 | 1,569.7 | 1,532.0 |
| Dividend per Share | 36.00 | 36.00 | 36.00 | 36.00 | 36.00 | 30.00 | 30.00 | 30.00 | 30.00 |
| Shares Outstanding(million shrs) | 6.05 | 6.05 | 6.05 | 6.05 | 6.05 | 6.05 | 6.05 | 6.05 | 6.05 |
Source: Omega Investment from company materials
Financial data (full-year basis)
| Unit: million yen | 2014/12 | 2015/12 | 2016/12 | 2017/12 | 2018/12 | 2019/12 | 2020/12 | 2021/12 | 2022/12 | 2023/12 |
| (Income Statement) | ||||||||||
| Sales | 7,235 | 7,357 | 7,427 | 7,068 | 7,261 | 7,590 | 8,092 | 9,231 | 9,553 | 9,340 |
| Year-on-year | 2.6% | 1.7% | 1.0% | -4.8% | 2.7% | 4.5% | 6.6% | 14.1% | 3.5% | -2.2% |
| Cost of Goods Sold | 4,811 | 4,976 | 4,655 | 4,535 | 4,607 | 4,710 | 4,940 | 5,572 | 6,112 | 6,090 |
| Gross Income | 2,424 | 2,381 | 2,772 | 2,533 | 2,654 | 2,880 | 3,152 | 3,659 | 3,441 | 3,250 |
| Gross Income Margin | 33.5% | 32.4% | 37.3% | 35.8% | 36.6% | 37.9% | 39.0% | 39.6% | 36.0% | 34.8% |
| SG&A Expense | 2,262 | 2,181 | 2,257 | 2,339 | 2,330 | 2,474 | 2,399 | 2,609 | 2,624 | 2,729 |
| EBIT (Operating Income) | 162 | 200 | 515 | 194 | 324 | 406 | 753 | 1,050 | 817 | 521 |
| Year-on-year | -40.2% | 23.5% | 157.5% | -62.3% | 67.0% | 25.3% | 85.5% | 39.4% | -22.2% | -36.2% |
| Operating Income Margin | 2.2% | 2.7% | 6.9% | 2.7% | 4.5% | 5.3% | 9.3% | 11.4% | 8.6% | 5.6% |
| EBITDA | 248 | 279 | 600 | 350 | 507 | 613 | 928 | 1,216 | 958 | 669 |
| Pretax Income | 330 | 407 | 456 | 400 | 403 | 388 | 1,008 | 1,099 | 790 | 653 |
| Consolidated Net Income | 200 | 249 | 276 | 250 | 278 | 246 | 701 | 768 | 552 | 461 |
| Minority Interest | -1 | 19 | 22 | 12 | 17 | 8 | 27 | 31 | 35 | 19 |
| Net Income ATOP | 201 | 230 | 254 | 237 | 260 | 237 | 674 | 737 | 517 | 442 |
| Year-on-year | -35.8% | 14.4% | 10.4% | -6.7% | 9.7% | -8.8% | 184.4% | 9.3% | -29.9% | -14.5% |
| Net Income Margin | 2.8% | 3.1% | 3.4% | 3.4% | 3.6% | 3.1% | 8.3% | 8.0% | 5.4% | 4.7% |
| (Balance Sheet) | ||||||||||
| Cash & Short-Term Investments | 1,482 | 1,498 | 1,948 | 1,483 | 2,268 | 2,516 | 3,259 | 3,555 | 3,036 | 3,025 |
| Total assets | 8,161 | 7,790 | 7,934 | 8,126 | 8,485 | 8,890 | 9,640 | 10,072 | 10,313 | 10,872 |
| Total Debt | 20 | 20 | 20 | 20 | 20 | 20 | 20 | 28 | 27 | 25 |
| Net Debt | -1,462 | -1,478 | -1,928 | -1,463 | -2,248 | -2,496 | -3,239 | -3,527 | -3,009 | -3,000 |
| Total liabilities | 1,629 | 1,412 | 1,350 | 1,286 | 1,430 | 1,566 | 1,776 | 1,750 | 1,693 | 1,844 |
| Total Sharehjolders’ Equity | 6,050 | 5,951 | 6,135 | 6,381 | 6,581 | 6,843 | 7,358 | 7,787 | 8,052 | 8,445 |
| (Cash Flow) | ||||||||||
| Net Operating Cash Flow | 297 | 129 | 573 | 294 | 909 | 569 | 803 | 648 | 306 | 744 |
| Capital Expenditure | 70 | 175 | 252 | 546 | 152 | 182 | 76 | 156 | 119 | 120 |
| Net Investing Cash Flow | -227 | -263 | 99 | -440 | -186 | -135 | 42 | -145 | -313 | -766 |
| Net Financing Cash Flow | -122 | -151 | -107 | -109 | -85 | -85 | -97 | -420 | -236 | -201 |
| Free Cash Flow | 244 | 80 | 444 | -185 | 858 | 428 | 767 | 617 | 251 | 677 |
| (Profitability %) | ||||||||||
| ROA | 2.45 | 2.88 | 3.23 | 2.96 | 3.14 | 2.74 | 7.27 | 7.48 | 5.07 | 4.17 |
| ROE | 3.25 | 3.83 | 4.20 | 3.80 | 4.03 | 3.55 | 9.49 | 9.73 | 6.53 | 5.36 |
| (Per-share) Unit: JPY | ||||||||||
| EPS | 33.9 | 38.8 | 42.8 | 40.0 | 43.9 | 40.0 | 113.7 | 126.9 | 89.1 | 75.8 |
| BPS | 1,020.6 | 1,003.9 | 1,034.9 | 1,076.4 | 1,110.2 | 1,154.4 | 1,241.2 | 1,344.5 | 1,385.1 | 1,447.2 |
| Dividend per Share | 20.00 | 16.00 | 18.00 | 14.00 | 14.00 | 14.00 | 34.00 | 36.00 | 36.00 | 30.00 |
| Shares Outstanding(million shrs) | 6.05 | 6.05 | 6.05 | 6.05 | 6.05 | 6.05 | 6.05 | 6.05 | 6.05 | 6.05 |
Source: Omega Investment from company materials