2026-04-10
Home
Japanese

Omega Investment Co., Ltd.
SUMIDA CORPORATION (Company note – 2Q update)

| Share price (8/25) | ¥1,056 | Dividend Yield (12/25 CE) | 5.0 % |
| 52weeks high/low | ¥757/1,064 | ROE(12/24) | 1.0 % |
| Avg Vol (3 month) | 227.9 thou shrs | Operating margin (12/24) | 3.1 % |
| Market Cap | ¥34.96 bn | Beta (5Y Monthly) | 0.93 |
| Enterprise Value | ¥86.16 bn | Shares Outstanding | 33.108 mn shrs |
| PER (12/25 CE) | 10.9 X | Listed market | TSE Prime section |
| PBR (12/24 act) | 0.61 X |
| Click here for the PDF version of this page |
| PDF version |
Profitability has improved, strengthening the downside rigidity of earnings
◇ Highlights of results for the second quarter (first half) of FY12/2025: profitability improved markedly
Sumida Corporation (the “Company”) announced on July 31, 2025, the results for the second quarter (first half) of the fiscal year ending December 2025. While revenue recorded a slight YoY decline, operating profit, interim profit before income taxes, and interim profit attributable to owners of the parent recovered. The effects of profitability improvements, including the cost structure reform implemented at the end of last year, have become evident.
For the first half, revenue was 71.17 billion yen (down 2.6% YoY), operating profit was 3.36 billion yen (up 44.2% YoY), interim profit before income taxes was 2.17 billion yen (up 196.6% YoY), and interim profit attributable to owners of the parent 1.66 billion yen (up 243.0% YoY). In the second quarter alone, revenue was 35.7 billion yen (down 2.6% YoY) and operating profit was 2.1 billion yen (up 86.9% YoY), indicating that profitability improvements have continued for two quarters.
The key points of these results are the following three.
First, revenue was weak. Automotive Electronics declined to 42.98 billion yen (down 5.4% YoY) due to sluggish sales to European manufacturers; Industrial Electronics softened to 18.07 billion yen (down 0.8% YoY) due to weakness in xEV rapid-charging infrastructure and solar power generation-related business in Europe. Consumer Electronics performed well at 10.11 billion yen (up 7.3% YoY); however, this was helped by compensation received from certain customers for reduced order volumes, and excluding this factor, the segment appears to be stagnant.
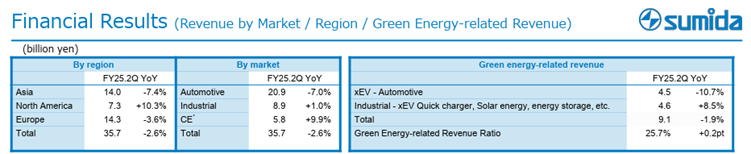
Source: Company material
Second, despite the above, profitability improved. Completion of restructuring in Europe, progress in optimizing manufacturing overhead in China, and the compensation mentioned above enabled higher profit despite lower revenue. As a result, the first half appears to have landed in line with the Company’s plan.
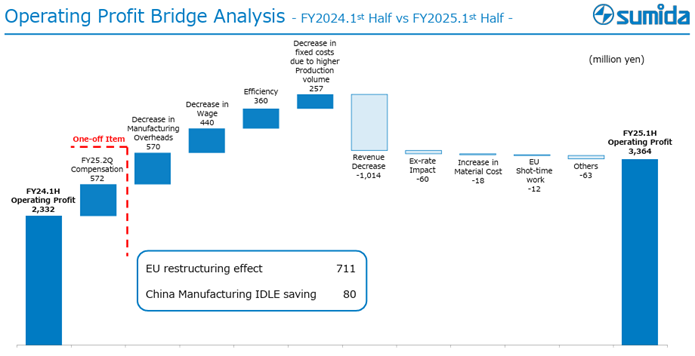
Source: Company material
Third, there are no issues with inventory trends. Amid lower revenue, inventory turnover days were 79 days, eight days fewer YoY.
◇ Forecast for FY12/2025: unchanged; assumes continued profitability improvement
The full-year earnings forecast has been left unchanged.
Revenue of 144.0 billion yen (flat YoY), operating profit of 7.0 billion yen (up 55.1% YoY), profit before income taxes of 4.08 billion yen (up 214.9% YoY), and profit attributable to owners of the parent of 3.20 billion yen (up 441.5% YoY). There are also no changes to basic earnings per share of 96.83 yen and an annual dividend per share of 53 yen.
◇ Stock price trends and points to watch going forward
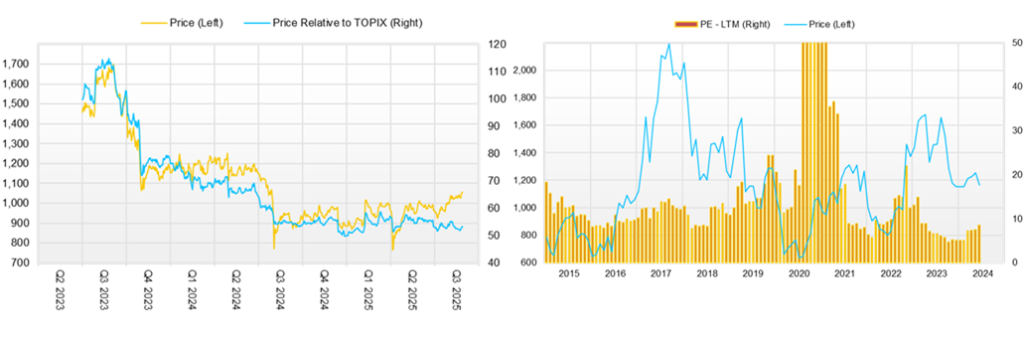
The Company’s stock price edged higher following the announcement of results for the first quarter of FY12/2025, and at present, the 1,000-yen level has taken hold. Viewed over the long term, it is supported by a gentle upward trendline since 2012. Behind this are factors such as a PBR of around 0.6x and, as confirmed in these results, the successful securing of profitability even amid declining revenue, limiting downside risk. On the other hand, a resistance line has also formed from the 2017 high of 2,400 yen, and the stock price is within a large symmetrical triangle pattern.
Given this positioning of the stock price, points to watch going forward are whether downside risk on the earnings front will diminish further and whether new drivers of revenue will emerge, centered on the green energy-related fields on which the Company is focusing, enabling a return to a trend of higher revenue and profit and a recovery in ROE. If a prospect takes shape for stably achieving ROE over the cost of capital, there is a possibility that PBR will exceed 1x and the stock will break out of the triangle pattern to the upside, which merits attention.
Points to check in the near term are as follows.
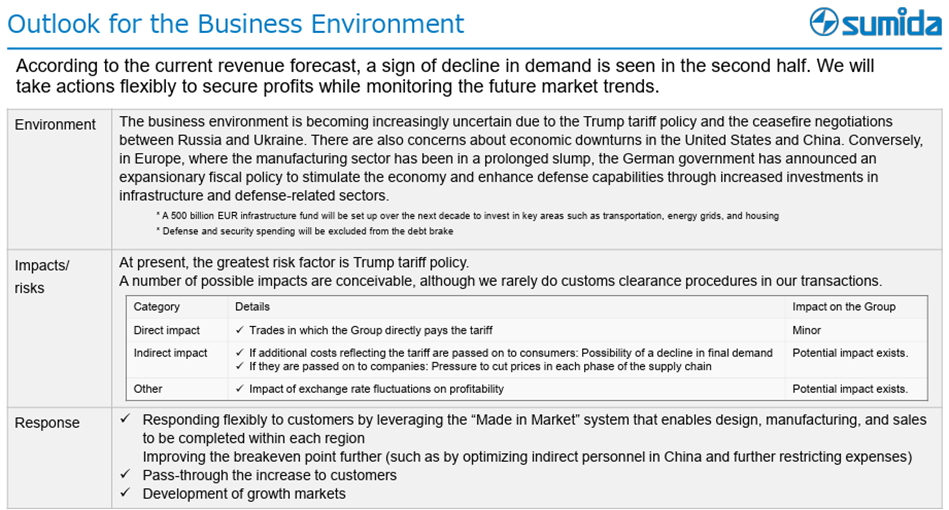
• Success or failure in securing profitability at present: According to the full-year forecast, increases in both revenue and profit are needed in the second half. However, according to the financial results presentation materials, there are signs of slowing demand at present. In particular, while the Company’s direct impact from U.S. tariff policy is slight, its customer base will not be immune, and indirect effects on the Company are conceivable. Accordingly, it will be necessary each quarter to check whether further optimization of manufacturing overhead in China progresses, whether the Company can respond flexibly to customers by leveraging it made in market framework, and whether profit and loss are steadily secured as a result.
• Continued accumulation of acquired projects: It is essential that newly acquired projects, as a leading indicator of the Company’s medium-term results, continue to accumulate steadily in line with the Mid-Term Business Plan. While xEV-related and solar power generation-related areas are showing increasingly different market trends by region, attention will focus on whether these can be reliably converted into projects and whether project formation will progress for rising demand, across regions, for AI-related storage batteries and the like. As a result, it is hoped that the likelihood of achieving the specific numerical targets set out in the new Mid-Term Business Plan, revenue of 190.0 billion yen and operating profit of 13.5 billion yen, will increase.
Note also that attention is required to fluctuations in exchange rate trends and prices of key raw materials such as copper.
Source: Company material
Company profile
Since its founding in 1950, it has been a global leader in the design and manufacturing of coil-related components and modules. Leveraging advanced technical design capabilities cultivated through many years of experience, proprietary manufacturing know-how, the ability to expand into a wide range of applications, and a solid global production structure, it operates mainly as a custom-made contract manufacturing business for major customers around the world under a “Made in Market” model. The Company’s business is characterized by a well-balanced, decentralized portfolio both geographically and by market segment.
In recent years, it has grown its results in so-called “green energy-related” fields. That said, the business environment is currently in a lull. Moreover, although there are many uncertainties, such as tariff issues, the Company has moved quickly to strengthen its cost structure and is delivering results.
Key points to watch going forward are whether “green energy-related” will, while broadening its base, drive the Company’s earnings; whether, as a result, the operating profit margin and ROE will increase toward the assumptions of the Mid-Term Business Plan; and whether, in turn, PBR will exceed 1x.
Key financial data
| Unit: million yen | 2020 | 2021 | 2022 | 2023 | 2024 | 2025 CE |
| Sales | 84,417 | 104,920 | 138,600 | 147,672 | 143,978 | 144,000 |
| EBIT (Operating Income) | 2,300 | 5,669 | 7,983 | 8,829 | 5,633 | |
| Pretax Income | 1,470 | 3,898 | 6,534 | 5,856 | 1,295 | |
| Net Profit Attributable to Owner of Parent | 828 | 2,629 | 5,099 | 5,064 | 590 | 3,200 |
| Cash & Short-Term Investments | 5,237 | 4,237 | 2,944 | 3,107 | 4,286 | |
| Total assets | 98,063 | 117,725 | 134,846 | 142,786 | 147,766 | |
| Total Debt | 44,586 | 54,763 | 58,546 | 57,198 | 57,975 | |
| Net Debt | 39,349 | 50,526 | 55,602 | 54,091 | 53,689 | |
| Total liabilities | 63,503 | 77,622 | 85,966 | 85,471 | 86,849 | |
| Total Shareholders’ Equity | 32,990 | 38,338 | 46,829 | 55,056 | 58,648 | |
| Net Operating Cash Flow | 9,107 | 600 | 10,566 | 18,343 | 14,928 | |
| Capital Expenditure | 6,765 | 6,737 | 9,174 | 10,914 | 9,005 | |
| Net Investing Cash Flow | -6,669 | -6,712 | -8,174 | -10,702 | -8,834 | |
| Net Financing Cash Flow | -447 | 4,751 | -4,130 | -7,782 | -5,268 | |
| Free Cash Flow | 3,118 | -5,212 | 2,362 | 8,539 | 7,068 | |
| ROA (%) | 0.85 | 2.44 | 4.04 | 3.65 | 0.41 | |
| ROE (%) | 2.51 | 7.37 | 11.98 | 9.94 | 1.04 | |
| EPS (Yen) | 30.5 | 96.7 | 187.5 | 167.4 | 17.9 | 96.8 |
| BPS (Yen) | 1,213.7 | 1,409.8 | 1,722.1 | 1,687.4 | 1,774.6 | |
| Dividend per Share (Yen) | 9.00 | 28.00 | 47.00 | 51.00 | 53.00 | 53.00 |
| Shares Outstanding (Million shares) | 27.44 | 27.44 | 27.44 | 32.88 | 33.10 |
Source: Omega Investment from company materials
Share price
Financial data (quarterly basis)
| Unit: million yen | 2024/12 | 2025/12 | 2026/12 | ||||||
| 2Q | 3Q | 4Q | 1Q | 2Q | 3Q | 4Q | 1Q | 2Q | |
| (Income Statement) | |||||||||
| Sales | 37,662 | 37,718 | 36,739 | 36,313 | 36,752 | 36,470 | 34,442 | 35,390 | 35,780 |
| Year-on-year | 15.4% | -2.7% | -2.4% | 2.1% | -2.4% | -3.3% | -6.3% | -2.5% | -2.6% |
| Cost of Goods Sold (COGS) | 31,927 | 31,752 | 32,584 | 32,014 | 32,263 | 31,656 | 30,037 | 31,007 | 30,524 |
| Gross Income | 5,735 | 5,966 | 4,155 | 4,299 | 4,489 | 4,814 | 4,405 | 4,383 | 5,256 |
| Gross Income Margin | 15.2% | 15.8% | 11.3% | 11.8% | 12.2% | 13.2% | 12.8% | 12.4% | 14.7% |
| SG&A Expense | 3,142 | 3,090 | 3,006 | 3,218 | 3,353 | 3,091 | 2,713 | 3,151 | 3,059 |
| EBIT (Operating Income) | 2,593 | 2,876 | 1,149 | 1,081 | 1,136 | 1,723 | 1,692 | 1,232 | 2,197 |
| Year-on-year | 92.2% | -8.5% | -56.3% | -51.1% | -56.2% | -40.1% | 47.3% | 14.0% | 93.4% |
| Operating Income Margin | 6.9% | 7.6% | 3.1% | 3.0% | 3.1% | 4.7% | 4.9% | 3.5% | 6.1% |
| EBITDA | 4,828 | 5,283 | 3,718 | 3,707 | 3,956 | 4,552 | 4,439 | 3,809 | 5,618 |
| Pretax Income | 2,419 | 1,426 | 387 | 464 | 268 | 951 | -389 | 802 | 1,372 |
| Consolidated Net Income | 2,050 | 1,060 | 757 | 313 | 114 | 710 | -703 | 580 | 1,053 |
| Minority Interest | 7 | -23 | 53 | -35 | -23 | -46 | -52 | -5 | -29 |
| Net Income ATOP | 2,043 | 1,083 | 702 | 348 | 137 | 756 | -652 | 585 | 1,082 |
| Year-on-year | 230.6% | -47.8% | -66.0% | -71.8% | -93.3% | -30.2% | -192.9% | 68.1% | 689.8% |
| Net Income Margin | 5.4% | 2.9% | 1.9% | 1.0% | 0.4% | 2.1% | -1.9% | 1.7% | 3.0% |
| (Balance Sheet) | |||||||||
| Cash & Short-Term Investments | 9,903 | 6,439 | 3,107 | 6,002 | 5,156 | 4,750 | 4,286 | 6,087 | 5,429 |
| Total assets | 150,733 | 149,591 | 142,786 | 152,361 | 159,600 | 143,335 | 147,766 | 144,110 | 142,062 |
| Total Debt | 60,772 | 57,166 | 57,198 | 63,785 | 65,509 | 58,303 | 57,975 | 58,367 | 57,039 |
| Net Debt | 50,869 | 50,727 | 54,091 | 57,783 | 60,353 | 53,553 | 53,689 | 52,280 | 51,610 |
| Total liabilities | 88,503 | 85,870 | 85,471 | 92,128 | 95,474 | 85,403 | 86,849 | 85,709 | 83,098 |
| Total Shareholders’ Equity | 59,952 | 61,426 | 55,056 | 57,875 | 61,653 | 55,751 | 58,648 | 56,205 | 56,801 |
| (Profitability %) | |||||||||
| ROA | 5.11 | 4.41 | 3.65 | 2.89 | 1.46 | 1.33 | 0.41 | 0.56 | 1.17 |
| ROE | 14.17 | 11.79 | 9.94 | 7.90 | 3.74 | 3.32 | 1.04 | 1.45 | 2.99 |
| (Per-share) Unit: JPY | |||||||||
| EPS | 71.8 | 33.2 | 21.5 | 10.7 | 4.2 | 22.9 | -19.7 | 17.7 | 32.7 |
| BPS | 1,837.4 | 1,882.6 | 1,687.4 | 1,773.8 | 1,867.5 | 1,687.0 | 1,774.6 | 1,700.6 | 1,718.1 |
| Dividend per Share | 23.00 | 0.00 | 28.00 | 0.00 | 26.00 | 0.00 | 27.00 | 0.00 | 26.00 |
| Shares Outstanding (million shares) | 32.88 | 32.88 | 32.88 | 32.88 | 33.04 | 33.10 | 33.10 | 33.10 | 33.11 |
Source: Omega Investment from company materials
Financial data (full-year basis)
| Unit: million yen | 2015 | 2016 | 2017 | 2018 | 2019 | 2020 | 2021 | 2022 | 2023 | 2024 |
| (Income Statement) | ||||||||||
| Sales | 86,236 | 81,052 | 90,153 | 97,538 | 94,283 | 84,417 | 104,920 | 138,600 | 147,672 | 143,978 |
| Year-on-year | 11.2% | -6.0% | 11.2% | 8.2% | -3.3% | -10.5% | 24.3% | 32.1% | 6.5% | -2.5% |
| Cost of Goods Sold | 71,628 | 66,191 | 75,019 | 82,192 | 81,414 | 73,319 | 89,563 | 119,298 | 126,561 | 125,970 |
| Gross Income | 14,608 | 14,861 | 15,134 | 15,346 | 12,869 | 11,098 | 15,357 | 19,302 | 21,111 | 18,008 |
| Gross Income Margin | 16.9% | 18.3% | 16.8% | 15.7% | 13.6% | 13.1% | 14.6% | 13.9% | 14.3% | 12.5% |
| SG&A Expense | 10,371 | 8,507 | 8,837 | 9,694 | 9,330 | 8,798 | 9,688 | 11,319 | 12,282 | 12,375 |
| EBIT (Operating Income) | 4,237 | 6,354 | 6,297 | 5,652 | 3,539 | 2,300 | 5,669 | 7,983 | 8,829 | 5,633 |
| Year-on-year | 26.7% | 50.0% | -0.9% | -10.2% | -37.4% | -35.0% | 146.5% | 40.8% | 10.6% | -36.2% |
| Operating Income Margin | 4.9% | 7.8% | 7.0% | 5.8% | 3.8% | 2.7% | 5.4% | 5.8% | 6.0% | 3.9% |
| EBITDA | 8,443 | 9,251 | 9,574 | 9,660 | 8,848 | 8,247 | 12,337 | 16,103 | 18,190 | 16,655 |
| Pretax Income | 2,932 | 5,469 | 5,697 | 4,061 | 2,184 | 1,470 | 3,898 | 6,534 | 5,856 | 1,295 |
| Consolidated Net Income | 2,188 | 3,844 | 4,628 | 2,531 | 1,596 | 839 | 2,695 | 5,168 | 5,102 | 434 |
| Minority Interest | 156 | 178 | 123 | 110 | 13 | 11 | 66 | 68 | 37 | -156 |
| Net Income ATOP | 2,032 | 3,666 | 4,504 | 2,420 | 1,582 | 828 | 2,629 | 5,099 | 5,064 | 590 |
| Year-on-year | 51.0% | 80.4% | 22.9% | -46.3% | -34.6% | -47.7% | 217.5% | 94.0% | -0.7% | -88.3% |
| Net Income Margin | 2.4% | 4.5% | 5.0% | 2.5% | 1.7% | 1.0% | 2.5% | 3.7% | 3.4% | 0.4% |
| (Balance Sheet) | ||||||||||
| Cash & Short-Term Investments | 3,569 | 3,546 | 5,375 | 4,098 | 3,286 | 5,237 | 4,237 | 2,944 | 3,107 | 4,286 |
| Total assets | 67,876 | 69,007 | 84,366 | 94,277 | 96,561 | 98,063 | 117,725 | 134,846 | 142,786 | 147,766 |
| Total Debt | 33,879 | 30,611 | 35,836 | 40,206 | 43,646 | 44,586 | 54,763 | 58,546 | 57,198 | 57,975 |
| Net Debt | 30,310 | 27,065 | 30,461 | 36,108 | 40,360 | 39,349 | 50,526 | 55,602 | 54,091 | 53,689 |
| Total liabilities | 49,207 | 46,982 | 54,242 | 58,835 | 61,963 | 63,503 | 77,622 | 85,966 | 85,471 | 86,849 |
| Total Shareholders’ Equity | 17,411 | 20,629 | 28,570 | 33,829 | 33,013 | 32,990 | 38,338 | 46,829 | 55,056 | 58,648 |
| (Cash Flow) | ||||||||||
| Net Operating Cash Flow | 5,515 | 8,291 | 3,658 | 4,672 | 8,732 | 9,107 | 600 | 10,566 | 18,343 | 14,928 |
| Capital Expenditure | 4,448 | 5,024 | 9,511 | 9,610 | 8,302 | 6,765 | 6,737 | 9,174 | 10,914 | 9,005 |
| Net Investing Cash Flow | -4,366 | -4,961 | -9,254 | -15,153 | -8,133 | -6,669 | -6,712 | -8,174 | -10,702 | -8,834 |
| Net Financing Cash Flow | -1,054 | -3,016 | 7,389 | 9,477 | -1,261 | -447 | 4,751 | -4,130 | -7,782 | -5,268 |
| Free Cash Flow | 1,137 | 3,941 | -5,173 | -3,769 | 1,379 | 3,118 | -5,212 | 2,362 | 8,539 | 7,068 |
| (Profitability ) | ||||||||||
| ROA (%) | 2.95 | 5.36 | 5.87 | 2.71 | 1.66 | 0.85 | 2.44 | 4.04 | 3.65 | 0.41 |
| ROE (%) | 11.98 | 19.27 | 18.31 | 7.76 | 4.74 | 2.51 | 7.37 | 11.98 | 9.94 | 1.04 |
| Net Margin (%) | 2.36 | 4.52 | 5.00 | 2.48 | 1.68 | 0.98 | 2.51 | 3.68 | 3.43 | 0.41 |
| Asset Turn | 1.25 | 1.18 | 1.18 | 1.09 | 0.99 | 0.87 | 0.97 | 1.10 | 1.06 | 0.99 |
| Assets/Equity | 4.07 | 3.60 | 3.12 | 2.86 | 2.86 | 2.95 | 3.03 | 2.97 | 2.72 | 2.56 |
| (Per-share) Unit: JPY | ||||||||||
| EPS | 87.5 | 157.9 | 176.4 | 90.2 | 58.3 | 30.5 | 96.7 | 187.5 | 167.4 | 17.9 |
| BPS | 750.1 | 888.8 | 1,069.6 | 1,250.0 | 1,216.1 | 1,213.7 | 1,409.8 | 1,722.1 | 1,687.4 | 1,774.6 |
| Dividend per Share | 26.00 | 34.00 | 45.00 | 27.00 | 24.00 | 9.00 | 28.00 | 47.00 | 51.00 | 53.00 |
| Shares Outstanding (million shares) | 23.94 | 23.94 | 27.44 | 27.44 | 27.44 | 27.44 | 27.44 | 27.44 | 32.88 | 33.10 |
Source: Omega Investment from company materials