2026-03-30
Home
Japanese

Omega Investment Co., Ltd.
Hamee (Company note – Q2 update)

| Share price (1/8) | ¥489 | Dividend Yield (26/4 CE) | 4.6 % |
| 52weeks high/low | ¥690/411 | ROE(25/4) | 12.4 % |
| Avg Vol (3 month) | 163 thou shrs | Operating margin (25/4) | 10.3 % |
| Market Cap | ¥7.9 bn | Beta (5Y Monthly) | 0.9 |
| Enterprise Value | ¥7.6 bn | Shares Outstanding | 16.3 mn shrs |
| PER (26/4 CE) | 51.4 X | Listed market | TSE Standard |
| PBR (25/4 act) | 0.7 X |
| Click here for the PDF version of this page |
| PDF version |
A downward revision to the full-year forecast in light of changes in the commerce business environment. Expectations are placed on the explosive potential of the new supplement product “ByGLOW” and on the medium-term plan scheduled to be presented at the FY04/2026 earnings announcement.
◇ Q2 FY04/2026 (first half) results highlights:
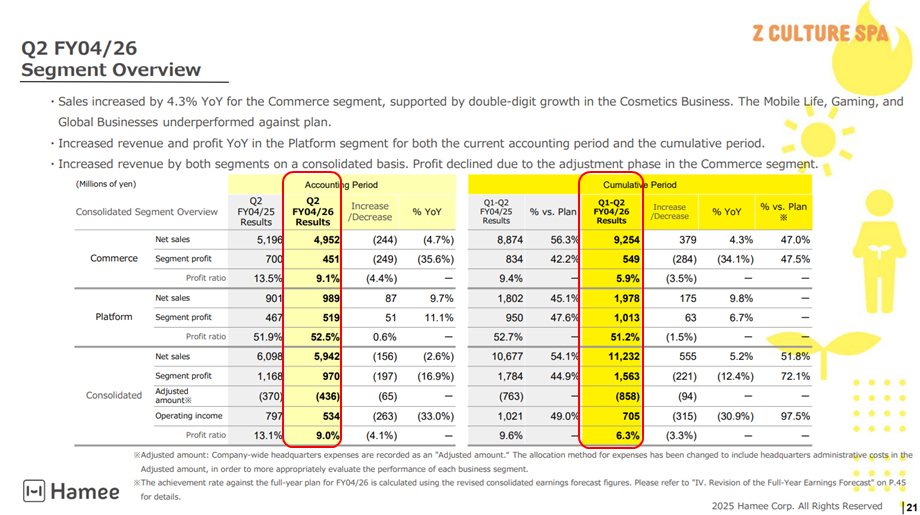
The Q2 FY04/2026 (first half) results announced by Hamee (hereinafter, the Company) on December 15, 2025 were net sales of JPY11.23 billion (up 5% YoY), operating profit of JPY700 million (down 30% YoY), ordinary profit of JPY540 million (down 47% YoY), and quarterly net income attributable to owners of the parent of JPY290 million (down 54% YoY). Sales were higher, but earnings were lower; both net sales and profits fell short of the Company’s forecast.
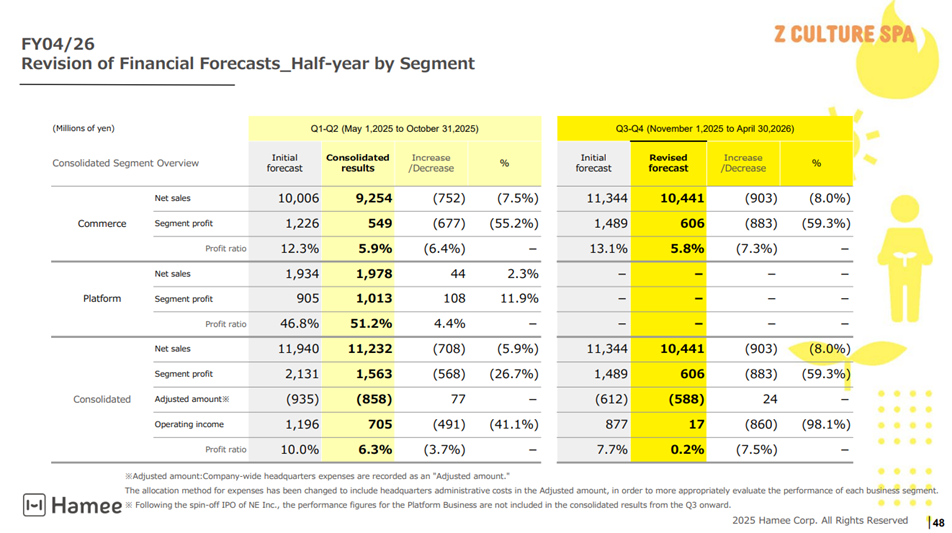
The primary cause of the soft results is the Commerce Segment. Although the Platform Segment recorded higher sales and higher earnings and exceeded the Company forecast, the Commerce Segment recorded higher sales and lower earnings, and both net sales and segment profit fell short of the Company forecast.
NE Inc., which is responsible for the Platform Segment, completed a spin-off listing on the TSE Growth Market on November 4, 2025, with an effective date of November 1, 2025, and became independent of the Company. As the Company will be responsible for the Commerce Segment going forward, the analysis below focuses on it.
Details
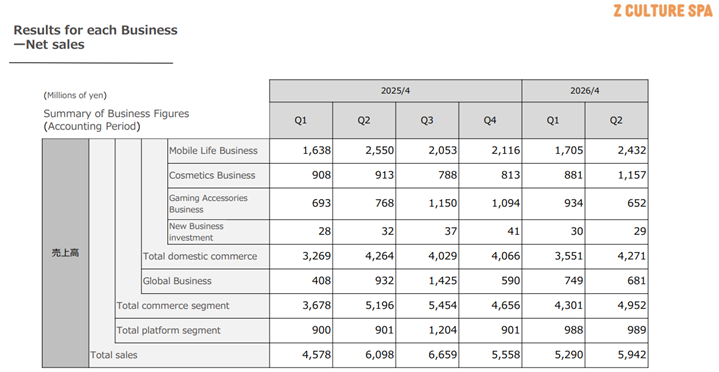
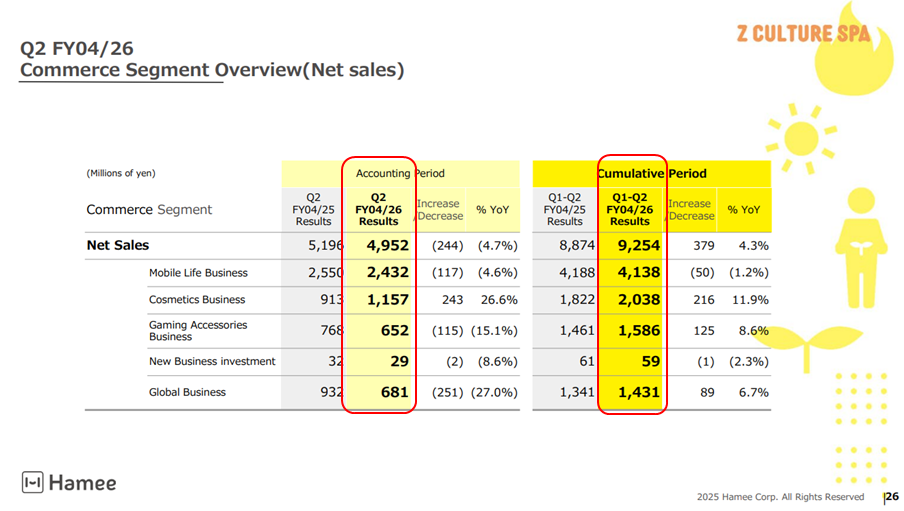
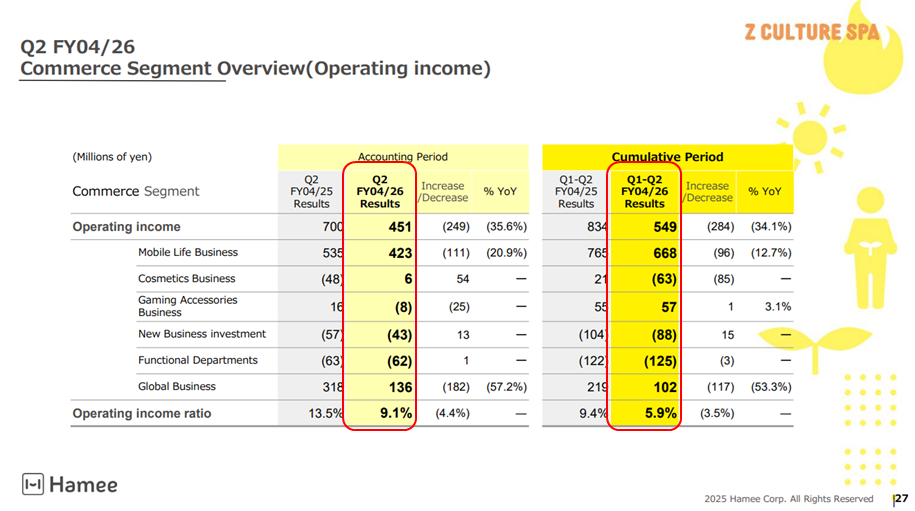
Although the cumulative results showed higher sales and lower earnings, by quarter, the first quarter had higher sales and lower earnings, and the second quarter had lower sales and lower earnings. Due to changes in the demand environment, results were on the severe side; however, overall sales were higher, and signs of improvement are appearing in the profit and loss statement of the Cosmetics Business, which had been a concern. The second-quarter points are listed below.
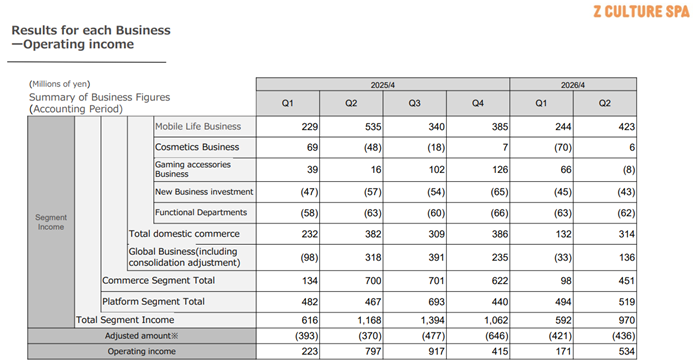
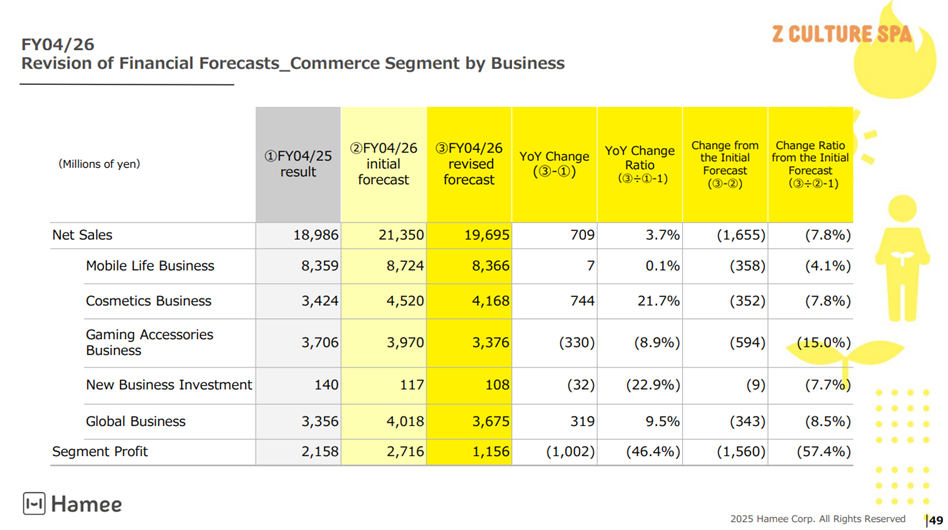
・Mobile Life Business: Net sales of JPY2.43 billion; segment profit of JPY420 million (lower sales and lower earnings). Sales of products related to the new iPhone 17 series fell short of initial expectations, and retailers’ in-store handling of the latest iPhone softened. In addition, marketing expenses increased, accompanying EC strengthening.
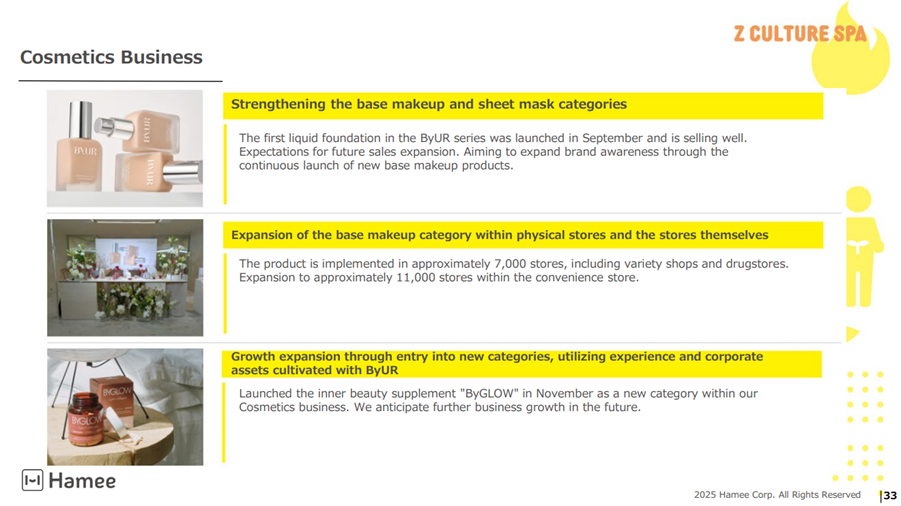
・Cosmetics Business: Net sales of JPY1.15 billion; segment profit of JPY6 million (higher sales and return to profitability). Following the Q1 wholesale reorganization, wholesale expansion to drugstores and similar channels progressed for new autumn products and base makeup products. The business returned to profitability while absorbing promotional expenses, including fixtures and samples, as well as logistics and shipping-related costs.
・Gaming Accessories Business: Net sales of JPY650 million; segment loss of JPY8 million (lower sales and turned to a loss). Due to oversupply in the monitor market, low-priced products continued to be launched, leading to price competition.
・Global Business: Net sales of JPY680 million; segment profit of JPY130 million (lower sales and lower earnings). The impact of U.S. tariff policy was prolonged, and aggressive sales measures could not be implemented.
Merchandise inventories increased 23% YoY, which warrants attention.
Source: Company material
Source: Company material
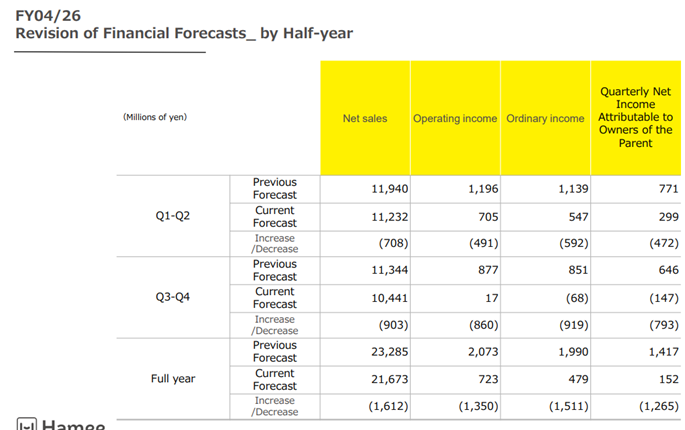
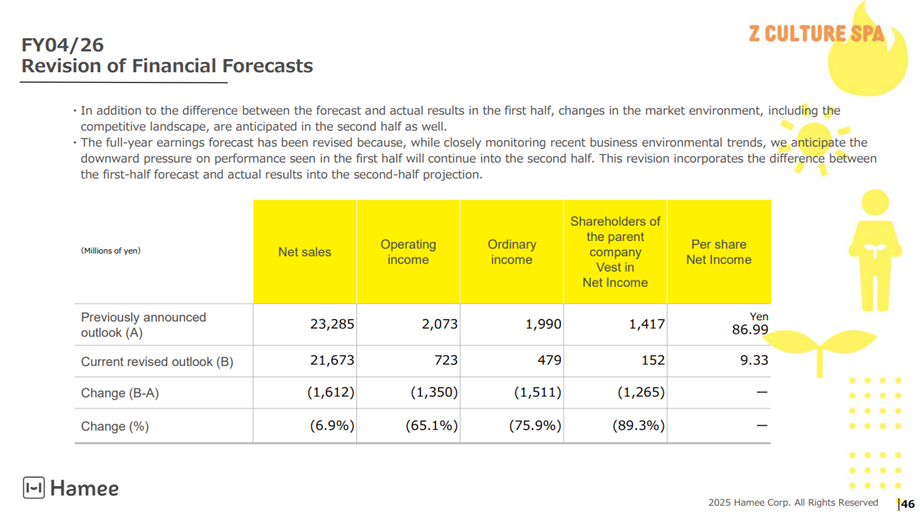
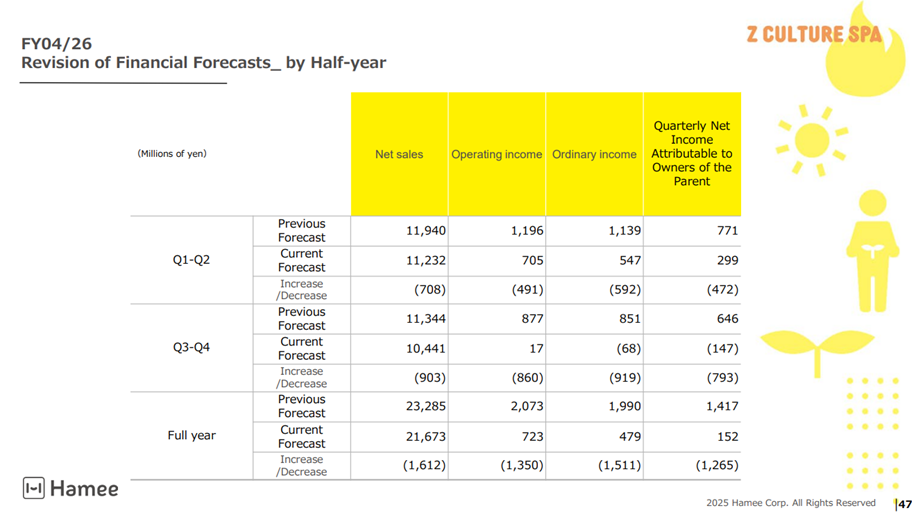
◇ Full-year outlook: cautious review of the second half and downward revision
The Company revised down its full-year earnings forecast. It incorporates the shortfall in the first-half results and a cautious outlook for the second half.
Source: Company material
Comparing the forecast for the second half with the Commerce Segment in the same period of the previous year, net sales are up 3%, and segment profit is down 54%.
On the premise that the business environment in the first half will continue to a certain extent into the second half, the Company assumes the Following as the bottom line of earnings. Although the impact of the decline outlook (down 20%) in the Gaming Accessories Business is significant, it can be said that there is a certain rationality in the assumptions that the Cosmetics Business will continue to increase sales (up 33%), and that the Mobile Life Business (slight increase) and the Global Business (up 11%) will also provide support.
On the profit side, although expenses for responding to the business environment and upfront investments for expansion in fast-growing areas such as the Cosmetics Business will increase, given the Company’s rigorous cost management framework, profitability is expected to remain resilient.
The Company stated that it has received a strong initial response to “ByGLOW,” an inner-beauty supplement that will be a new category for the Cosmetics Business.
Finally, the annual dividend per share was maintained at JPY22.50.
◇ Share price trends and points of focus going forward
The share price trended soft in line with the timing of NE Inc.’s spin-off listing and, further, fell to JPY439 following the announcement of these results; however, it has stopped its decline without falling below the year-to-date low (JPY411).
For the next 6 months following NE Inc.’s spin-off, the Company will focus on business restructuring. As conditions for the share price to shift from a bottom to an upward trend, the following points are worth noting.
1. Whether results for FY04/2026 will progress without falling below the current Company forecast, in particular, whether the trend of higher sales can be maintained.
2. Whether “ByGLOW,” an inner beauty supplement that will be a new category of the Cosmetics Business, will become a new driver of business performance.
3. Whether the direction of the medium-term management plan scheduled for presentation at the FY04/2026 earnings announcement will meet growth expectations.
Company profile
◇ Hamee Corp. (hereinafter, the Company) was founded in 1997, listed its shares on the TSE Mothers in 2015, and is currently listed on the Standard Market. It has operated two de-merged segments: the “Commerce Segment,” which develops businesses such as the Mobile Life Business, the Gaming Accessories Business, the Cosmetics Business, and the Global Business; and the “Platform Segment,” whose primary business is to provide EC Attractions “NextEngine,” a cloud (SaaS)-based service for internet mail-order operators that automates tasks related to operating online shops and centrally manages order processing for multiple stores and inventory status across malls.
On November 4, 2025, with November 1, 2025 as the effective date, NE Inc. completed a spin-off listing on the TSE Growth Market and became independent of the Company. Since then, the Company has specialized in the Commerce Segment and entered a “third founding phase,” leveraging SPA functions to deploy product groups that shape Gen Z culture in multiple directions while strengthening efforts toward decarbonization. At the FY04/2026 earnings announcement, medium- to long-term plans will be presented.
Key financial data
| Unit: million yen | 2021/4 | 2022/4 | 2023/4 | 2024/4 | 2025/4 | 2026/4 CE |
| Sales | 12,363 | 13,413 | 14,038 | 17,612 | 22,895 | 21,673 |
| EBIT (Operating Income) | 2,180 | 2,202 | 1,251 | 1,964 | 2,346 | |
| Pretax Income | 2,144 | 2,463 | 1,396 | 2,009 | 1,991 | |
| Net Profit Attributable to Owner of Parent | 1,556 | 1,744 | 945 | 1,122 | 1,278 | 152 |
| Cash & Short-Term Investments | 3,355 | 4,026 | 3,536 | 4,022 | 4,994 | |
| Total assets | 8,342 | 10,524 | 12,392 | 14,885 | 16,973 | |
| Total Debt | 104 | 544 | 1,300 | 2,327 | 3,850 | |
| Net Debt | -3,251 | -3,482 | -2,236 | -1,694 | -1,144 | |
| Total liabilities | 1,814 | 2,271 | 3,431 | 4,728 | 6,402 | |
| Total Shareholders’ Equity | 6,528 | 8,253 | 8,961 | 10,157 | 10,570 | |
| Net Operating Cash Flow | 1,941 | 1,186 | 695 | 886 | 827 | |
| Capital Expenditure | 351 | 1,018 | 487 | 477 | 783 | |
| Net Investing Cash Flow | -412 | -886 | -1,507 | -877 | -922 | |
| Net Financing Cash Flow | -1,736 | 298 | 263 | 380 | 1,171 | |
| Free Cash Flow | 1,760 | 362 | 405 | 577 | 225 | |
| ROA (%) | 18.94 | 18.49 | 8.25 | 8.22 | 8.02 | |
| ROE (%) | 27.42 | 23.60 | 10.98 | 11.73 | 12.33 | |
| EPS (Yen) | 98.4 | 109.7 | 59.4 | 70.4 | 80.2 | 9.3 |
| BPS (Yen) | 411.1 | 519.1 | 563.0 | 637.6 | 662.6 | |
| Dividend per Share (Yen) | 10.00 | 22.50 | 22.50 | 22.50 | 22.50 | 22.50 |
| Shares Outstanding (Million Shares) | 16.21 | 16.27 | 16.27 | 16.28 | 16.29 |
Source: Omega Investment from company data, rounded to the nearest whole number.
Share price

Overview of Q2 FY04/2026
Overview of company-wide performance
Source: Company material
Source: Company material
Source: Company material
Source: Company material
FY04/2026 earnings forecast
Source: Company material
Source: Company material
Source: Company material
Source: Company material
Financial data (quarterly basis)
| Unit: million yen | 2024/4 | 2025/4 | 2026/4 | ||||||
| Q2 | Q3 | Q4 | Q1 | Q2 | Q3 | Q4 | Q1 | Q2 | |
| (Income Statement) | |||||||||
| Sales | 4,315 | 5,151 | 4,829 | 4,579 | 6,099 | 6,659 | 5,559 | 5,290 | 5,942 |
| Year-on-year | 22.3% | 31.8% | 38.1% | 38.1% | 41.3% | 29.3% | 15.1% | 15.5% | -2.6% |
| Cost of Goods Sold (COGS) | 1,631 | 1,858 | 1,977 | 1,841 | 2,628 | 2,668 | 2,261 | 2,275 | 2,315 |
| Gross Income | 2,684 | 3,293 | 2,852 | 2,738 | 3,471 | 3,991 | 3,297 | 3,016 | 3,627 |
| Gross Income Margin | 62.2% | 63.9% | 59.1% | 59.8% | 56.9% | 59.9% | 59.3% | 57.0% | 61.0% |
| SG&A Expense | 2,224 | 2,565 | 2,306 | 2,505 | 2,691 | 3,074 | 2,882 | 2,845 | 3,092 |
| EBIT (Operating Income) | 470 | 756 | 551 | 233 | 780 | 917 | 416 | 171 | 534 |
| Year-on-year | 44.1% | 27.0% | 545.8% | 24.7% | 65.9% | 21.3% | -24.6% | -26.5% | -31.5% |
| Operating Income Margin | 10.9% | 14.7% | 11.4% | 5.1% | 12.8% | 13.8% | 7.5% | 3.2% | 9.0% |
| EBITDA | 670 | 953 | 749 | 435 | 941 | 1,163 | 623 | 376 | 765 |
| Pretax Income | 492 | 737 | 576 | 200 | 811 | 702 | 278 | 97 | 422 |
| Consolidated Net Income | 334 | 492 | 428 | 101 | 564 | 400 | 212 | 26 | 274 |
| Minority Interest | 0 | 0 | 0 | 0 | 0 | 0 | 0 | 0 | 0 |
| Net Income ATOP | 334 | 492 | 428 | 101 | 564 | 400 | 212 | 26 | 274 |
| Year-on-year | 16.1% | 53.6% | 228.4% | -176.6% | 68.8% | -18.6% | -50.5% | -74.6% | -51.4% |
| Net Income Margin | 7.8% | 9.5% | 8.9% | 2.2% | 9.3% | 6.0% | 3.8% | 0.5% | 4.6% |
| (Balance Sheet) | |||||||||
| Cash & Short-Term Investments | 2,983 | 3,430 | 4,022 | 3,642 | 3,912 | 4,204 | 4,994 | 4,172 | 5,317 |
| Total assets | 13,197 | 14,210 | 14,885 | 15,295 | 16,838 | 18,197 | 17,303 | 16,416 | 19,556 |
| Total Debt | 1,650 | 1,928 | 2,327 | 3,232 | 3,980 | 3,927 | 4,076 | 3,850 | 5,150 |
| Net Debt | -1,333 | -1,502 | -1,694 | -410 | 68 | -277 | -918 | -322 | -167 |
| Total liabilities | 4,040 | 4,566 | 4,728 | 5,242 | 6,490 | 7,553 | 6,733 | 5,980 | 8,449 |
| Total Shareholders’ Equity | 9,156 | 9,644 | 10,157 | 10,053 | 10,348 | 10,644 | 10,570 | 10,437 | 11,107 |
| (Profitability %) | |||||||||
| ROA | 5.29 | 6.20 | 8.22 | 9.81 | 10.56 | 9.22 | 7.94 | 7.58 | 5.01 |
| ROE | 7.41 | 8.88 | 11.73 | 14.43 | 16.26 | 14.73 | 12.33 | 11.74 | 8.50 |
| (Per-share) Unit: yen | |||||||||
| EPS | 21.0 | 30.9 | 26.9 | 6.4 | 35.4 | 25.1 | 13.3 | 1.6 | 17.1 |
| BPS | 575.0 | 605.6 | 637.6 | 630.7 | 648.8 | 667.4 | 662.6 | 653.1 | 694.2 |
| Dividend per Share | 0.00 | 0.00 | 22.50 | 0.00 | 0.00 | 0.00 | 22.50 | 0.00 | 0.00 |
| Shares Outstanding (Million Shares) | 16.28 | 16.28 | 16.28 | 16.29 | 16.29 | 16.29 | 16.30 | 16.30 | 16.33 |
Source: Omega Investment from company materials
Financial data (full-year basis)
| Unit: million yen | 2017/4 | 2018/4 | 2019/4 | 2020/4 | 2021/4 | 2022/4 | 2023/4 | 2024/4 | 2025/4 |
| (Income Statement) | |||||||||
| Sales | 8,503 | 9,379 | 10,300 | 11,325 | 12,363 | 13,413 | 14,038 | 17,612 | 22,895 |
| Year-on-year | 30.8% | 10.3% | 9.8% | 10.0% | 9.2% | 8.5% | 4.7% | 25.5% | 30.0% |
| Cost of Goods Sold | 4,485 | 4,618 | 5,056 | 4,894 | 4,802 | 4,892 | 5,563 | 6,745 | 9,398 |
| Gross Income | 4,018 | 4,761 | 5,244 | 6,431 | 7,562 | 8,522 | 8,476 | 10,867 | 13,497 |
| Gross Income Margin | 47.3% | 50.8% | 50.9% | 56.8% | 61.2% | 63.5% | 60.4% | 61.7% | 59.0% |
| SG&A Expense | 2,916 | 3,381 | 4,080 | 4,686 | 5,382 | 6,319 | 7,225 | 8,959 | 11,151 |
| EBIT (Operating Income) | 1,102 | 1,380 | 1,164 | 1,745 | 2,180 | 2,202 | 1,251 | 1,964 | 2,354 |
| Year-on-year | 146.8% | 25.2% | -15.7% | 50.0% | 24.9% | 1.0% | -43.2% | 57.0% | 19.5% |
| Operating Income Margin | 13.0% | 14.7% | 11.3% | 15.4% | 17.6% | 16.4% | 8.9% | 11.1% | 10.2% |
| EBITDA | 1,272 | 1,627 | 1,525 | 2,227 | 2,694 | 2,840 | 2,042 | 2,749 | 3,162 |
| Pretax Income | 1,010 | 1,259 | 1,179 | 1,582 | 2,144 | 2,463 | 1,396 | 2,009 | 1,991 |
| Consolidated Net Income | 696 | 873 | 821 | 1,069 | 1,556 | 1,744 | 945 | 1,122 | 1,278 |
| Net Income ATOP | 696 | 873 | 821 | 1,069 | 1,556 | 1,744 | 945 | 1,122 | 1,278 |
| Year-on-year | 169.7% | 25.4% | -5.9% | 30.2% | 45.5% | 12.0% | -45.8% | 18.6% | 13.9% |
| Net Income Margin | 8.2% | 9.3% | 8.0% | 9.4% | 12.6% | 13.0% | 6.7% | 6.4% | 5.6% |
| (Balance Sheet) | |||||||||
| Cash & Short-Term Investments | 1,324 | 1,695 | 1,660 | 3,453 | 3,355 | 4,026 | 3,536 | 4,022 | 4,994 |
| Total assets | 4,240 | 5,042 | 5,761 | 8,097 | 8,342 | 10,524 | 12,392 | 14,885 | 16,973 |
| Total Debt | 468 | 298 | 500 | 1,740 | 104 | 544 | 1,300 | 2,327 | 3,850 |
| Net Debt | -856 | -1,397 | -1,160 | -1,713 | -3,251 | -3,482 | -2,236 | -1,694 | -1,144 |
| Total liabilities | 1,484 | 1,445 | 1,572 | 3,272 | 1,814 | 2,271 | 3,431 | 4,728 | 6,402 |
| Total Shareholders’ Equity | 2,756 | 3,597 | 4,189 | 4,824 | 6,528 | 8,253 | 8,961 | 10,157 | 10,570 |
| (Cash Flow) | |||||||||
| Net Operating Cash Flow | 576 | 1,246 | 651 | 1,934 | 1,941 | 1,186 | 695 | 886 | 827 |
| Capital Expenditure | 228 | 437 | 291 | 649 | 351 | 1,018 | 487 | 477 | 783 |
| Net Investing Cash Flow | -433 | -674 | -671 | -1,020 | -412 | -886 | -1,507 | -877 | -922 |
| Net Financing Cash Flow | 69 | -230 | -7 | 933 | -1,736 | 298 | 263 | 380 | 1,171 |
| Free Cash Flow | 464 | 960 | 526 | 1,440 | 1,760 | 362 | 405 | 577 | 225 |
| (Profitability %) | |||||||||
| ROA | 19.18 | 18.81 | 15.21 | 15.43 | 18.94 | 18.49 | 8.25 | 8.22 | 8.02 |
| ROE | 29.30 | 27.48 | 21.10 | 23.73 | 27.42 | 23.60 | 10.98 | 11.73 | 12.33 |
| Net Profit Margin | 8.18 | 9.31 | 7.97 | 9.44 | 12.59 | 13.00 | 6.73 | 6.37 | 5.58 |
| Asset Turnover | 2.34 | 2.02 | 1.91 | 1.63 | 1.50 | 1.42 | 1.23 | 1.29 | 1.44 |
| Financial Leverage | 1.53 | 1.46 | 1.39 | 1.54 | 1.45 | 1.28 | 1.33 | 1.43 | 1.54 |
| (Per-share) Unit: yen | |||||||||
| EPS | 44.2 | 54.7 | 51.2 | 67.4 | 98.4 | 109.7 | 59.4 | 70.4 | 80.2 |
| BPS | 174.0 | 224.1 | 263.0 | 305.5 | 411.1 | 519.1 | 563.0 | 637.6 | 662.6 |
| Dividend per Share | 4.50 | 5.50 | 6.50 | 7.00 | 10.00 | 22.50 | 22.50 | 22.50 | 22.50 |
| Shares Outstanding (Million Shares) | 15.74 | 15.94 | 16.08 | 16.10 | 16.21 | 16.27 | 16.27 | 16.28 | 16.29 |
Source: Omega Investment from company materials