2026-07-27
Home
Japanese

Omega Investment Co., Ltd.
Sansei Landic (Company note – 1Q update)
| Share price (6/12) | ¥1,044 | Dividend Yield (24/12 CE) | 3.83 % |
| 52weeks high/low | ¥1,172/850 | ROE(23/12 act) | 10.2 % |
| Avg Vol (3 month) | 30.5 thou shrs | Operating margin (23/12 act) | 9.3 % |
| Market Cap | ¥8.96 bn | Beta (5Y Monthly) | 0.66 |
| Enterprise Value | ¥20.54 bn | Shares Outstanding | 8.241 mn shrs |
| PER (24/12 CE) | 8.9 X | Listed market | TSE Standard |
| PBR (23/12 act) | 0.7 X |
| Click here for the PDF version of this page |
| PDF Version |
FY12/2024 1Q sales increased while profits decreased, but the result exceeded the company’s forecasts. A new medium-term plan is awaited.
◇Summary of FY12/2024 1Q results: sales up and profits down in line with expectations
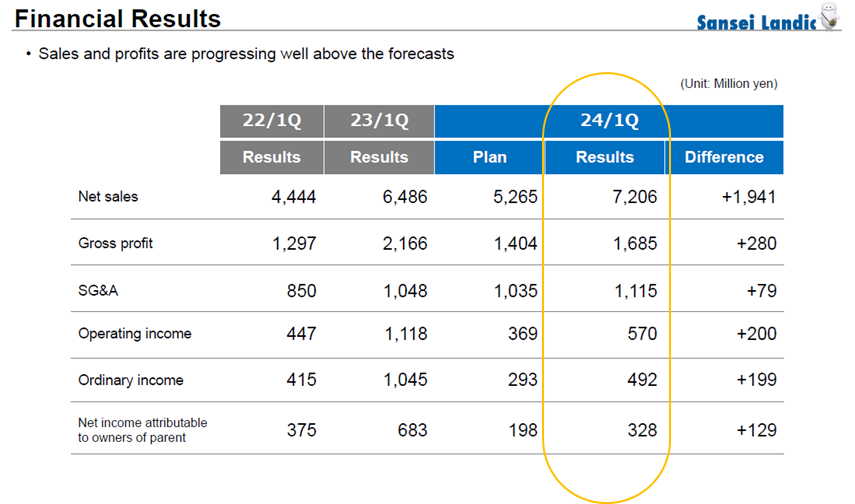
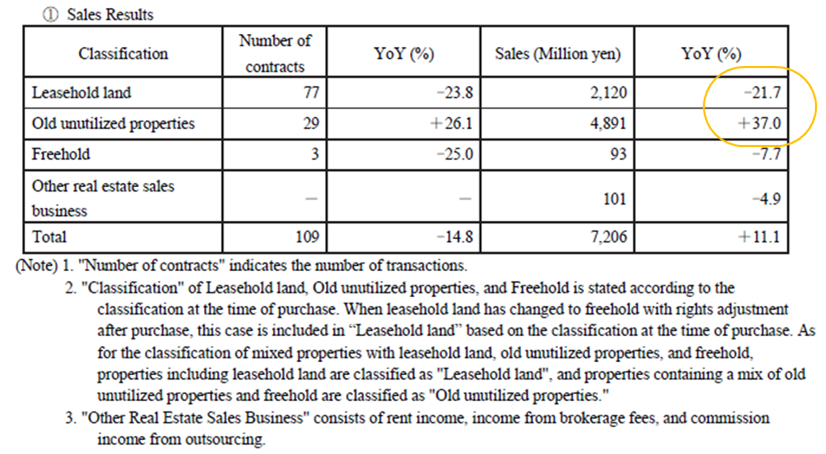
Sansei Landic announced its FY12/2024 1Q results on 13 May 2024, with increased sales and decreased profit YoY. Sales were 7.20 billion yen (+11% YoY), operating income was 570 million yen (-49% YoY), ordinary income was 490 million yen (-52% YoY), and net income attributable to owner of parent was 320 million yen (-52% YoY), representing a significant decline in profit. Profit margins were depressed by an increase in the sales mix of Old unutilized properties (which have relatively low profit margins) compared to Leasehold land. However, this performance was better than planned.
The company’s forecasts for the first half and full year and the dividend forecast for the current year have not been revised. These do not surprise. The company’s sales, operating income, and ordinary income exceeded those of the same period two years ago, which endorses that the company’s business is performing steadily.
◇FY12/2024 company forecast: no change
As mentioned earlier, the company’s 2Q and full-year forecasts for FY12/2024 have not been revised. As 1Q progress vis-a-vis the full-year plan is not remarkably high, we want to see whether sales and purchases will remain steady by quarter.
The company will start paying an interim dividend from this financial year. This decision is thought to be based on the fact that the company can now generate quarterly profits with a small margin of fluctuation。This is, therefore, positively evaluated. It will be interesting to see whether this will trigger an increase in new long-term shareholders.
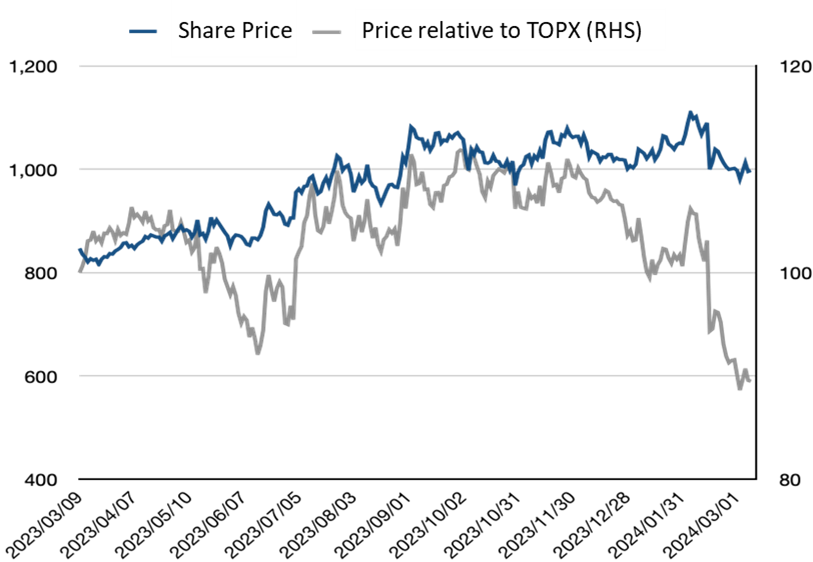
◇Share price trend: announcement of new medium-term plan awaited
The company’s share price has fluctuated between 950 yen and 1,100 yen since autumn last year. Although PER and PBR are not overdone, investors will likely wait for catalysts to turn the share price higher, especially as this year’s results will stagnate against the rapid earnings growth in FY12/2023.
Therefore, in addition to the quarterly progress of purchases and sales, the announcement of the next medium-term plan is awaited. If the company’s distinctive growth strategy is presented, the stock market will become more aware of its stable and difficult-to-imitate growth capacity, and PBR above 1x could come into sight.
| JPY, mn | Net sales | YoY % |
Oper. profit |
YoY % |
Ord. profit |
YoY % |
Profit ATOP |
YoY % |
EPS (¥) |
DPS (¥) |
| 2019/12 | 18,020 | 7.1 | 1,860 | 5.4 | 1,758 | 7.0 | 1,158 | 15.1 | 137.08 | 23.00 |
| 2020/12 | 17,774 | -1.4 | 847 | -54.5 | 709 | -59.7 | 357 | -69.1 | 42.34 | 25.00 |
| 2021/12 | 16,836 | -5.3 | 1,117 | 31.9 | 999 | 40.9 | 609 | 70.5 | 73.56 | 26.00 |
| 2022/12 | 15,513 | -7.7 | 1,469 | 31.5 | 1,283 | 28.4 | 1,060 | 73.9 | 129.61 | 28.00 |
| 2023/12 | 23,269 | 49.8 | 2,155 | 46.7 | 1,765 | 37.5 | 1,182 | 11.6 | 143.79 | 33.00 |
| 2024/12 (CE) | 23,700 | 1.9 | 1,800 | -16.5 | 1,500 | -15.0 | 1,000 | -15.5 | 121.35 | 40.00 |
| 2023/12 1Q | 6,486 | 45.9 | 1,118 | 150.0 | 1,045 | 151.6 | 683 | 82.2 | 83.48 | 0.00 |
| 2024/12 1Q | 7,206 | 11.1 | 570 | -49.0 | 492 | -52.9 | 328 | -52.0 | 39.82 | 0.00 |
◇FY12/2024 1Q results summary: Sales increased while profits declined YoY, but the results were in line with expectations
Sansei Landic announced its FY12/2024 1Q results on 13 May 2024, with an increase in sales and a decrease in profit with sales of 7.20 billion yen (+11% YoY), operating income of 570 million yen (-49% YoY), ordinary income of 490 million yen (-52% YoY) and net income attributable to owner of parent of 320 million yen (-52% YoY). The profit decline was notable. On YoY, the profit margins were depressed due to an increase in the sales mix of Old unutilized properties (with relatively low profit margins) compared to Leasehold land. However, as shown in the table below, this performance exceeded the company plan.
There are no revisions to the company’s forecasts for the first half and full year and the dividend forecast for the current year. These do not surprise. The company’s sales, operating income, and ordinary income exceeded those of the same period two years ago, which endorses that the company’s business is performing steadily.
【Profit trends】
Source: Omega Investment from company materials
【Sales trends】
Source: Omega Investment from company materials
【Sales trends and gross margins】
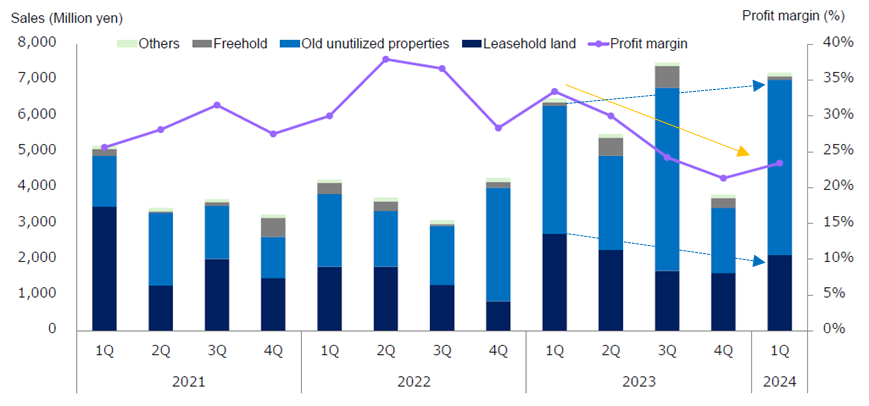
Source: Omega Investment from company materials
Purchases fell by 33% YoY to 3.35 billion yen. While Old unutilized properties grew substantially, purchases of Leasehold land were weak, partly in the absence of the purchases of large properties in the previous year. However, the company mentioned that purchases of Leasehold land are progressing in line with expectation. In addition, the total purchase value increased over the same period two years ago.
【Purchasing trends】
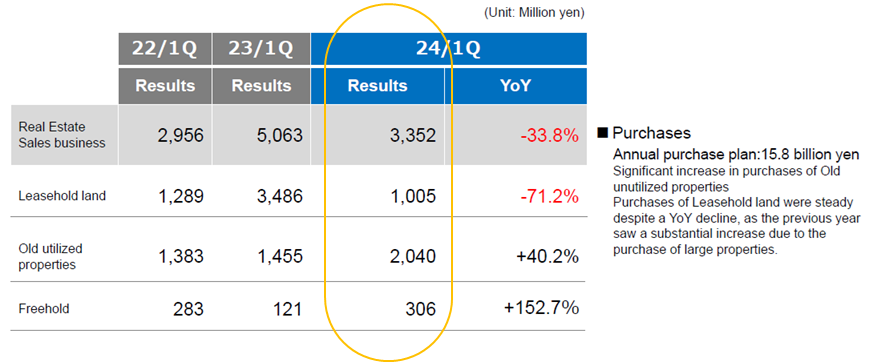
Source: Omega Investment from company materials
As discussed above, sales fell YoY in the quarter under review, and purchase volumes also declined YoY. However, as is shown next, inventories have remained high since 4Q 2022, and the business is performing well.
【Changes in purchases and inventories】
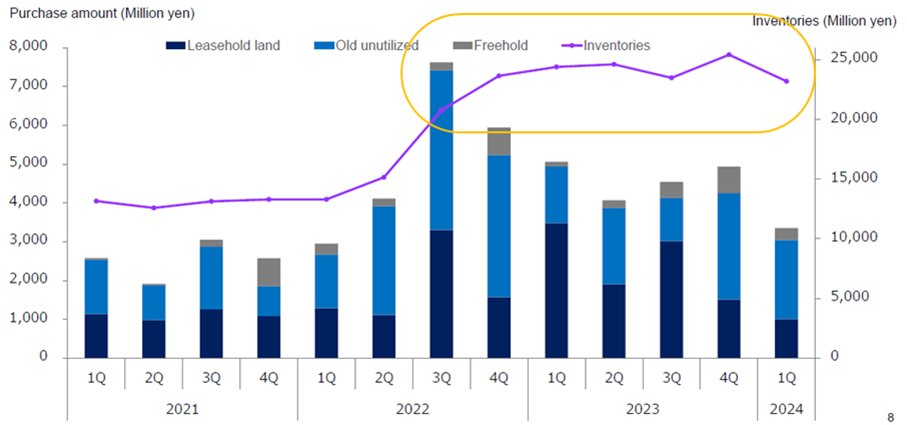
Source: Omega Investment from company materials
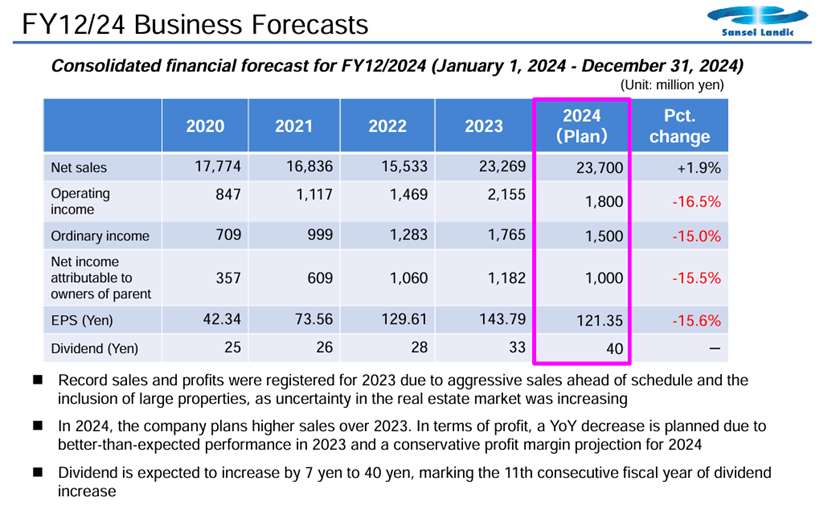
◇Forecasts for FY12/2024: no change. Commencement of interim dividend.
As mentioned earlier, the company’s 2Q and full-year forecasts for FY12/2024 have not been revised. As 1Q progress against the full-year plan is not remarkably high, we are interested to see whether sales and purchases will remain steady from quarter to quarter going forward.
In addition, the company will start paying an interim dividend from this financial year. This should be understood as confidence that the company has laid the foundations to generate profit each quarter. It will be interesting to see whether this will increase the number of new shareholders who are willing to hold the shares for the long term.
【Financial forecasts】
Source: Omega Investment from company materials
【Dividend per share】
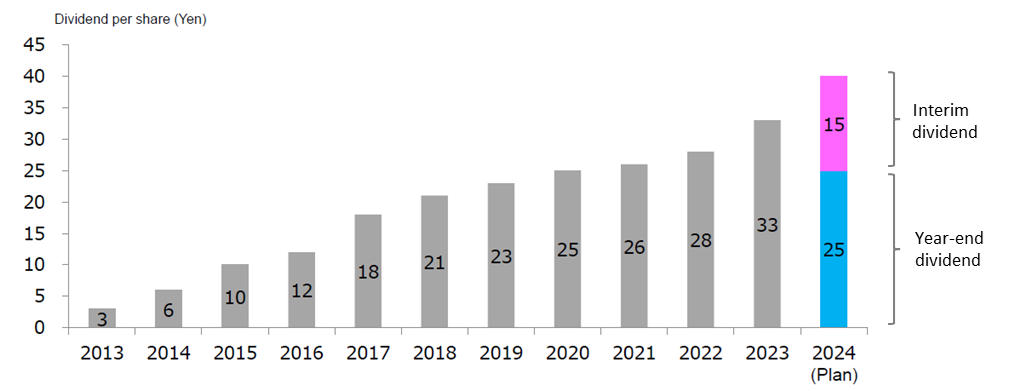
Source: Omega Investment from company materials
◇ Share price trend: announcement of new medium-term plan awaited
Since autumn 2023, the company’s share price has fluctuated between 950 yen and 1,100 yen. PER and PBR are not overdone, and the start of the interim dividend suggests that the business base has been strengthened. Therefore, as long as the earnings remain steady, the share price is unlikely to fall significantly below the above range.
However, the company forecasts net income to decline (partly due to the absence of the particularly solid earnings of the previous year), so there is a lack of positive share price catalysts.
For the share price to move upwards again, on top of steady quarterly results for the current financial year in terms of both purchases and profit and loss, the forthcoming new medium-term plan must present a growth strategy that fully demonstrates the company’s strengths. With domestic interest rates likely to rise, the property market could face headwinds. As per the company, investors’ attention will likely dium-term plan to see whether it will use its business platform and wealth of knowledge to strengthen its position in the industry firmly.
According to the company, a new medium-term plan may be announced sooner rather than waiting until the end of FY12/2024. We would await it with great interest.
Financial data (quarterly)
2022/12 |
2023/12 |
2024/12 |
||||||||||
1Q |
2Q |
3Q |
4Q |
1Q |
2Q |
3Q |
4Q |
1Q |
2Q |
3Q |
4Q |
|
[Sales by segment] |
||||||||||||
Net sales |
4,444 |
3,721 |
3,094 |
4,272 |
6,486 |
5,494 |
7,484 |
3,805 |
7,206 |
|||
Year-on-year basis |
-17.2% |
-0.6% |
-24.3% |
17.4% |
45.9% |
47.6% |
141.9% |
-10.9% |
11.1% |
|||
Real estate sales business |
4,222 |
3,721 |
3,094 |
4,272 |
6,486 |
5,493 |
7,484 |
3,806 |
7,206 |
|||
Year-on-year basis |
-18.3% |
8.3% |
-15.9% |
31.7% |
53.6% |
47.6% |
141.8% |
-10.9% |
11.1% |
|||
Sales composition ratio |
95.0% |
100.0% |
100.0% |
100.0% |
100.0% |
100.0% |
100.0% |
100.0% |
100.0% |
|||
Leasehold land |
1,793 |
1,794 |
1,284 |
832 |
2,707 |
2,259 |
1,674 |
1,613 |
2,120 |
|||
Year-on-year basis |
-48.2% |
41.6% |
-35.9% |
-43.6% |
51.0% |
25.9% |
30.4% |
93.9% |
-21.7% |
|||
Sales composition ratio |
40.3% |
48.2% |
41.5% |
19.5% |
41.7% |
41.1% |
22.4% |
42.4% |
29.4% |
|||
Old unutilized properties |
2,024 |
1,556 |
1,649 |
3,170 |
3,571 |
2,633 |
5,113 |
1,821 |
4,891 |
|||
Year-on-year basis |
42.6% |
-23.2% |
10.8% |
175.4% |
76.4% |
69.2% |
210.1% |
-42.6% |
37.0% |
|||
Sales composition ratio |
45.5% |
41.8% |
53.3% |
74.2% |
55.1% |
47.9% |
68.3% |
47.9% |
67.8% |
|||
Freehold |
315 |
266 |
49 |
157 |
101 |
504 |
603 |
279 |
93 |
|||
Year-on-year basis |
64.9% |
478.3% |
-51.5% |
-70.2% |
-67.9% |
89.5% |
1140.8% |
77.7% |
-7.7% |
|||
Sales composition ratio |
7.1% |
7.1% |
1.6% |
3.7% |
1.6% |
9.2% |
8.1% |
7.3% |
1.2% |
|||
Others |
89 |
105 |
112 |
114 |
105 |
97 |
90 |
96 |
101 |
|||
Year-on-year basis |
-7.3% |
10.5% |
27.3% |
21.3% |
19.1% |
-8.6% |
-19.6% |
-15.8% |
-4.9% |
|||
Sales composition ratio |
2.0% |
2.8% |
3.6% |
2.7% |
1.6% |
1.7% |
1.2% |
2.5% |
1.4% |
|||
Construction business |
222 |
– |
– |
– |
– |
– |
– |
– |
– |
|||
Year-on-year basis |
14.0% |
– |
– |
– |
– |
– |
– |
– |
||||
Sales composition ratio |
5.0% |
– |
– |
– |
– |
– |
– |
– |
||||
[Statements of income] |
||||||||||||
Net sales |
4,444 |
3,721 |
3,096 |
4,272 |
6,486 |
5,494 |
7,484 |
3,805 |
7,206 |
|||
Cost of sales |
3,146 |
2,310 |
1,963 |
3,066 |
4,320 |
3,859 |
5,681 |
3,067 |
5,520 |
|||
Gross profit |
1,297 |
1,411 |
1,132 |
1,206 |
2,166 |
1,636 |
1,803 |
737 |
1,685 |
|||
SG&A expenses |
850 |
946 |
845 |
937 |
1,084 |
1,097 |
1,127 |
879 |
1,115 |
|||
Operating profit |
447 |
466 |
287 |
269 |
1,118 |
538 |
675 |
-176 |
570 |
|||
Non-operating profit |
7 |
7 |
6 |
7 |
8 |
6 |
20 |
-6 |
10 |
|||
Non-operating expenses |
39 |
55 |
54 |
64 |
80 |
165 |
88 |
86 |
88 |
|||
Ordinary income |
415 |
417 |
239 |
212 |
1,045 |
378 |
595 |
-253 |
492 |
|||
Extraordinary income |
19 |
0 |
0 |
1 |
0 |
0 |
0 |
0 |
0 |
|||
Extraordinary expenses |
8 |
7 |
0 |
0 |
8 |
1 |
0 |
|||||
Loss before income taxes |
435 |
399 |
231 |
205 |
1,045 |
378 |
586 |
-253 |
492 |
|||
Total income taxes |
59 |
60 |
36 |
54 |
361 |
122 |
199 |
-109 |
164 |
|||
Net income |
375 |
338 |
196 |
151 |
683 |
255 |
387 |
-142 |
328 |
|||
[Balance Sheets] |
||||||||||||
Current assets |
19.018 |
21,579 |
26,379 |
27,929 |
28,392 |
29,382 |
29,233 |
29,522 |
28,172 |
|||
Property for sale |
13,304 |
15,152 |
20,775 |
23,657 |
24,404 |
24,623 |
23,490 |
25,365 |
23,202 |
|||
Non-current assets |
1,124 |
1,099 |
1,129 |
1,047 |
1,233 |
1,394 |
1,399 |
1,455 |
2,314 |
|||
Tangible assets |
317 |
313 |
314 |
299 |
312 |
529 |
520 |
516 |
1,357 |
|||
Investments and other assets |
761 |
743 |
769 |
701 |
873 |
817 |
836 |
891 |
902 |
|||
Total assets |
20,134 |
22,678 |
27,508 |
28,976 |
29,626 |
30,777 |
30,632 |
30,976 |
30,487 |
|||
Current liabilities |
8,153 |
8,871 |
11,168 |
12,606 |
13,658 |
16,133 |
16,375 |
15,746 |
15,394 |
|||
Short-term borrowings |
7,170 |
5,058 |
7,603 |
11,366 |
11,968 |
13,975 |
14,470 |
13,973 |
14,121 |
|||
Non-current liabilities |
1,525 |
3,114 |
5,453 |
5,314 |
4,405 |
2,810 |
2,035 |
3,153 |
2,959 |
|||
Long-Term Borrowings |
1,260 |
2,828 |
5,153 |
5,033 |
4,093 |
2,545 |
1,791 |
2,905 |
2,665 |
|||
Total liabilities |
10 |
11,968 |
16,622 |
17,920 |
18,064 |
18,943 |
18,411 |
18,899 |
18,354 |
|||
Total net assets |
10,463 |
10,692 |
10,886 |
11,056 |
11,561 |
11,833 |
12,220 |
12,077 |
12,133 |
|||
Total shareholders’ equity |
10,459 |
10,688 |
10,882 |
11,052 |
11,562 |
11,833 |
12,220 |
12,077 |
12,133 |
|||
Capital stock |
821 |
822 |
824 |
833 |
860 |
860 |
860 |
861 |
860 |
|||
Legal capital reserve |
782 |
785 |
786 |
796 |
823 |
824 |
824 |
825 |
824 |
|||
Retained earnings |
9,023 |
9,362 |
9,557 |
9,708 |
10,164 |
10,419 |
10,807 |
10,664 |
10,719 |
|||
Stock acquisition right |
4 |
3 |
3 |
3 |
– |
– |
– |
– |
– |
|||
Total liabilities and net assets |
20,134 |
22,678 |
27,508 |
28,976 |
29,626 |
30,777 |
30,632 |
30,976 |
30,487 |
|||
[Statements of cash flows] |
||||||||||||
Cash flow from operating activities |
1,184 |
-9,267 |
911 |
-12 |
||||||||
Loss before income taxes |
833 |
1,269 |
1,423 |
1,756 |
||||||||
Cash flow from investing activities |
-205 |
-266 |
-655 |
-766 |
||||||||
Cash flow from financing activities |
-559 |
7,971 |
-56 |
303 |
||||||||
Net increase in cash and cash equiv. |
420 |
-1,563 |
200 |
0 |
||||||||
Cash and cash equiv. at beginning of period |
4,752 |
4,752 |
3,188 |
-475 |
||||||||
Cash and cash equiv. at end of period |
5,173 |
3,188 |
3,839 |
3,189 |
Financial data (Full year)
| 2013/12 | 2014/12 | 2015/12 | 2016/12 | 2017/12 | 2018/12 | 2019/12 | 2020/12 | 2021/12 | 2022/12 | 2023/12 | 2024/12 (forecast) |
|
| [Statements of income] | ||||||||||||
| Net sales | 9,187 | 10,443 | 11,567 | 12,300 | 13,098 | 16,833 | 18,020 | 17,774 | 16,836 | 15,533 | 23,269 | 23,700 |
| YoY change (%) | -3.0 | 13.7 | 10.8 | 6.3 | 6.5 | 28.5 | 7.1 | -1.4 | -5.3 | -7.7 | 49.8 | 1.9 |
| Cost of sales | 6,254 | 7,055 | 7,798 | 8,344 | 8,566 | 12,028 | 12,902 | 13,788 | 12,467 | 10,485 | 16,927 | |
| Gross profit | 2,934 | 3,389 | 3,769 | 3,957 | 4,532 | 4,805 | 5,119 | 3,986 | 4,368 | 5,047 | 6,342 | |
| SG&A expenses | 2,014 | 2,184 | 2,470 | 2,510 | 2,770 | 3,039 | 3,258 | 3,139 | 3,250 | 3,578 | 4,187 | |
| Operating profit | 920 | 1,205 | 1,300 | 1,446 | 1,762 | 1,766 | 1,861 | 847 | 1,117 | 1,469 | 2,155 | 1,800 |
| YoY change (%) | 77.9 | 30.9 | 7.9 | 11.3 | 21.9 | 0.2 | 5.4 | -54.5 | 31.9 | 31.5 | 46.7 | -16.5 |
| Operating income margin (%) | 10.0 | 11.5 | 11.2 | 11.8 | 13.5 | 10.5 | 10.3 | 4.8 | 6.6 | 9.5 | 9.3 | 7.6 |
| Non-operating profit | 12 | 14 | 15 | 15 | 12 | 28 | 42 | 88 | 34 | 26 | 28 | |
| Non-operating expenses | 122 | 174 | 118 | 133 | 106 | 150 | 144 | 226 | 152 | 212 | 419 | |
| Ordinary income | 166 | 272 | ||||||||||
| Extraordinary income | 810 | 1,044 | 1,196 | 1,329 | 1,669 | 1,643 | 1,759 | 709 | 999 | 1,283 | 1,765 | 1,500 |
| Extraordinary expenses | 85.4 | 28.9 | 14.6 | 11.1 | 25.6 | -1.6 | 7.1 | -59.7 | 40.9 | 28.4 | 37.6 | -15.0 |
| Loss before income taxes | 8.8 | 10.0 | 10.3 | 10.8 | 12.7 | 9.8 | 9.8 | 4.0 | 5.9 | 8.3 | 7.6 | 6.3 |
| Total income taxes | 97 | 32 | 3 | 20 | 0 | |||||||
| Net income attributable to owner of parent | 94 | 104 | 29 | 33 | 9 | |||||||
| YoY change (%) | 810 | 1,044 | 1,196 | 1,329 | 1,672 | 1,539 | 1,759 | 712 | 1,003 | 1,269 | 1,756 | |
| Net income margin (%) | 354 | 418 | 472 | 475 | 561 | 533 | 600 | 355 | 394 | 209 | 573 | |
| 456 | 626 | 724 | 854 | 1,111 | 1,007 | 1,159 | 358 | 609 | 1,060 | 1,183 | 1,000 | |
| [Balance Sheets] | 95.4 | 37.5 | 15.6 | 17.9 | 30.2 | -9.4 | 15.1 | -69.1 | 70.5 | 73.9 | 11.6 | -15.5 |
| Current assets | 5.0 | 6.0 | 6.3 | 6.9 | 8.5 | 6.0 | 6.4 | 2.0 | 3.6 | 6.8 | 5.1 | 4.2 |
| Property for sale | ||||||||||||
| Non-current assets | ||||||||||||
| Tangible assets | 8,023 | 7,836 | 10,366 | 9,749 | 15,874 | 15,745 | 18,094 | 19,040 | 18,968 | 27,929 | 29,522 | |
| Investments and other assets | 6,346 | 5,166 | 7,699 | 6,877 | 11,863 | 11,678 | 13,493 | 14,424 | 13,301 | 23,657 | 25,365 | |
| Total assets | 895 | 957 | 1,031 | 1,083 | 1,042 | 1,032 | 1,199 | 1,030 | 1,082 | 1,047 | 1,455 | |
| Current liabilities | 569 | 603 | 572 | 591 | 467 | 458 | 456 | 306 | 301 | 299 | 516 | |
| Short-term borrowings | 226 | 258 | 383 | 405 | 494 | 505 | 669 | 655 | 730 | 701 | 891 | |
| Non-current liabilities | 8,919 | 8,793 | 11,398 | 10,833 | 16,916 | 16,777 | 19,294 | 20,071 | 20,050 | 28,976 | 30,976 | |
| Long-Term Borrowings | 4,587 | 3,165 | 4,910 | 3,751 | 8,430 | 6,160 | 9,047 | 5,772 | 8,731 | 12,606 | 15,746 | |
| Total liabilities | 3,362 | 2,093 | 3,776 | 2,622 | 7,074 | 4,726 | 7,203 | 4,463 | 7,368 | 11,366 | 13,973 | |
| Total net assets | 465 | 367 | 453 | 226 | 479 | 1,710 | 351 | 4,232 | 1,017 | 5,314 | 3,153 | |
| Total shareholders’ equity | 419 | 316 | 175 | 84 | 362 | 1,320 | 0 | 3,879 | 740 | 5,033 | 2,905 | |
| Capital stock | 5,051 | 3,531 | 5,363 | 3,977 | 8,909 | 7,869 | 9,399 | 10,004 | 9,748 | 17,920 | 18,899 | |
| Legal capital reserve | 3,868 | 5,262 | 6,034 | 6,856 | 8,006 | 8,908 | 9,894 | 10,066 | 10,301 | 11,056 | 12,077 | |
| Retained earnings | 3,868 | 5,262 | 6,034 | 6,852 | 8,002 | 8,904 | 9,890 | 10,062 | 10,297 | 11,052 | 12,077 | |
| Stock acquisition right | 257 | 661 | 710 | 720 | 788 | 811 | 814 | 818 | 820 | 834 | 861 | |
| Total liabilities and net assets | 218 | 622 | 671 | 681 | 749 | 772 | 775 | 779 | 781 | 796 | 825 | |
| Equity ratio (%) | 3,393 | 3,978 | 4,654 | 5,451 | 6,464 | 7,320 | 8,302 | 8,465 | 8,863 | 9,709 | 10,664 | |
| 4 | 4 | 4 | 4 | 4 | 4 | 3 | 0 | |||||
| [Statements of cash flows] | 8,919 | 8,793 | 11,398 | 10,833 | 16,916 | 16,777 | 19,294 | 20,071 | 20,050 | 28,976 | 30,976 | |
| Cash flow from operating activities | 43.4 | 59.8 | 52.9 | 63.3 | 47.3 | 53.1 | 51.3 | 50.1 | 51.4 | 38.1 | 39.0 | |
| Loss before income taxes | ||||||||||||
| Cash flow from investing activities | ||||||||||||
| Cash flow from financing activities | -664 | 1,761 | -1,451 | 1,611 | -3,666 | 1,617 | -420 | -917 | 1,704 | -9,267 | -12 | |
| Issuance of shares | 810 | 1,044 | 1,196 | 1,329 | 1,672 | 1,539 | 1,759 | 712 | 1,003 | 1,269 | 1,756 | |
| Net increase in cash and cash equiv. | -175 | -111 | -116 | -184 | 107 | -64 | -71 | -288 | -51 | -266 | -766 | |
| Cash and cash equiv. at beginning of period | 1,136 | -612 | 1,588 | -1,278 | 4,667 | -1,495 | 984 | 953 | -608 | 7,971 | 303 | |
| Cash and cash equiv. at end of period | 800 | 97 | 21 | 37 | 45 | 6 | 9 | |||||
| Free cash flow | 296 | 1,039 | 22 | 150 | 1,108 | 58 | 493 | -251 | 1,045 | -1,563 | -475 | |
| [Statements of income] | 793 | 1,089 | 2,128 | 2,150 | 2,299 | 3,407 | 3,465 | 3,959 | 3,707 | 4,752 | 3,189 | |
| Net sales | 1,089 | 2,128 | 2,150 | 2,299 | 3,407 | 3,465 | 3,959 | 3,707 | 4,752 | 3,188 | 2,714 | |
| YoY change (%) | -839 | 1,650 | -1,567 | 1,427 | -3,559 | 1,553 | -491 | -1,205 | 1,653 | -9,533 | -777 |
Source: Omega Investment from company materials