2026-06-19
Home
Japanese

Omega Investment Co., Ltd.
Sansei Landic (Investment report)
| Share price (7/28) | ¥1,191 | Dividend Yield (25/12 CE) | 3.5 % |
| 52weeks high/low | ¥834/1,250 | ROE(24/12 act) | 8.5 % |
| Avg Vol (3 month) | 15.2 thou shrs | Operating margin (24/12 act) | 7.3 % |
| Market Cap | ¥10.23 bn | Beta (5Y Monthly) | 0.18 |
| Enterprise Value | ¥23.14 bn | Shares Outstanding | 8.584 mn shrs |
| PER (25/12 CE) | 9.2 X | Listed market | TSE Standard |
| PBR (24/12 act) | 0.7 X |
| Click here for the PDF version of this page |
| PDF version |
A player in the “revitalization” market that transforms social issues into profit opportunities: The shares are undervalued.
Investment conclusion in this report
Sansei Landic Co., Ltd. (hereinafter, “the Company”) has achieved stable growth through its unique business model, which centers on the revitalization of real estate with complex ownership or occupancy rights. Although profit declined in FY12/2024, the Company recorded its highest-ever net sales, and procurement results significantly exceeded the plan, reaffirming the strength of its business operations. The earnings forecast for FY12/2025 is conservative, with slight increases in both revenue and profit; however, it includes reassuring elements for shareholders, such as enhanced shareholder return measures and steady progress under the new medium-term management plan.
The stock price has been firm since the beginning of the year, which appears to reflect investors’ positive view of the strengthened shareholder initiatives and medium-term growth strategy. As per valuation, the stock remains notably undervalued with a projected PER of approximately 9x and a PBR of roughly 0.67x, suggesting there is room for revaluation.
Given the stability of earnings, future growth potential, and shareholder return stance, the stock is considered a worthy medium- to long-term investment opportunity, backed by its undervaluation.
Company overview
Sansei Landic Co., Ltd. primarily engages in a “Real estate revitalization business” that involves purchasing real estate with complex ownership or occupancy rights, such as land leasehold interests or properties with existing occupants, and reselling them after coordinating with the relevant parties. The Company also operates a leasehold land management business and a regional revitalization business.
Its main business segment is “real estate sales,” which includes the coordination of rights, sale, and management of “Leasehold land” and “Old unutilized properties” (aging apartment buildings with tenants and low profitability). In FY12/2024, the breakdown of consolidated net sales was as follows: 40% from Leasehold land, 51% from Old unutilized properties, 8% from Freehold, and 2% from other sources. The Company is headquartered in Tokyo and was established on February 1976.
Business characteristics and operations
The Company’s strength lies in revitalizing real estate that requires the coordination of rights and is difficult to distribute through ordinary channels. Focusing on Leasehold land and Old unutilized properties with existing leaseholders or tenants, the Company leverages its high level of expertise and negotiation capabilities to both resolve social issues and ensure profitability. In particular, land leaseholds are resilient to economic fluctuations and generate stable earnings.
In recent years, the Company has also focused on derivative business, such as ownership period (to maximize both income and capital gains), co-ownership, and leasehold rights. Additionally, it promotes regional revitalization business, including the restoration of vacant houses and traditional folk homes in rural areas. The sales structure is transitioning from a reliance on individuals to a team-based system, fostering a more sustainable growth structure through the appointment of younger employees and knowledge sharing.
Long-term performance
From FY2020 to FY2024, the Company’s performance has remained solid. Net sales increased from 17,774 million yen in FY2020 to 25,620 million yen in FY2024. Operating profit peaked at 2,155 million yen in FY2023, up from 847 million yen in FY2020, and settled at 1,882 million yen in FY2024, reflecting conservative profit estimates for certain old unutilized properties. The Leasehold land business, which offers high profit margins, supports earnings, and highlights the strength of the Company’s business model.
Most recent earnings (FY2024)
In FY12/2024, the Company posted record-high net sales of 25,620 million yen (+10.1% YoY). Operating profit declined to 1,882 million yen (-12.6% YoY), ordinary profit to 1,585 million yen (-10.2% YoY), and profit attributable to owners of parent to 1,050 million yen ( -11.2% YoY). Still, all figures exceeded the Company’s forecasts.
By segment, sales were as follows: Leasehold land, 10,233 million yen (YoY +24.0%); Old unutilized properties, 12,977 million yen (-1.2% YoY); and Freehold, 1,923 million yen (+29.2% YoY), with Freehold particularly standing out. Procurement totaled 19.24 billion yen (+3.4% YoY), significantly exceeding the initial plan of 15.8 billion yen, maintaining a high and stable level.
Full-year earnings forecast (FY2025)
The full-year earnings forecast for FY12/2025 calls for net sales of 25,650 million yen (YoY +0.1%), operating profit of 1,910 million yen (YoY +1.4%), ordinary profit of 1,600 million yen (YoY +0.9%), and profit attributable to owners of parent of 1,070 million yen (YoY +1.8%), indicating a conservative outlook of slight increases in both revenue and profit.
The forecasted sales breakdown is as follows: Leasehold land, 11.41 billion yen (YoY +11%), Old unutilized properties, 10.52 billion yen (YoY -18%), and Freehold, 3.14 billion yen (YoY +63%), with continued growth expected in Leasehold land and Freehold. Due to the nature of the Company’s business model, earnings may fluctuate between halves depending on the concentration of projects. For the current fiscal year, large projects are expected to be concentrated in the first half of the year.
Growth strategy and risks
The Company’s growth strategy is built on three pillars: “deepening of existing businesses,” “development of derivative business,” and “expansion of regional revitalization business.” It aims to maintain a competitive edge through enhancements to valuation standards, geographic expansion, and an expanded menu of rights coordination options, while also scaling up derivative business, including co-ownership interests, leasehold rights, and medium- to long-term property holdings.
Risks include changes in real estate market conditions (particularly interest rate trends), deterioration in procurement environment, prolonged or increasingly complex rights coordination processes, and the rise of competitors. As the proportion of large-scale projects increases, earnings volatility may also rise, making diversification of the business portfolio and enhancement of operational efficiency essential.
Medium-term management plan (August 2024 – December 2027)
Under its new medium-term management plan, the Company is targeting ROE of 9–12% and operating profit of 2.0 billion yen, aiming for sustainable growth as a “company that lasts 100 years.” Key focus areas include:
- Expansion of Leasehold land and Old unutilized properties, and improvement in profit margins
- Full-scale development of derivative business (co-ownership, ownership period, leasehold rights)
- Deployment of regional revitalization through a dedicated division (e.g., Hachimantai, Hirado City)
- Strengthening shareholder returns (dividend payout ratio of over 30%, share buybacks)
- Cost reduction, operational efficiency, and human resource development
The Company is also restructuring its PR strategy to raise brand awareness and aims to increase deal inflow from clients.
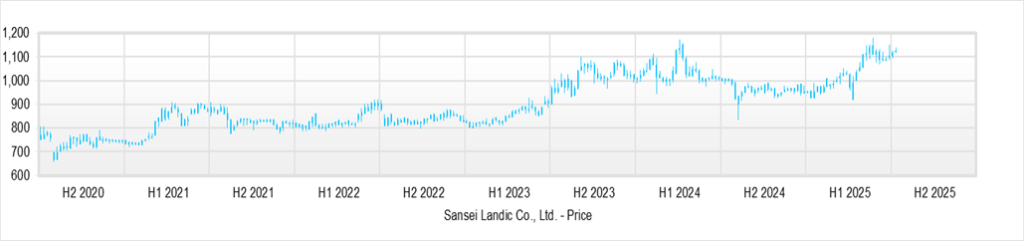
Stock price trend and valuation
Since the announcement of the medium-term management plan in August 2024, the stock price has remained firm in the 950–1,200 yen range. As of March 2025, the valuation indicators are: projected PER of approximately 9x, PBR of approximately 0.67x, and dividend yield of roughly 3.7%, suggesting an undervalued level with no signs of overheating, given the stability of earnings and shareholder returns.
Given the progress of the medium-term management plan and the potential achievements in derivative business and regional revitalization business, there remains ample room for further revaluation.
Investment conclusion based on performance and stock price assessment
Sansei Landic is a company that balances the resolution of social issues with profitability through its unique “rights-coordination-based real estate revitalization” business. In addition to its two core businesses, Leasehold land and Old unutilized properties, the Company is expanding into derivative business and regional revitalization business, pursuing medium- to long-term growth under its new medium-term management plan, and actively strengthening shareholder returns. All of these initiatives contribute to its appeal.
Currently, both projected PER and PBR remain at undervalued levels, indicating significant potential for future revaluation. With further enhancements to shareholder returns and the ongoing accumulation of corporate value, the stock is considered a worthy investment candidate for both domestic and international institutional investors.
Key financial data
| Unit: million yen | 2020/12 | 2021/12 | 2022/12 | 2023/12 | 2024/12 | 2025/12 CE |
| Sales | 17,775 | 16,836 | 15,533 | 23,269 | 25,620 | 25,650 |
| EBIT (Operating Income) | 847 | 1,118 | 1,469 | 2,155 | 1,883 | 1,910 |
| Pretax Income | 712 | 1,004 | 1,270 | 1,756 | 1,585 | 1,600 |
| Net Profit Attributable to Owner of Parent | 358 | 609 | 1,060 | 1,183 | 1,051 | 1,070 |
| Cash & Short-Term Investments | 4,330 | 5,361 | 3,837 | 3,770 | 5,013 | |
| Total assets | 20,071 | 20,051 | 28,977 | 30,976 | 33,107 | |
| Total Debt | 16,879 | 16,879 | 16,879 | 16,879 | 18,506 | |
| Net Debt | 13,109 | 13,109 | 13,109 | 13,109 | 13,493 | |
| Total liabilities | 10,004 | 9,749 | 17,921 | 18,899 | 20,349 | |
| Total Shareholders’ Equity | 12,077 | 12,077 | 12,077 | 12,077 | 12,759 | |
| Net Operating Cash Flow | -917 | 1,705 | -9,268 | -12 | 1,143 | |
| Capital Expenditure | 21 | 40 | 28 | 304 | 138 | |
| Net Investing Cash Flow | -288 | -51 | -267 | -766 | -715 | |
| Net Financing Cash Flow | 953 | -608 | 7,971 | 303 | 1,223 | |
| Free Cash Flow | -291 | -291 | -291 | -291 | 1,049 | |
| ROA (%) | 1.82 | 3.04 | 4.32 | 3.95 | 3.28 | |
| ROE (%) | 3.58 | 5.98 | 9.93 | 10.23 | 8.46 | |
| EPS (Yen) | 42.3 | 73.6 | 129.6 | 143.8 | 127.2 | 131.6 |
| BPS (Yen) | 1,192.9 | 1,249.5 | 1,356.8 | 1,465.5 | 1,541.8 | |
| Dividend per Share (Yen) | 25.00 | 26.00 | 28.00 | 33.00 | 41.00 | 42.00 |
| Shares Outstanding (Million Shares) | 8.47 | 8.47 | 8.49 | 8.58 | 8.58 |
Source: Omega Investment from company data, rounded to the nearest whole number.
Share price
Share Price (5Y)
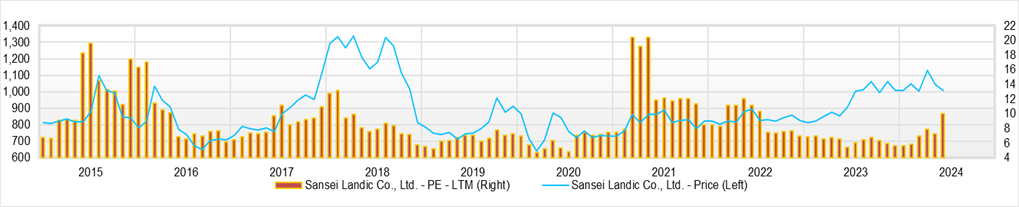
Share Price and PER (10Y)
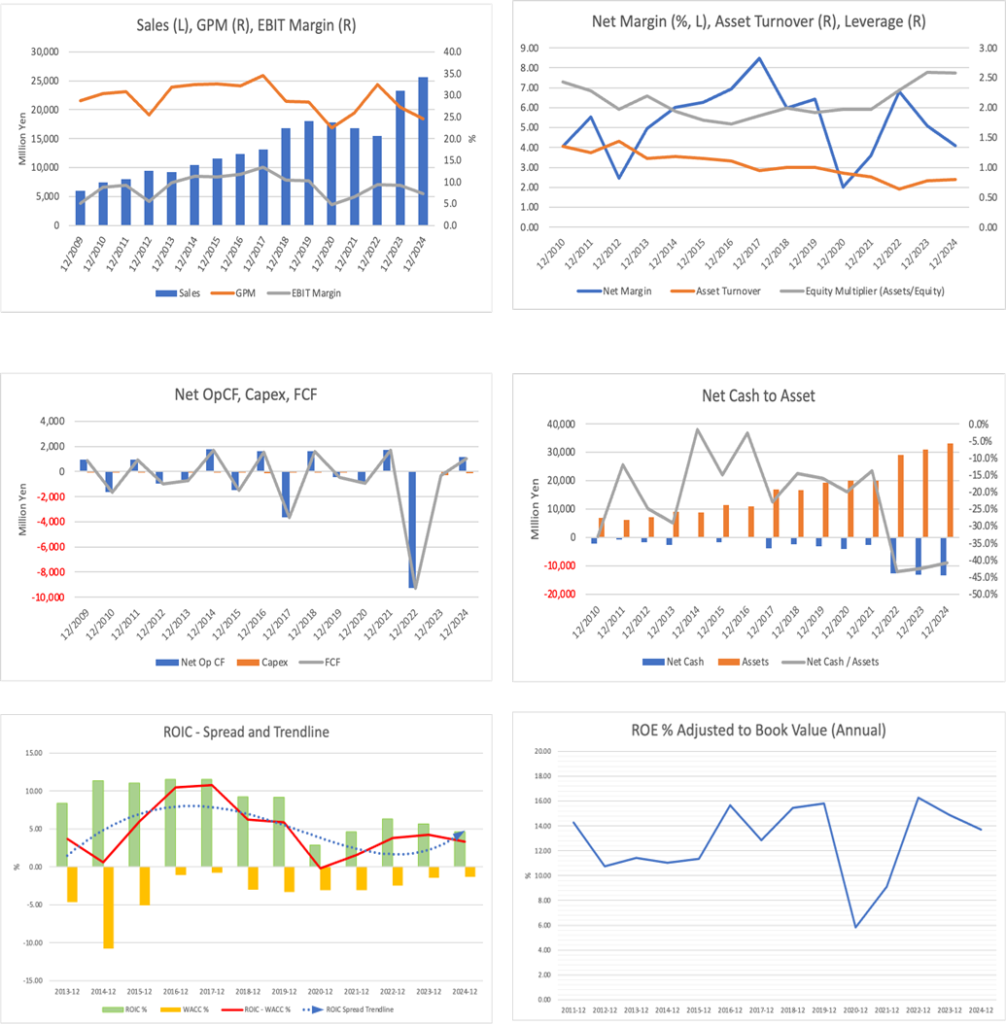
Financials
Financial data (quarterly basis)
| Unit: million yen | 2023/12 | 2024/12 | 2025/12 | ||||||
| 1Q | 2Q | 3Q | 4Q | 1Q | 2Q | 3Q | 4Q | 1Q | |
| (Income Statement) | |||||||||
| Sales | 6,486 | 5,494 | 7,485 | 3,804 | 7,207 | 5,785 | 8,358 | 4,270 | 8,848 |
| Year-on-year | 45.9% | 47.6% | 141.8% | -11.0% | 11.1% | 5.3% | 11.7% | 12.3% | 22.8% |
| Cost of Goods Sold (COGS) | 4,320 | 3,858 | 5,681 | 3,067 | 5,521 | 4,228 | 6,448 | 3,122 | 5,842 |
| Gross Income | 2,166 | 1,635 | 1,803 | 737 | 1,686 | 1,558 | 1,910 | 1,149 | 3,006 |
| Gross Income Margin | 33.4% | 29.8% | 24.1% | 19.4% | 23.4% | 26.9% | 22.9% | 26.9% | 34.0% |
| SG&A Expense | 1,048 | 1,097 | 1,128 | 914 | 1,115 | 1,102 | 1,125 | 1,077 | 1,200 |
| EBIT (Operating Income) | 1,118 | 539 | 676 | -177 | 571 | 455 | 785 | 72 | 1,806 |
| Year-on-year | 150.0% | 15.6% | 135.5% | -165.8% | -49.0% | -15.5% | 16.2% | -140.5% | 216.6% |
| Operating Income Margin | 17.2% | 9.8% | 9.0% | -4.7% | 7.9% | 7.9% | 9.4% | 1.7% | 20.4% |
| EBITDA | 1,145 | 559 | 692 | -161 | 587 | 476 | 806 | 92 | 1,827 |
| Pretax Income | 1,046 | 378 | 587 | -254 | 493 | 369 | 728 | -4 | 1,728 |
| Consolidated Net Income | 684 | 256 | 387 | -144 | 328 | 245 | 485 | -7 | 1,175 |
| Minority Interest | 0 | 0 | 0 | 0 | 0 | 0 | 0 | 0 | 0 |
| Net Income ATOP | 684 | 256 | 387 | -144 | 328 | 245 | 485 | -7 | 1,175 |
| Year-on-year | 82.2% | -24.4% | 97.9% | -195.1% | -52.0% | -4.0% | 25.2% | -94.9% | 258.2% |
| Net Income Margin | 10.5% | 4.7% | 5.2% | -3.8% | 4.6% | 4.2% | 5.8% | -0.2% | 13.3% |
| (Balance Sheet) | |||||||||
| Cash & Short-Term Investments | 3,569 | 4,266 | 5,388 | 3,770 | 4,479 | 4,988 | 4,728 | 5,013 | 5,788 |
| Total assets | 29,627 | 30,777 | 30,632 | 30,976 | 30,487 | 30,561 | 29,940 | 33,107 | 31,353 |
| Total Debt | 16,061 | 16,520 | 16,262 | 16,879 | 16,787 | 16,211 | 15,595 | 18,506 | 15,747 |
| Net Debt | 12,493 | 12,254 | 10,874 | 13,109 | 12,308 | 11,223 | 10,867 | 13,493 | 9,959 |
| Total liabilities | 18,064 | 18,944 | 18,412 | 18,899 | 18,354 | 18,163 | 17,173 | 20,349 | 17,712 |
| Total Shareholders’ Equity | 11,563 | 11,833 | 12,220 | 12,077 | 12,133 | 12,398 | 12,768 | 12,759 | 13,641 |
| (Profitability %) | |||||||||
| ROA | 5.50 | 4.81 | 5.08 | 3.95 | 2.75 | 2.66 | 3.02 | 3.28 | 6.14 |
| ROE | 12.43 | 11.42 | 12.79 | 10.23 | 6.98 | 6.74 | 7.32 | 8.46 | 14.73 |
| (Per-share) Unit: JPY | |||||||||
| EPS | 83.5 | 31.0 | 47.0 | -17.4 | 39.8 | 29.7 | 58.6 | -0.9 | 142.4 |
| BPS | 1,406.1 | 1,435.9 | 1,482.9 | 1,465.5 | 1,472.3 | 1,501.2 | 1,542.9 | 1,541.8 | 1,665.9 |
| Dividend per Share | 0.00 | 0.00 | 0.00 | 33.00 | 0.00 | 16.00 | 0.00 | 25.00 | 0.00 |
| Shares Outstanding(Million shares) | 8.58 | 8.58 | 8.58 | 8.58 | 8.58 | 8.58 | 8.58 | 8.58 | 8.58 |
Source: Omega Investment from company materials
Financial data (full-year basis)
| Unit: million yen | 2014/12 | 2015/12 | 2016/12 | 2017/12 | 2018/12 | 2019/12 | 2020/12 | 2021/12 | 2022/12 | 2023/12 | 2024/12 |
| (Income Statement) | |||||||||||
| Sales | 10,446 | 11,569 | 12,300 | 13,099 | 16,833 | 18,020 | 17,775 | 16,836 | 15,533 | 23,269 | 25,620 |
| Year-on-year | 13.7% | 10.8% | 6.3% | 6.5% | 28.5% | 7.1% | -1.4% | -5.3% | -7.7% | 49.8% | 10.1% |
| Cost of Goods Sold | 7,055 | 7,798 | 8,344 | 8,566 | 12,028 | 12,902 | 13,788 | 12,468 | 10,486 | 16,927 | 19,318 |
| Gross Income | 3,391 | 3,770 | 3,957 | 4,532 | 4,805 | 5,119 | 3,986 | 4,368 | 5,047 | 6,342 | 6,302 |
| Gross Income Margin | 32.5% | 32.6% | 32.2% | 34.6% | 28.5% | 28.4% | 22.4% | 25.9% | 32.5% | 27.3% | 24.6% |
| SG&A Expense | 2,204 | 2,216 | 2,295 | 2,434 | 2,702 | 2,891 | 2,750 | 2,877 | 3,031 | 3,569 | 4,420 |
| EBIT (Operating Income) | 1,187 | 1,300 | 1,446 | 1,762 | 1,766 | 1,861 | 847 | 1,118 | 1,469 | 2,155 | 1,883 |
| Year-on-year | 31.6% | 9.6% | 11.2% | 21.9% | 0.2% | 5.4% | -54.5% | 31.9% | 31.5% | 46.7% | -12.6% |
| Operating Income Margin | 11.4% | 11.2% | 11.8% | 13.5% | 10.5% | 10.3% | 4.8% | 6.6% | 9.5% | 9.3% | 7.3% |
| EBITDA | 1,260 | 1,406 | 1,532 | 1,833 | 1,822 | 1,912 | 896 | 1,161 | 1,517 | 2,236 | 1,962 |
| Pretax Income | 1,044 | 1,196 | 1,329 | 1,672 | 1,539 | 1,759 | 712 | 1,004 | 1,270 | 1,756 | 1,585 |
| Consolidated Net Income | 626 | 724 | 854 | 1,111 | 1,007 | 1,159 | 358 | 609 | 1,060 | 1,183 | 1,051 |
| Minority Interest | 0 | 0 | 0 | 0 | 0 | 0 | 0 | 0 | 0 | 0 | 0 |
| Net Income ATOP | 626 | 724 | 854 | 1,111 | 1,007 | 1,159 | 358 | 609 | 1,060 | 1,183 | 1,051 |
| Year-on-year | 37.5% | 15.6% | 17.9% | 30.2% | -9.4% | 15.1% | -69.1% | 70.5% | 73.9% | 11.6% | -11.2% |
| Net Income Margin | 6.0% | 6.3% | 6.9% | 8.5% | 6.0% | 6.4% | 2.0% | 3.6% | 6.8% | 5.1% | 4.1% |
| (Balance Sheet) | |||||||||||
| Cash & Short-Term Investments | 2,276 | 2,254 | 2,435 | 3,558 | 3,594 | 4,134 | 4,330 | 5,361 | 3,837 | 3,770 | 5,013 |
| Total assets | 8,793 | 11,398 | 10,833 | 16,916 | 16,777 | 19,294 | 20,071 | 20,051 | 28,977 | 30,976 | 33,107 |
| Total Debt | 2,414 | 3,958 | 2,712 | 7,439 | 6,048 | 7,203 | 8,342 | 8,108 | 16,399 | 16,879 | 18,506 |
| Net Debt | 139 | 1,704 | 277 | 3,881 | 2,454 | 3,069 | 4,012 | 2,747 | 12,562 | 13,109 | 13,493 |
| Total liabilities | 3,531 | 5,363 | 3,977 | 8,909 | 7,869 | 9,399 | 10,004 | 9,749 | 17,921 | 18,899 | 20,349 |
| Total Shareholders’ Equity | 5,262 | 6,034 | 6,856 | 8,006 | 8,908 | 9,895 | 10,067 | 10,302 | 11,056 | 12,077 | 12,759 |
| (Cash Flow) | |||||||||||
| Net Operating Cash Flow | 1,761 | -1,451 | 1,611 | -3,666 | 1,617 | -420 | -917 | 1,705 | -9,268 | -12 | 1,143 |
| Capital Expenditure | 91 | 58 | 111 | 57 | 66 | 61 | 21 | 40 | 28 | 304 | 138 |
| Net Investing Cash Flow | -111 | -116 | -184 | 107 | -64 | -71 | -288 | -51 | -267 | -766 | -715 |
| Net Financing Cash Flow | -612 | 1,588 | -1,278 | 4,667 | -1,495 | 984 | 953 | -608 | 7,971 | 303 | 1,223 |
| Free Cash Flow | 1,697 | -1,491 | 1,536 | -3,692 | 1,572 | -446 | -923 | 1,682 | -9,282 | -291 | 1,049 |
| (Profitability %) | |||||||||||
| ROA | 7.07 | 7.17 | 7.68 | 8.01 | 5.98 | 6.42 | 1.82 | 3.04 | 4.32 | 3.95 | 3.28 |
| ROE | 13.72 | 12.82 | 13.24 | 14.96 | 11.90 | 12.32 | 3.58 | 5.98 | 9.93 | 10.23 | 8.46 |
| (Per-share) Unit: JPY | |||||||||||
| EPS | 90.2 | 90.1 | 104.9 | 134.4 | 119.6 | 137.1 | 42.3 | 73.6 | 129.6 | 143.8 | 127.2 |
| BPS | 664.8 | 744.2 | 841.3 | 958.0 | 1,054.5 | 1,170.2 | 1,192.9 | 1,249.5 | 1,356.8 | 1,465.5 | 1,541.8 |
| Dividend per Share | 6.00 | 10.00 | 12.00 | 18.00 | 21.00 | 23.00 | 25.00 | 26.00 | 28.00 | 33.00 | 41.00 |
| Shares Outstanding (Million shares) | 7.91 | 8.11 | 8.15 | 8.35 | 8.45 | 8.46 | 8.47 | 8.47 | 8.49 | 8.58 | 8.58 |
Source: Omega Investment from company materials