2026-06-19
Home
Japanese

Omega Investment Co., Ltd.
CHUGAI RO (Company note – 2Q update)

| Share price (12/16) | ¥4,375 | Dividend Yield (26/3 CE) | 3.4 % |
| 52weeks high/low | ¥2,723/5,220 | ROE(25/3) | 10.7 % |
| Avg Vol (3 month) | 40.1 thou shrs | Operating margin (25/3) | 7.5 % |
| Market Cap | ¥34.12 bn | Beta (5Y Monthly) | 0.23 |
| Enterprise Value | ¥31.67 bn | Shares Outstanding | 7.800 mn shrs |
| PER (26/3 CE) | 8.6 X | Listed market | TSE Prime section |
| PBR (25/3 act) | 1.1 X |
| Click here for the PDF version of this page |
| PDF version |
For the second quarter of FY3/2026, order intake increased, and both net sales and profit grew, raising the probability of achieving the full-year forecast.
◇ Highlights of second-quarter results for FY3/2026: increase in order intake, growth in both net sales and profit. The second-quarter (first half) results for FY3/2026, which CHUGAI RO (hereinafter, the Company) announced on October 31, 2025, were solid again following the first quarter.
Order intake was 18.79 billion yen (up 9.9% YoY), order backlog was 41.78 billion yen (up 12.9% YoY), net sales were 14.76 billion yen (up 0.3% YoY), and operating profit was 160 million yen (up 109.3% YoY). Ordinary profit was 260 million yen (up 12.3% YoY). Profit attributable to owners of parent was 1.05 billion yen (up 103.8% YoY).
The key points of these results are the following three items.
First, the qualitative enrichment of order intake and profit/loss. Order intake has generally been performing well and is exceeding the plan. In the Heat Treatment Business, the Company won contracts for vacuum carburizing furnaces for automobiles in Japan, ovens for housing equipment components, and functional-material heat-treatment furnaces for semiconductor-related applications. In contrast, in the Plant Business, it won contracts for reheating furnaces for nonferrous metals in Japan, modification work on reheating furnaces for the steel industry overseas, process line cleaning equipment, and other orders. Among these, order intake for electric furnace dust recycling equipment for steel, which was also mentioned in the first quarter, can be expected to expand in the medium term.
On the profit and loss front, although net sales increased only slightly, the gross profit margin improved by 1.3 percentage points due to order intake at appropriate prices, and operating profit grew significantly as the Company absorbed the increase in selling, general, and administrative expenses.
Second, the probability of achieving the full-year company forecast has increased. Given that both order intake and order backlog grew solidly and that the quality of profits has also improved, progress toward the full-year company forecast is inferred to be steady. The Company’s results exhibit strong seasonality, with profits typically accumulating in the second half. The outlook is that in the second half, work on process lines for the steel industry in Japan and overseas, and on heat treatment furnaces for machine parts and functional materials, will proceed smoothly, thereby increasing the probability of achieving the full-year plan. The impact of the Trump tariffs is a point to watch, but for the time being, no new negative factors are evident.
Third, progress in the sale of cross-shareholdings. The Company recorded extraordinary income of 1.28 billion yen in the first quarter and will record an additional 1.31 billion yen on November 4.
◇ Earnings forecast for FY3/2026
The Company has revised its full-year earnings forecast, reflecting the expectation of extraordinary income from the partial sale of investment securities. Specifically, order intake of 37.80 billion yen (down 2.5% YoY), net sales of 37.50 billion yen (up 3.5% YoY), operating profit of 3.00 billion yen (up 9.7% YoY), and ordinary profit of 3.15 billion yen (up 4.9% YoY) remain unchanged from the initial forecasts. Profit attributable to owners of parent has been revised upward to 3.70 billion yen (up 23.4% YoY). Net income per share is 510.18 yen. There is no change in the annual dividend per share of 150 yen.
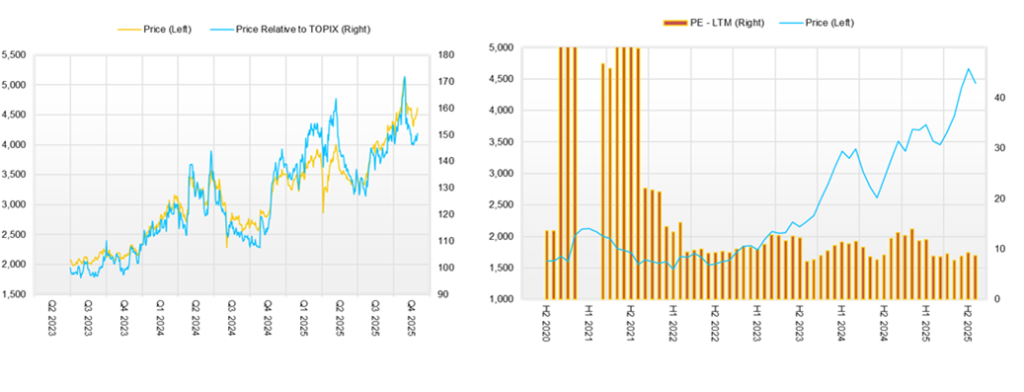
◇ Stock price trends and points of focus going forward
The Company’s stock price rose steadily after the announcement of the first-quarter results, reaching 5,220 yen on October 29, but then entered a period of adjustment to the 4,200-yen range. However, at present it is holding firm in the 4,500-yen range. Currently, PBR is above 1.0 times, while the forward PER remains at 8.8 times, and there is little sense of overheating in the stock price.
For the stock price to rise further going forward, the Company needs to continue to deliver strong results in the third quarter, thereby increasing the probability of achieving the full-year earnings forecast; to further increase the likelihood of achieving the targets for the final fiscal year of the current Medium-Term Management Plan (net sales of 41.5 billion yen, operating profit of 3.62 billion yen, and ROE of 10%); and to implement the acquisition of treasury stock to realize a total payout ratio of 50% in the current fiscal year.
Through interviews with the Company, we have confirmed its recognition that, as of now, there has been no significant change in the order environment. Accordingly, we expect the Company to create new markets focused on carbon neutrality and to expand sales and improve profitability by enhancing existing products. Please refer to the recent case studies of results shown on the next page.
However, attention will be needed to automobile manufacturers’ willingness to invest in internal combustion-related areas and to blast furnace manufacturers’ stance toward efforts for carbon neutrality.
Order intake trend
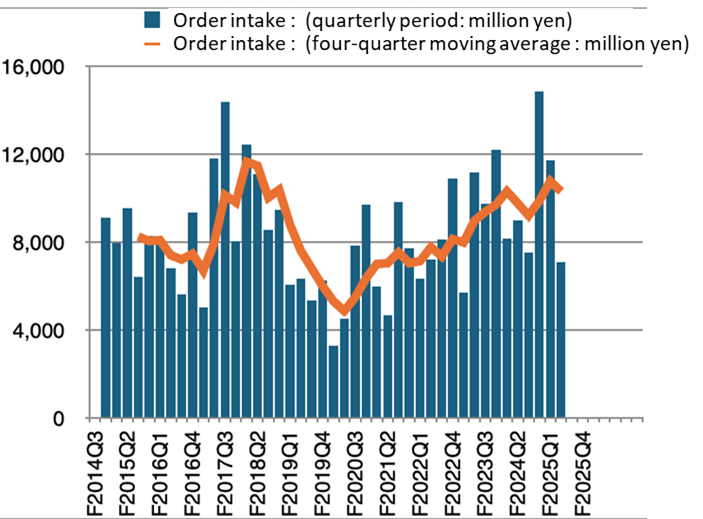
Source: Omega Investment from company materials
Case studies of results from strategic initiatives
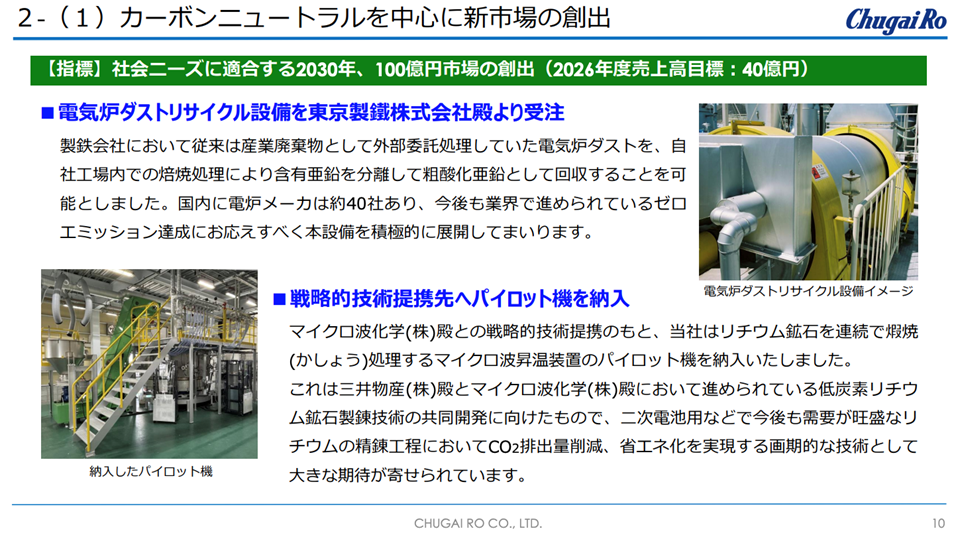
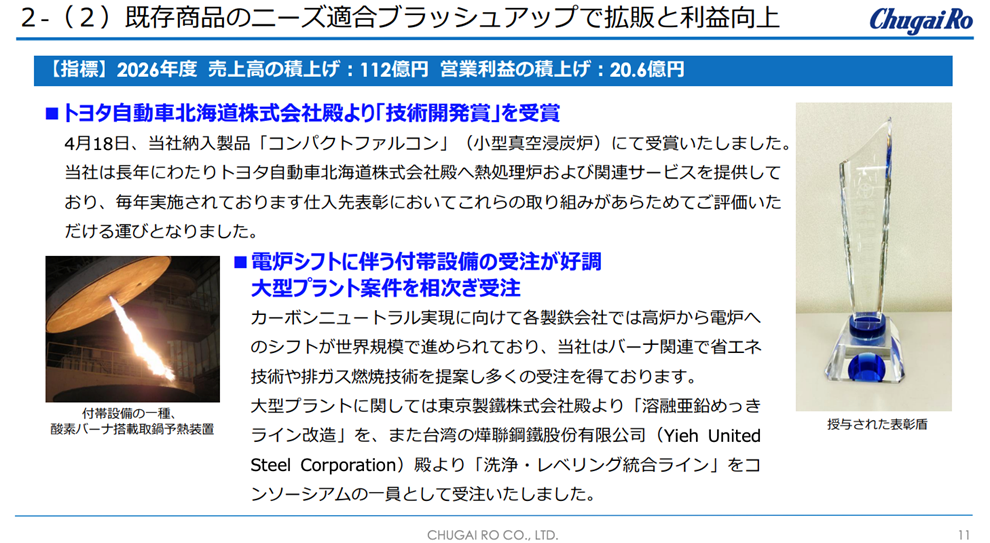
Source: company materials
Company profile
CHUGAI RO CO., LTD.is Japan’s leading manufacturer of industrial furnaces and industrial burners, whose management philosophy is: “Chugai Ro creates new value through its core of thermal technology, thus contributing to society while realizing the prosperity of the company and the happiness of its employees.” With a track record of developing over 100 types of industrial furnaces, the Company is known as a “department store of industrial furnaces.” Under the slogan “Pioneering the future with thermal technology,” and based on its foundational technologies in thermal technology, engineering capabilities, and advanced technology accumulated since its founding in 1945, the Company provides industrial furnaces and related equipment to the steel, automotive, and information and communications industries. Currently, based on its Management Vision 2026, “Renovate ourselves to develop our future with the technology for carbon neutrality!”, the Company aims to contribute to society and expand corporate value through carbon-neutral technology under its Medium-Term Management Plan (FY2022–FY2026). Attention from the stock market is increasing.
Key financial data
| Unit: million yen | 2021 | 2022 | 2023 | 2024 | 2025 | 2026 CE |
| Sales | 24,717 | 26,317 | 27,976 | 29,283 | 36,247 | 37,500 |
| EBIT (Operating Income) | 389 | 1,264 | 1,310 | 1,479 | 2,737 | 3,000 |
| Pretax Income | 527 | 1,594 | 1,699 | 3,129 | 4,222 | |
| Net Profit Attributable to Owner of Parent | 329 | 1,360 | 1,231 | 2,197 | 2,998 | 3,700 |
| Cash & Short-Term Investments | 7,121 | 11,130 | 7,884 | 10,061 | 4,392 | |
| Total assets | 38,577 | 38,141 | 41,178 | 48,863 | 48,736 | |
| Total Debt | 5,988 | 3,988 | 3,988 | 7,288 | 5,507 | |
| Net Debt | -1,133 | -7,142 | -3,896 | -2,773 | 1,115 | |
| Total liabilities | 16,784 | 14,928 | 17,134 | 21,092 | 20,125 | |
| Total Shareholders’ Equity | 21,681 | 23,068 | 23,860 | 27,570 | 28,329 | |
| Net Operating Cash Flow | 3,300 | 6,090 | -2,500 | -891 | -3,696 | |
| Capital Expenditure | 442 | 317 | 240 | 1,335 | 798 | |
| Net Investing Cash Flow | -551 | 510 | -63 | 550 | 654 | |
| Net Financing Cash Flow | -4,481 | -2,508 | -727 | 2,451 | -2,701 | |
| Free Cash Flow | 3,036 | 5,963 | -2,688 | -2,161 | -4,419 | |
| ROA (%) | 0.77 | 3.55 | 3.10 | 4.88 | 6.14 | |
| ROE (%) | 1.56 | 6.08 | 5.25 | 8.54 | 10.73 | |
| EPS (Yen) | 42.9 | 177.2 | 162.0 | 293.8 | 407.6 | |
| BPS (Yen) | 2,824.1 | 3,005.3 | 3,146.7 | 3,709.0 | 3,859.0 | |
| Dividend per Share (Yen) | 60.00 | 70.00 | 70.00 | 80.00 | 150.00 | |
| Shares Outstanding (Million shares) | 7.80 | 7.80 | 7.80 | 7.80 | 7.80 |
Share price
Financial data (quarterly basis)
| Unit: million yen | 2024/3 | 2025/3 | 2026/3 | ||||||
| 2Q | 3Q | 4Q | 1Q | 2Q | 3Q | 4Q | 1Q | 2Q | |
| (Income Statement) | |||||||||
| Sales | 7,868 | 5,837 | 10,837 | 5,280 | 9,441 | 7,498 | 14,028 | 6,347 | 8,422 |
| Year-on-year | 33.5% | -15.3% | -5.7% | 11.4% | 20.0% | 28.5% | 29.4% | 20.2% | -10.8% |
| Cost of Goods Sold (COGS) | 6,287 | 4,905 | 7,681 | 4,759 | 7,521 | 6,138 | 10,238 | 5,464 | 6,658 |
| Gross Income | 1,581 | 932 | 3,156 | 521 | 1,920 | 1,360 | 3,790 | 883 | 1,764 |
| Gross Income Margin | 20.1% | 16.0% | 29.1% | 9.9% | 20.3% | 18.1% | 27.0% | 13.9% | 20.9% |
| SG&A Expense | 1,205 | 1,121 | 1,238 | 1,203 | 1,160 | 1,163 | 1,328 | 1,254 | 1,229 |
| EBIT (Operating Income) | 376 | -189 | 1,918 | -682 | 760 | 197 | 2,462 | -371 | 535 |
| Year-on-year | 817.1% | -253.7% | 2.1% | 8.9% | 102.1% | -204.2% | 28.4% | -45.6% | -29.6% |
| Operating Income Margin | 4.8% | -3.2% | 17.7% | -12.9% | 8.0% | 2.6% | 17.6% | -5.8% | 6.4% |
| EBITDA | 474 | -58 | 2,068 | -551 | 902 | 334 | 2,604 | -253 | 661 |
| Pretax Income | 1,477 | 189 | 1,903 | 50 | 775 | 704 | 2,693 | 1,032 | 514 |
| Consolidated Net Income | 1,015 | 101 | 1,391 | -9 | 544 | 504 | 2,033 | 673 | 333 |
| Minority Interest | -14 | -5 | 46 | 2 | 15 | 16 | 41 | -31 | -17 |
| Net Income ATOP | 1,030 | 106 | 1,344 | -12 | 530 | 487 | 1,993 | 704 | 351 |
| Year-on-year | 751.2% | -30.3% | -0.5% | -95.8% | -48.5% | 359.4% | 48.3% | -5966.7% | -33.8% |
| Net Income Margin | 13.1% | 1.8% | 12.4% | -0.2% | 5.6% | 6.5% | 14.2% | 11.1% | 4.2% |
| (Balance Sheet) | |||||||||
| Cash & Short-Term Investments | 9,688 | 8,640 | 10,061 | 6,097 | 5,567 | 3,855 | 4,392 | 6,071 | 5,853 |
| Total assets | 47,895 | 46,439 | 48,863 | 43,463 | 45,170 | 43,667 | 48,736 | 46,023 | 47,656 |
| Total Debt | 10,280 | 8,402 | 7,288 | 6,209 | 7,180 | 6,687 | 5,507 | 6,397 | 5,240 |
| Net Debt | 592 | -238 | -2,773 | 112 | 1,613 | 2,832 | 1,115 | 326 | -613 |
| Total liabilities | 23,133 | 21,744 | 21,092 | 17,079 | 18,797 | 17,115 | 20,125 | 18,878 | 19,322 |
| Total Shareholders’ Equity | 24,591 | 24,544 | 27,570 | 26,178 | 26,143 | 26,321 | 28,329 | 26,908 | 28,117 |
| (Profitability %) | |||||||||
| ROA | 5.40 | 5.29 | 4.88 | 5.61 | 4.23 | 5.22 | 6.14 | 8.30 | 7.61 |
| ROE | 9.68 | 9.40 | 8.54 | 9.82 | 7.76 | 9.24 | 10.73 | 13.99 | 13.03 |
| (Per-share) Unit: JPY | |||||||||
| EPS | 137.7 | 14.3 | 180.8 | -1.6 | 71.9 | 66.3 | 271.5 | 96.6 | 48.6 |
| BPS | 3,307.9 | 3,301.7 | 3,709.0 | 3,565.6 | 3,561.1 | 3,585.4 | 3,859.0 | 3,717.8 | 3,884.9 |
| Dividend per Share | 0.00 | 0.00 | 80.00 | 0.00 | 0.00 | 0.00 | 150.00 | 0.00 | 0.00 |
| Shares Outstanding (million shares) | 7.80 | 7.80 | 7.80 | 7.80 | 7.80 | 7.80 | 7.80 | 7.80 | 7.80 |
Financial data (full-year basis)
| Unit: million yen | 2016 | 2017 | 2018 | 2019 | 2020 | 2021 | 2022 | 2023 | 2024 | 2025 |
| (Income Statement) | ||||||||||
| Sales | 32,795 | 31,146 | 30,829 | 37,089 | 38,089 | 24,717 | 26,317 | 27,976 | 29,283 | 36,247 |
| Year-on-year | 33.6% | -5.0% | -1.0% | 20.3% | 2.7% | -35.1% | 6.5% | 6.3% | 4.7% | 23.8% |
| Cost of Goods Sold | 28,449 | 26,575 | 25,795 | 32,140 | 32,023 | 20,282 | 21,007 | 22,494 | 23,448 | 28,656 |
| Gross Income | 4,346 | 4,571 | 5,034 | 4,949 | 6,066 | 4,435 | 5,310 | 5,482 | 5,835 | 7,591 |
| Gross Income Margin | 13.3% | 14.7% | 16.3% | 13.3% | 15.9% | 17.9% | 20.2% | 19.6% | 19.9% | 20.9% |
| SG&A Expense | 3,669 | 3,797 | 3,853 | 3,962 | 4,354 | 4,046 | 4,046 | 4,172 | 4,356 | 4,854 |
| EBIT (Operating Income) | 677 | 774 | 1,181 | 987 | 1,712 | 389 | 1,264 | 1,310 | 1,479 | 2,737 |
| Year-on-year | 180.9% | 14.3% | 52.6% | -16.4% | 73.5% | -77.3% | 224.9% | 3.6% | 12.9% | 85.1% |
| Operating Income Margin | 2.1% | 2.5% | 3.8% | 2.7% | 4.5% | 1.6% | 4.8% | 4.7% | 5.1% | 7.6% |
| EBITDA | 1,037 | 1,112 | 1,527 | 1,378 | 2,080 | 749 | 1,676 | 1,710 | 1,953 | 3,289 |
| Pretax Income | 715 | 967 | 1,294 | 1,177 | 1,701 | 527 | 1,594 | 1,699 | 3,129 | 4,222 |
| Consolidated Net Income | 572 | 1,000 | 905 | 781 | 1,158 | 364 | 1,429 | 1,295 | 2,216 | 3,072 |
| Minority Interest | 27 | 21 | 40 | 26 | 37 | 35 | 69 | 64 | 19 | 74 |
| Net Income ATOP | 545 | 978 | 864 | 754 | 1,120 | 329 | 1,360 | 1,231 | 2,197 | 2,998 |
| Year-on-year | 79.9% | 79.4% | -11.7% | -12.7% | 48.5% | -70.6% | 313.4% | -9.5% | 78.5% | 36.5% |
| Net Income Margin | 1.7% | 3.1% | 2.8% | 2.0% | 2.9% | 1.3% | 5.2% | 4.4% | 7.5% | 8.3% |
| (Balance Sheet) | ||||||||||
| Cash & Short-Term Investments | 6,923 | 7,833 | 6,858 | 5,169 | 8,658 | 7,121 | 11,130 | 7,884 | 10,061 | 4,392 |
| Total assets | 39,665 | 38,502 | 41,368 | 42,731 | 46,696 | 38,577 | 38,141 | 41,178 | 48,863 | 48,736 |
| Total Debt | 3,988 | 3,988 | 4,010 | 4,995 | 9,988 | 5,988 | 3,988 | 3,988 | 7,288 | 5,507 |
| Net Debt | -2,935 | -3,845 | -2,848 | -174 | 1,330 | -1,133 | -7,142 | -3,896 | -2,773 | 1,115 |
| Total liabilities | 20,300 | 18,131 | 20,131 | 21,774 | 26,006 | 16,784 | 14,928 | 17,134 | 21,092 | 20,125 |
| Total Shareholders’ Equity | 19,292 | 20,295 | 21,138 | 20,875 | 20,589 | 21,681 | 23,068 | 23,860 | 27,570 | 28,329 |
| (Cash Flow) | ||||||||||
| Net Operating Cash Flow | 1,260 | 1,033 | 377 | -1,348 | -580 | 3,300 | 6,090 | -2,500 | -891 | -3,696 |
| Capital Expenditure | 290 | 113 | 420 | 456 | 244 | 442 | 317 | 240 | 1,335 | 798 |
| Net Investing Cash Flow | -499 | 402 | -837 | -478 | -442 | -551 | 510 | -63 | 550 | 654 |
| Net Financing Cash Flow | -405 | -484 | -468 | 279 | 4,510 | -4,481 | -2,508 | -727 | 2,451 | -2,701 |
| Free Cash Flow | 1,016 | 933 | 2 | -1,725 | -775 | 3,036 | 5,963 | -2,688 | -2,161 | -4,419 |
| (Profitability ) | ||||||||||
| ROA (%) | 1.45 | 2.50 | 2.17 | 1.80 | 2.51 | 0.77 | 3.55 | 3.10 | 4.88 | 6.14 |
| ROE (%) | 2.78 | 4.95 | 4.18 | 3.59 | 5.41 | 1.56 | 6.08 | 5.25 | 8.54 | 10.73 |
| Net Margin (%) | 1.66 | 3.14 | 2.81 | 2.04 | 2.94 | 1.33 | 5.17 | 4.40 | 7.50 | 8.27 |
| Asset Turn | 0.87 | 0.80 | 0.77 | 0.88 | 0.85 | 0.58 | 0.69 | 0.71 | 0.65 | 0.74 |
| Assets/Equity | 1.92 | 1.97 | 1.93 | 2.00 | 2.16 | 2.02 | 1.71 | 1.69 | 1.75 | 1.75 |
| (Per-share) Unit: JPY | ||||||||||
| EPS | 70.0 | 125.7 | 111.0 | 97.2 | 145.9 | 42.9 | 177.2 | 162.0 | 293.8 | 407.6 |
| BPS | 2,478.6 | 2,607.8 | 2,716.9 | 2,718.6 | 2,681.5 | 2,824.1 | 3,005.3 | 3,146.7 | 3,709.0 | 3,859.0 |
| Dividend per Share | 60.00 | 60.00 | 60.00 | 60.00 | 60.00 | 60.00 | 70.00 | 70.00 | 80.00 | 150.00 |
| Shares Outstanding (million shares) | 7.80 | 7.80 | 7.80 | 7.80 | 7.80 | 7.80 | 7.80 | 7.80 | 7.80 | 7.80 |