2026-06-19
Home
Japanese

Omega Investment Co., Ltd.
Itoki (Company note – 4Q update)

| Share price (3/4) | ¥3,260 | Dividend Yield (26/12 CE) | 2.76 % |
| 52weeks high/low | ¥3,695/1,356 | ROE(25/12 act) | 17.7 % |
| Avg Vol (3 month) | 188 thou shrs | Operating margin (25/12 act) | 8.9 % |
| Market Cap | ¥174.0 bn | Beta (5Y Monthly) | 0.55 |
| Enterprise Value | ¥194.8 bn | Shares Outstanding | 53.38 mn shrs |
| PER (26/12 CE) | 14.48 X | Listed market | TSE Prime |
| PBR (25/12 act) | 2.84 X |
| Click here for the PDF version of this page |
| PDF version |
Consecutive record-high profit updates. Transition from “Tech×Design based on PEOPLE” to “AI×Design based on PEOPLE.” Aiming for a new stage of value creation.
◇ FY12/2025 full-year results highlights: the medium-term management plan targets have been almost achieved one year ahead of schedule
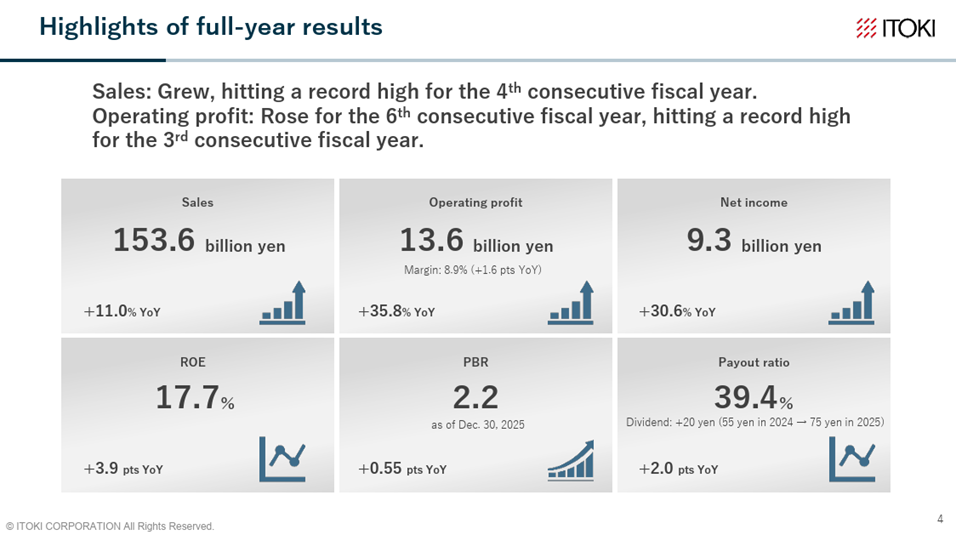
The FY12/2025 full-year results announced by Itoki on February 13, 2026, showed strong growth that exceeded the company’s forecast. Net sales were 153.68 billion yen (+ 11% YoY), operating profit was 13.68 billion yen (+ 36% YoY), ordinary profit was 13.74 billion yen (+ 37% YoY), net income attributable to owners of the parent was 9.38 billion yen (+ 31% YoY), and earnings per share was 190.17 yen (+ 29% YoY).
Net sales increased for four consecutive fiscal years, reaching a record high, and operating profit increased for six consecutive fiscal years, reaching a record high for three consecutive fiscal years. The operating profit margin was 8.9% (+ 1.6 points), and ROE was 17.7% (+ 3.9 points), improving management efficiency as well. The annual dividend per share was revised from the previous forecast of 68 yen to 75 yen (+ 20 yen YoY), and the payout ratio was 39.4%, nearly reaching the 40% target. In addition, this means that the numerical targets for the final year of the current medium-term management plan (net sales of 150.0 billion yen, operating profit of 14.0 billion yen, operating profit margin of 9%, and ROE of 15%) were achieved one year ahead of schedule.
Business expansion is in a virtuous cycle. Demand for office renewal and relocation, fueled by enthusiasm for investment in human capital, is rising nationwide, and the Company is responding by providing added value beyond selling products, including spatial design, consulting, and design proposals. As a result, improvements in profit margins have continued due to volume expansion and appropriate pricing. Gross profit has increased, and the Company is covering strategic spending, including higher personnel costs accompanying business expansion and increased costs for strengthening IT infrastructure to promote DX, thereby significantly increasing operating profit.
Both the Workplace Business and the Equipment & Public Works-Related Business are performing well. The Workplace Business recorded net sales of 111.53 billion yen (+ 9% YoY), operating profit of 11.00 billion yen (+ 37% YoY), and an operating profit margin of 9.9% (+ 2.0 points). The background to this is mainly as described above. On the other hand, the Equipment & Public Works-Related Business recorded net sales of 40.57 billion yen (+ 17% YoY), operating profit of 2.49 billion yen (+ 34% YoY), and an operating profit margin of 6.1% (+ 0.7 points). Although the impact of delays in construction starts and completions on the customer side, against the backdrop of soaring material prices, remains for equipment, etc., for logistics facilities, net sales of equipment for research facilities are increasing, and profit margins are improving. Profitability improvement at subsidiary Dalton is progressing.
In addition, there are no noteworthy items on the balance sheet at this time. Cash generation and cash allocation are also steady. Employee engagement is also being maintained at a high level.
It can be summarized as a set of results with no gaps.
◇ FY12/2026 earnings forecast: toward consecutive record-high profit updates.
The full-year earnings forecast for FY12/2026 is net sales of 167.50 billion yen (+ 9% YoY), operating profit of 16.00 billion yen (+ 17% YoY), ordinary profit of 16.00 billion yen (+ 17% YoY), net income attributable to owners of the parent of 11.20 billion yen (+ 19% YoY), and earnings per share of 226.68 yen (+ 19% YoY), aiming for consecutive record-high profit updates. Investment in human capital is expected to be the backdrop for steadily capturing renewal demand and continuing double-digit profit growth, and the operating profit margin forecast is 9.6%, meeting the medium-term management plan target. Both the Workplace Business and the Equipment & Public Works-Related Business (on a basis excluding Dalton’s headquarters relocation expenses) are assumed to achieve increases in both revenue and profit.
In addition, since the ongoing business talks, a leading indicator of net sales, are 117% YoY as of late January 2026, confidence in achieving this full-year plan is considered high.
In addition, the annual dividend per share is forecast to be 90 yen (+ 15 yen), and the payout ratio is forecast to be 39.7%.
◇ Progress of priority strategies in the medium-term management plan: steady
The progress of the priority strategies in the medium-term management plan is generally steady.
【Progress of each priority strategy in the medium-term management plan】
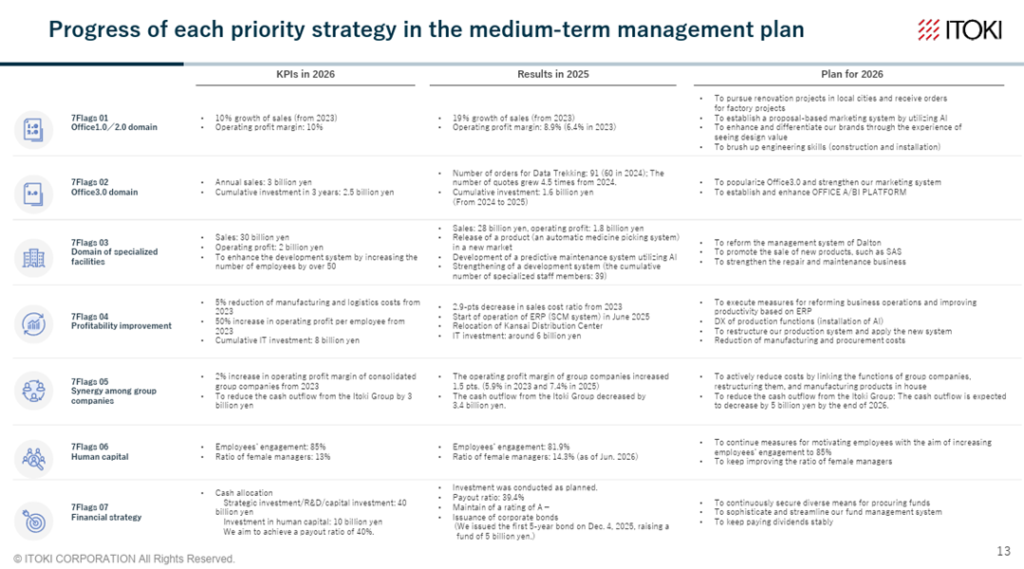
Source: Company material
There are three points of focus.
First, the acquisition of factory projects. As a measure to turn the rising needs for offices and the like within factories, cafeteria areas, and full facility renovations into projects, it will open up a new domain.
Second, monetization of the Office 3.0 domain, which is an office operation support service utilizing data, and the Company stated at the earnings briefing that it will make further efforts toward this monetization. The number of orders and estimates is steadily increasing. Since it is also seeking deployment to factories, sales floors, research facilities, and the like, we would like to assess the Company’s execution capability for this fiscal year. Patent applications are also steady.
In addition, related to this, the Company announced on February 20 that it will start providing “ITOKI OFFICE AI AGENTS” within the year as a new solution for Office 3.0 (details described later).
Third, it is the strategy of transplanting Itoki’s Office 1.0/2.0/3.0 to Dalton, the core subsidiary of the Equipment & Public Works-Related Business, namely the LAB 1.0/2.0/3.0 strategy. Capturing the intensifying competition for acquiring research personnel and the expansion of rental lab buildings, it proposes added value such as spatial design and workstyle consulting, not limited to product sales, and assumes a deployment that also provides operational support through the use of data from research facilities, and it has established a team that conducts spatial design and consulting and is promoting operations.
After the relocation of Dalton’s headquarters scheduled for autumn 2026, it plans to start demonstrations of LAB 3.0 for customers at the Tokyo showroom.
◇ Release of “ITOKI OFFICE AI AGENTS”
The Company announced on February 20 that it will start providing “ITOKI OFFICE AI AGENTS” within the year as a new solution for Office 3.0.
This can be said to be a mechanism that constantly monitors offices and, by fusing the Company’s specialized knowledge of the office environment with AI, conducts high-precision simulations, thereby quickly and continuously proposing what facilities, such as offices,s should be like to support the sustainable growth of companies. It has the potential to rapidly penetrate if results directly linked to customers’ productivity and creativity are produced.
There are three specific services announced this time.
• Facility Portfolio AI
An AI agent that calculates optimal area, number of seats, layout, and cost structure, and simulates the reorganization of locations. By presenting options for consolidating, dispersing, and reorganizing locations together with specific numerical values, it significantly shortens the time required to consider facility strategies and supports faster management decision-making.
• Workplace Insight AI
It analyzes diverse information, including unstructured data such as drawings, photos, questionnaires, and management policy materials, and extracts office issues and points for improvement. In addition, it automatically performs comparisons with similar cases, forecasts effects from improvements, and even calculates ROI, providing highly effective decision-making material for management and general affairs departments.
• Space Matching AI
Based on attendance information, behavioral tendencies, and usage history, it determines, in real time, which spaces are actually available and immediately guides users. Unused reservations are automatically released, and, through a mechanism that reallocates them according to demand, it reduces stress caused by shortages of meeting rooms and seats and improves space utilization rates.
In addition, the Company has declared that it will shift from “Tech×Design based on PEOPLE” to “AI×Design based on PEOPLE”. As something that indicates an acceleration of initiatives toward Office 3.0, attention to future developments is increasing.
【Evolution of solutions enabled by AI Agents】
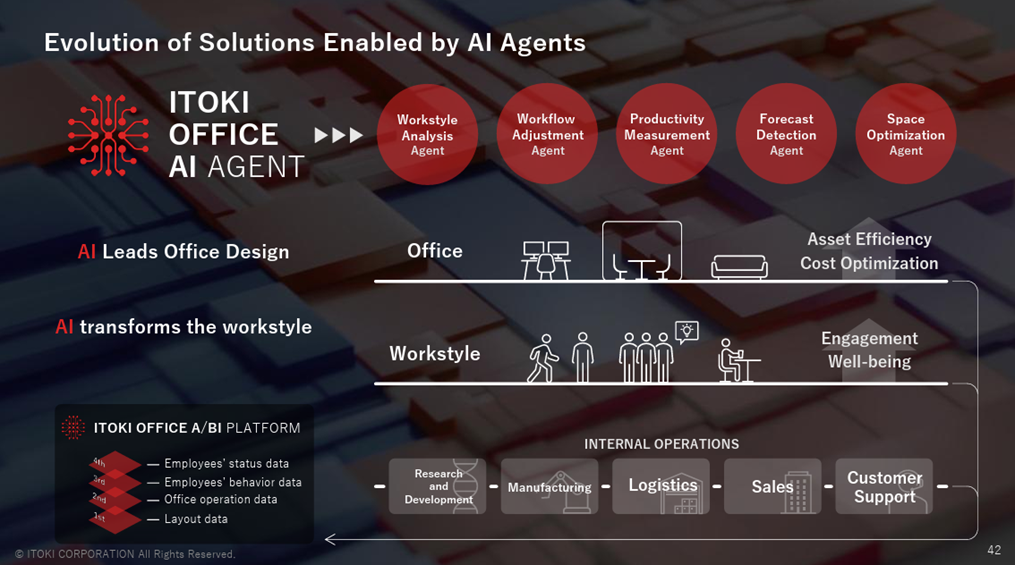
Source: Company material
◇ Direction for considering the next medium-term management plan
Formulation work for the next medium-term management plan, covering 2027–2029, is scheduled for 2026. The specific content is scheduled to be announced in February 2027, but its direction was presented alongside the announcement of these financial results. We would like to expect that more specific draft content will be communicated sequentially.
【Direction for discussing the next medium-term management plan】
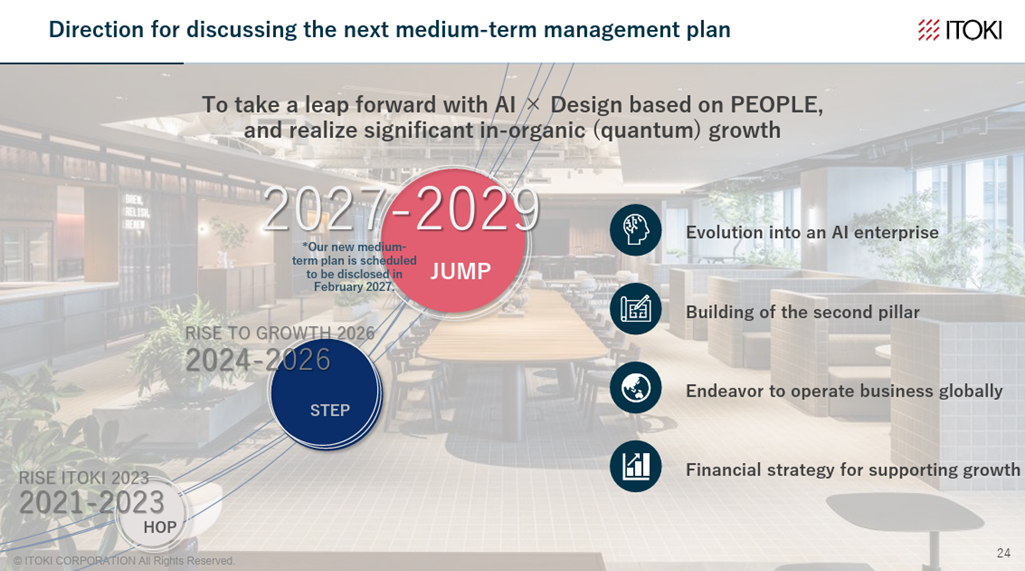
Source: Company material
◇ Governance strengthening
Governance strengthening is also progressing.
- Newly appointed two director candidates with expertise in the finance and governance domains
- Establishment of a voluntary Nomination Committee and Compensation Committee, chaired by an independent outside director and with a majority of independent outside directors
In addition, the president’s successor development plan systematically operates a two-tier pool by age.
◇ Results of strengthening IR activities
The Company’s proactive IR activities are also producing results and effects.
- At the WICI Japan Integrated Report Award 2025, first receiving the “Gold Award (Excellent Company Award),” and further, first receiving “The Best Gold Award.”
- At the IR Excellent Company Award 2025, first received the “IR Excellent Company Encouragement Award.”
- At the “Intellectual Property and Intangible Asset Governance Awards” selected by the Intellectual Property and Intangible Asset Governance Promotion Association, first receiving the Special Prize
- Placing a corporate advertisement in The Nikkei on the practice of human capital management
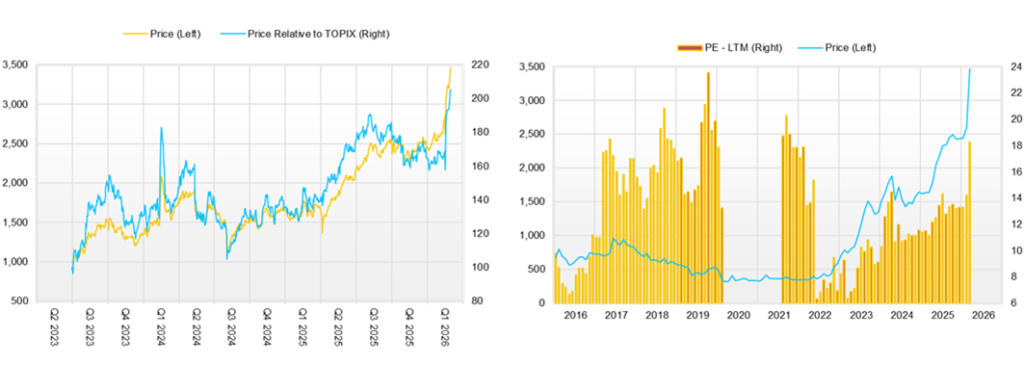
◇ Share price trends and future points of interest
The Company’s share price has been steadily rising since 2022, but after this financial results announcement (although it fell briefly immediately afterward), it has surged. It has risen 43%, from 2,440 yen at the end of 2025 to around 3,500 yen in about two months.
This share price trend should be seen as reflecting not only expectations for continued strong performance, but also expectations for the deployment of Office 3.0, increased added value through the utilization of AI, and the next medium-term management plan.
Based on these views, the points of interest for the time being are as follows.
- Performance in FY12/2026 does not fall below the company forecast.
- The services in the Office 3.0 domain gain greater customer support, and the picture becomes clearer of how they contribute to net sales and profit.
- The Company’s business strategy expands beyond office renewals to factories and research facilities.
- In the Equipment & Public Works-Related Business, special doors and maintenance services also expand.
- As a result of these, the expansion of the customer base and the growth of recurring revenue progress, and the Company moves to a stable growth track in the medium to long term.
- The equity spread expands further.
- Policies regarding overseas business and M&A are clearly indicated in the next medium-term management plan.
Company profile
Itoki Corporation (hereinafter, the “Company”) is an office furniture manufacturer that designs tomorrow’s “work.” Founded in 1890. In addition to manufacturing office furniture, it also engages in architecture, interior design, and the like. Since 2022, Koji Minato has served as president, and under his leadership, the transformation of the corporate constitution is progressing. The Company advocates office DX and Office 3.0 and aims to raise added value. In the three-year medium-term management plan “RISE TO GROWTH 2026,” whose final year is FY12/2026, under the theme of “enhancing sustainable growth,” it promotes the priority strategy “7 Flags” and ESG strategies, aiming to achieve net sales of 150.0 billion yen, operating profit of 14.0 billion yen, and ROE of 15% in FY12/2026, and it almost achieved this ahead of schedule in December 2025. Expectations are rising for further evolution of Office 3.0 and the next medium-term management plan.
Key financial data
| Unit: million yen | 2021 | 2022 | 2023 | 2024 | 2025 | 2026 CE |
| Sales | 115,905 | 123,324 | 132,985 | 138,460 | 153,682 | 167,500 |
| EBIT (Operating Income) | 2,561 | 4,582 | 8,524 | 10,078 | 13,686 | 16,000 |
| Pretax Income | 1,523 | 8,372 | 8,378 | 10,071 | 14,099 | |
| Net Profit Attributable to Owner of Parent | 1,166 | 5,294 | 5,905 | 7,183 | 9,382 | 11,200 |
| Cash & Short-Term Investments | 17,451 | 26,976 | 24,795 | 22,482 | 21,629 | |
| Total assets | 103,898 | 115,288 | 117,437 | 120,521 | 130,724 | |
| Total Debt | 20,091 | 19,487 | 17,308 | 37,924 | 34,627 | |
| Net Debt | 2,640 | -7,489 | -7,487 | 15,442 | 12,998 | |
| Total liabilities | 58,818 | 65,374 | 62,434 | 71,174 | 73,908 | |
| Total Shareholders’ Equity | 44,931 | 49,871 | 54,960 | 49,260 | 56,709 | |
| Net Operating Cash Flow | 2,774 | 5,804 | 6,321 | -1,000 | 8,942 | |
| Capital Expenditure | 2,110 | 4,145 | 3,316 | 6,036 | 6,017 | |
| Net Investing Cash Flow | -1,170 | 4,923 | -4,012 | -7,107 | -3,847 | |
| Net Financing Cash Flow | -2,658 | -1,426 | -4,148 | 5,905 | -5,941 | |
| Free Cash Flow | 664 | 1,659 | 3,005 | -4,146 | 5,193 | |
| ROA (%) | 1.12 | 4.83 | 5.08 | 6.04 | 7.47 | |
| ROE (%) | 2.63 | 11.17 | 11.27 | 13.79 | 17.71 | |
| EPS (Yen) | 25.8 | 117.0 | 130.3 | 147.0 | 190.2 | 226.7 |
| BPS (Yen) | 993.9 | 1,101.3 | 1,212.0 | 1,001.1 | 1,147.8 | |
| Dividend per Share (Yen) | 15.00 | 37.00 | 42.00 | 55.00 | 75.00 | 90.00 |
| Shares Outstanding (Million shares) | 45.66 | 45.66 | 45.66 | 53.38 | 53.38 |
Source: Omega Investment from company materials
Share price
Topics
【 Financial highlights 】
Source: Company material
【 Analysis of changes in operating profits 】
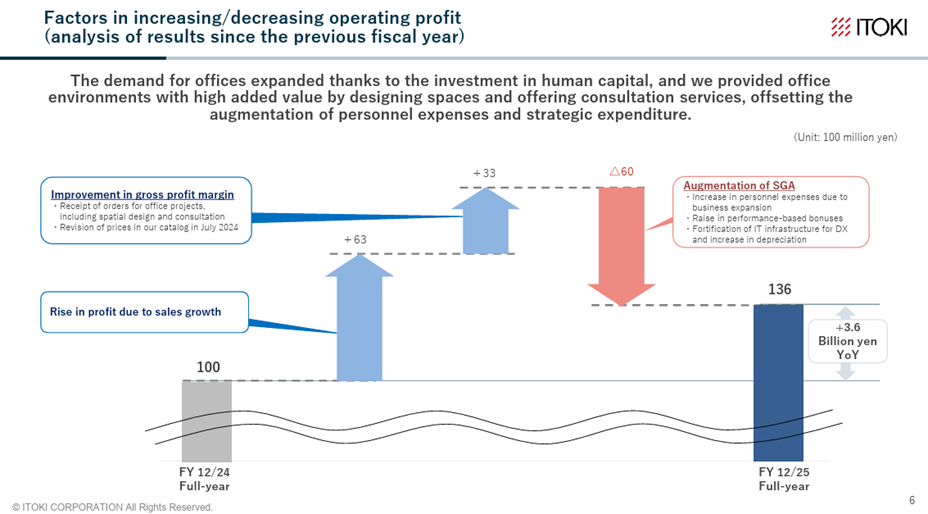
Source: Company material
Quarterly topics
【 Performance in each segment 】
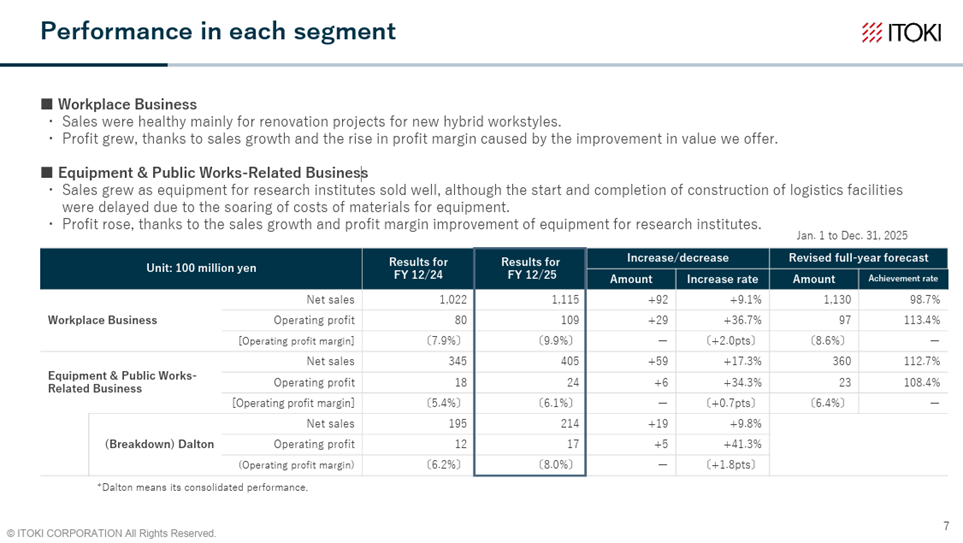
Source: Company material
【 Earnings forecast for FY ending December 2026 】
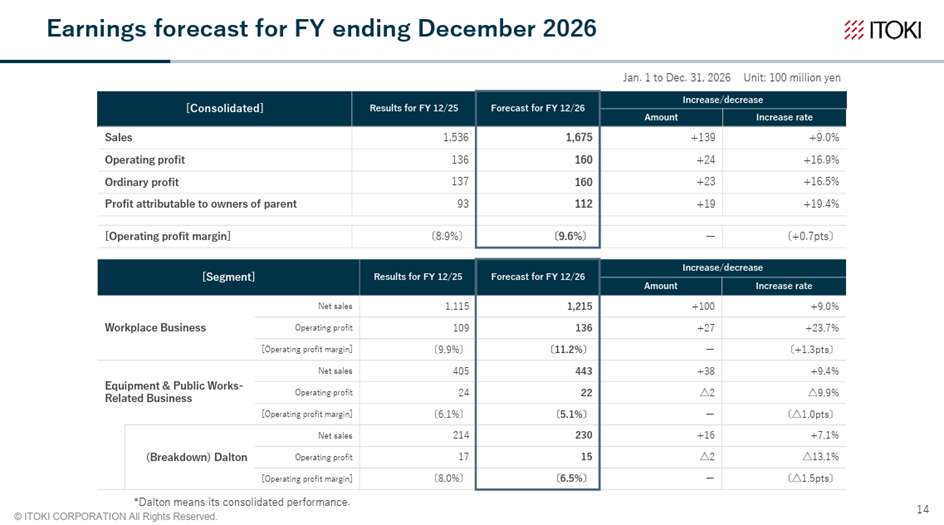
Source: Company material
【Situation of ongoing business talks】
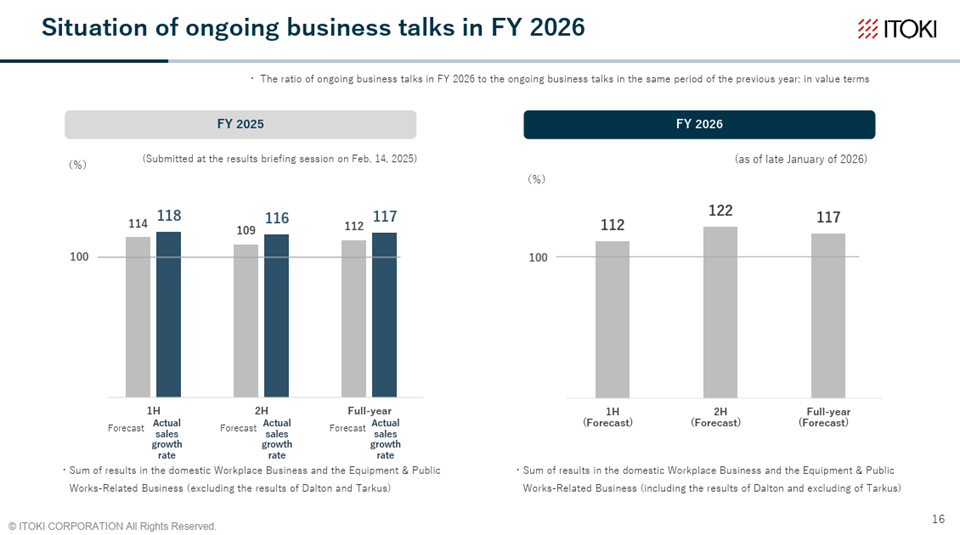
Source: Company material
【Return to shareholders】
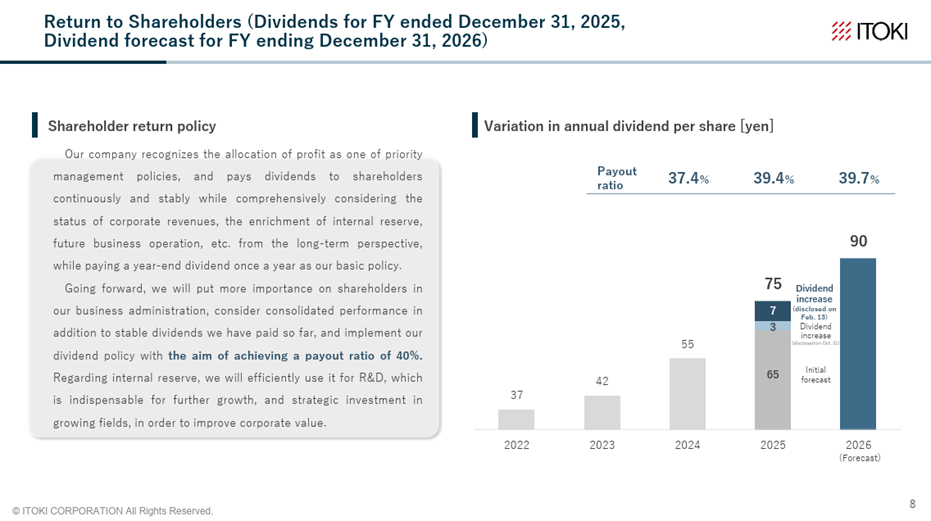
Source: Company material
【Initiatives for realizing business administration conscious of capital costs and share price】
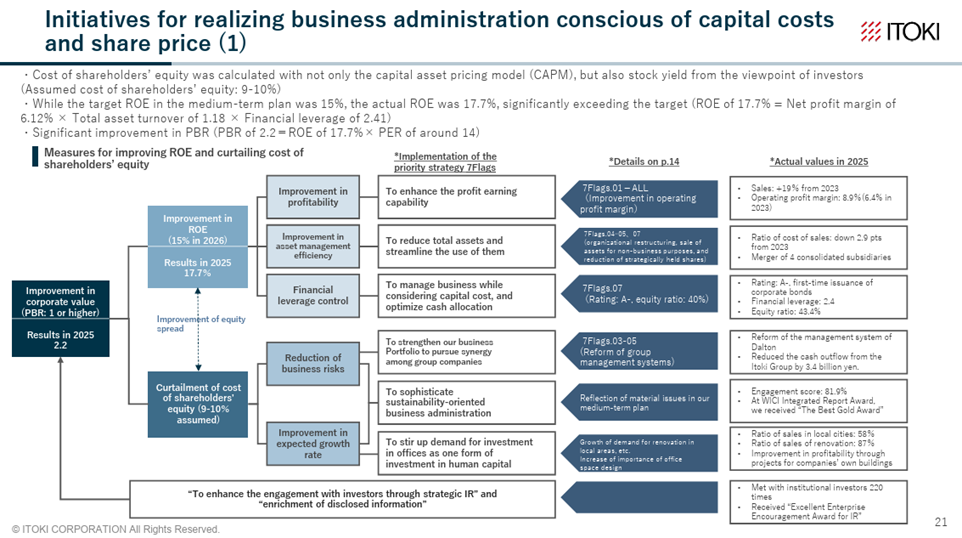
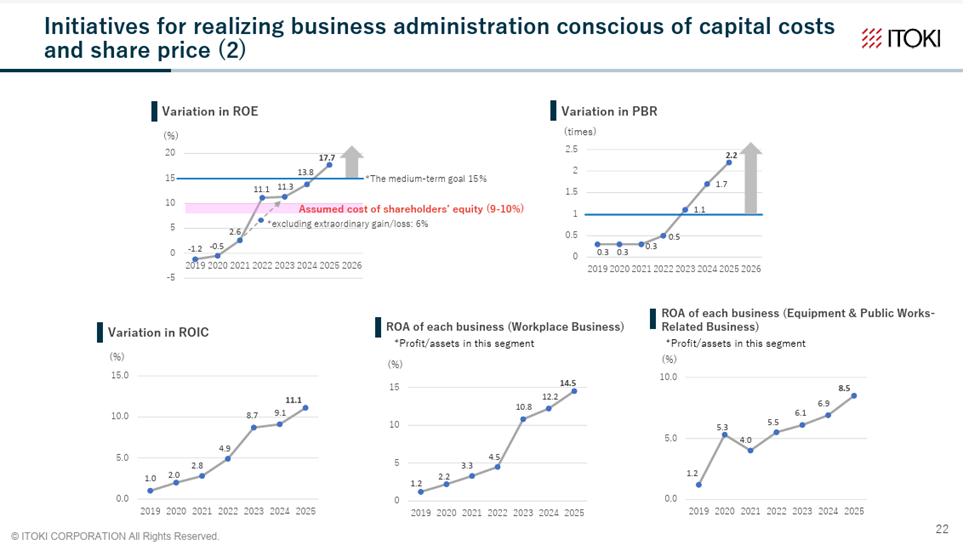
Source: Company material
Financial data (quarterly basis)
| Unit: million yen | 2023/12 | 2024/12 | 2025/12 | ||||||
| 4Q | 1Q | 2Q | 3Q | 4Q | 1Q | 2Q | 3Q | 4Q | |
| (Income Statement) | |||||||||
| Sales | 36,128 | 40,918 | 31,592 | 29,613 | 36,337 | 42,744 | 36,500 | 33,214 | 41,224 |
| Year-on-year | 8.3% | 10.7% | 1.2% | 3.3% | 0.6% | 4.5% | 15.5% | 12.2% | 13.4% |
| Cost of Goods Sold (COGS) | 22,090 | 24,545 | 19,888 | 17,644 | 21,182 | 23,993 | 21,381 | 19,671 | 23,825 |
| Gross Income | 14,038 | 16,373 | 11,704 | 11,969 | 15,155 | 18,751 | 15,119 | 13,543 | 17,399 |
| Gross Income Margin | 38.9% | 40.0% | 37.0% | 40.4% | 41.7% | 43.9% | 41.4% | 40.8% | 42.2% |
| SG&A Expense | 12,694 | 10,333 | 10,878 | 11,029 | 12,883 | 11,328 | 11,915 | 12,556 | 15,327 |
| EBIT (Operating Income) | 1,344 | 6,040 | 826 | 940 | 2,272 | 7,423 | 3,204 | 987 | 2,072 |
| Year-on-year | 171.5% | 26.4% | -62.8% | 428.1% | 69.0% | 22.9% | 287.9% | 5.0% | -8.8% |
| Operating Income Margin | 3.7% | 14.8% | 2.6% | 3.2% | 6.3% | 17.4% | 8.8% | 3.0% | 5.0% |
| EBITDA | 2,079 | 6,753 | 1,582 | 1,684 | 3,166 | 8,189 | 4,055 | 2,373 | 3,236 |
| Pretax Income | 936 | 6,006 | 1,328 | 1,035 | 1,702 | 7,257 | 3,208 | 1,132 | 2,502 |
| Consolidated Net Income | 997 | 4,104 | 985 | 725 | 1,409 | 4,910 | 2,045 | 711 | 1,734 |
| Minority Interest | 0 | 2 | 1 | 11 | 25 | -6 | 2 | 10 | 11 |
| Net Income ATOP | 996 | 4,101 | 985 | 714 | 1,383 | 4,916 | 2,044 | 699 | 1,723 |
| Year-on-year | -44.0% | 24.4% | -30.2% | 253.5% | 38.9% | 19.9% | 107.5% | -2.1% | 24.6% |
| Net Income Margin | 2.8% | 10.0% | 3.1% | 2.4% | 3.8% | 11.5% | 5.6% | 2.1% | 4.2% |
| (Balance Sheet) | |||||||||
| Cash & Short-Term Investments | 24,795 | 24,751 | 28,513 | 30,536 | 22,482 | 24,296 | 25,288 | 21,847 | 21,629 |
| Total assets | 117,437 | 127,459 | 120,701 | 120,935 | 120,521 | 132,329 | 126,248 | 123,538 | 130,724 |
| Total Debt | 17,308 | 38,662 | 41,566 | 42,881 | 37,924 | 44,114 | 41,268 | 37,467 | 34,627 |
| Net Debt | -7,487 | 13,911 | 13,053 | 12,345 | 15,442 | 19,818 | 15,980 | 15,620 | 12,998 |
| Total liabilities | 62,434 | 81,595 | 73,584 | 73,305 | 71,174 | 80,689 | 72,262 | 68,583 | 73,908 |
| Total Shareholders’ Equity | 54,960 | 45,818 | 47,068 | 47,571 | 49,260 | 51,562 | 53,908 | 54,864 | 56,709 |
| (Profitability %) | |||||||||
| ROA | 5.08 | 5.52 | 5.41 | 5.85 | 6.04 | 6.16 | 7.34 | 7.40 | 7.47 |
| ROE | 11.27 | 13.76 | 12.51 | 13.41 | 13.79 | 16.43 | 17.94 | 17.66 | 17.71 |
| (Per-share) Unit: JPY | |||||||||
| EPS | 22.0 | 85.7 | 20.0 | 14.5 | 28.1 | 99.9 | 41.4 | 14.1 | 34.8 |
| BPS | 1,212.0 | 933.1 | 956.6 | 966.8 | 1,001.1 | 1,047.9 | 1,091.1 | 1,110.4 | 1,147.8 |
| Dividend per Share | 42.00 | 0.00 | 0.00 | 0.00 | 55.00 | 0.00 | 0.00 | 0.00 | 75.00 |
| Shares Outstanding (million shares) | 45.66 | 53.38 | 53.38 | 53.38 | 53.38 | 53.38 | 53.38 | 53.38 | 53.38 |
Source: Omega Investment from company materials
Financial data (full-year basis)
| Unit: million yen | 2016/12 | 2017/12 | 2018/12 | 2019/12 | 2020/12 | 2021/12 | 2022/12 | 2023/12 | 2024/12 | 2025/12 |
| (Income Statement) | ||||||||||
| Sales | 101,684 | 108,684 | 118,700 | 122,174 | 116,210 | 115,905 | 123,324 | 132,985 | 138,460 | 153,682 |
| Year-on-year | -4.5% | 6.9% | 9.2% | 2.9% | -4.9% | -0.3% | 6.4% | 7.8% | 4.1% | 11.0% |
| Cost of Goods Sold | 65,071 | 70,012 | 77,479 | 80,712 | 74,536 | 74,186 | 77,575 | 80,744 | 83,259 | 88,870 |
| Gross Income | 36,613 | 38,672 | 41,221 | 41,462 | 41,674 | 41,719 | 45,749 | 52,241 | 55,201 | 64,812 |
| Gross Income Margin | 36.0% | 35.6% | 34.7% | 33.9% | 35.9% | 36.0% | 37.1% | 39.3% | 39.9% | 42.2% |
| SG&A Expense | 33,862 | 35,761 | 39,336 | 40,776 | 40,089 | 39,158 | 41,167 | 43,717 | 45,123 | 51,126 |
| EBIT (Operating Income) | 2,751 | 2,911 | 1,885 | 686 | 1,585 | 2,561 | 4,582 | 8,524 | 10,078 | 13,686 |
| Year-on-year | -33.6% | 5.8% | -35.2% | -63.6% | 131.0% | 61.6% | 78.9% | 86.0% | 18.2% | 35.8% |
| Operating Income Margin | 2.7% | 2.7% | 1.6% | 0.6% | 1.4% | 2.2% | 3.7% | 6.4% | 7.3% | 8.9% |
| EBITDA | 5,316 | 5,551 | 4,615 | 4,436 | 5,603 | 6,148 | 7,821 | 11,417 | 13,185 | 17,853 |
| Pretax Income | 2,918 | 3,401 | 3,083 | 938 | 1,277 | 1,523 | 8,372 | 8,378 | 10,071 | 14,099 |
| Consolidated Net Income | 1,850 | 2,442 | 1,744 | -579 | -355 | 933 | 5,181 | 5,907 | 7,223 | 9,400 |
| Minority Interest | -56 | 40 | 19 | -28 | -119 | -233 | -113 | 1 | 39 | 17 |
| Net Income ATOP | 1,907 | 2,402 | 1,725 | -550 | -235 | 1,166 | 5,294 | 5,905 | 7,183 | 9,382 |
| Year-on-year | -57.9% | 26.0% | -28.2% | -131.9% | -57.3% | -596.2% | 354.0% | 11.5% | 21.6% | 30.6% |
| Net Income Margin | 1.9% | 2.2% | 1.5% | -0.5% | -0.2% | 1.0% | 4.3% | 4.4% | 5.2% | 6.1% |
| (Balance Sheet) | ||||||||||
| Cash & Short-Term Investments | 19,839 | 19,977 | 16,529 | 17,030 | 18,246 | 17,451 | 26,976 | 24,795 | 22,482 | 21,629 |
| Total assets | 95,681 | 102,451 | 108,710 | 108,778 | 105,096 | 103,898 | 115,288 | 117,437 | 120,521 | 130,724 |
| Total Debt | 19,931 | 17,892 | 16,834 | 22,166 | 21,742 | 20,091 | 19,487 | 17,308 | 37,924 | 34,627 |
| Net Debt | 92 | -2,085 | 305 | 5,136 | 3,496 | 2,640 | -7,489 | -7,487 | 15,442 | 12,998 |
| Total liabilities | 50,275 | 54,997 | 61,200 | 62,940 | 60,901 | 58,818 | 65,374 | 62,434 | 71,174 | 73,908 |
| Total Shareholders’ Equity | 44,949 | 46,863 | 46,857 | 45,370 | 43,812 | 44,931 | 49,871 | 54,960 | 49,260 | 56,709 |
| (Cash Flow) | ||||||||||
| Net Operating Cash Flow | 5,072 | 3,565 | 1,384 | 3,586 | 4,561 | 2,774 | 5,804 | 6,321 | -1,000 | 8,942 |
| Capital Expenditure | 1,641 | 1,333 | 3,477 | 3,226 | 1,729 | 2,110 | 4,145 | 3,316 | 6,036 | 6,017 |
| Net Investing Cash Flow | -4,044 | -2,971 | -3,094 | -3,221 | -1,152 | -1,170 | 4,923 | -4,012 | -7,107 | -3,847 |
| Net Financing Cash Flow | -2,571 | -706 | -2,463 | 0 | -2,267 | -2,658 | -1,426 | -4,148 | 5,905 | -5,941 |
| Free Cash Flow | 3,663 | 2,342 | -1,924 | 635 | 2,832 | 664 | 1,659 | 3,005 | -4,146 | 5,193 |
| (Profitability ) | ||||||||||
| ROA (%) | 1.97 | 2.42 | 1.63 | -0.51 | -0.22 | 1.12 | 4.83 | 5.08 | 6.04 | 7.47 |
| ROE (%) | 4.21 | 5.23 | 3.68 | -1.19 | -0.53 | 2.63 | 11.17 | 11.27 | 13.79 | 17.71 |
| Net Margin (%) | 1.87 | 2.21 | 1.45 | -0.45 | -0.20 | 1.01 | 4.29 | 4.44 | 5.19 | 6.11 |
| Asset Turn | 1.05 | 1.10 | 1.12 | 1.12 | 1.09 | 1.11 | 1.13 | 1.14 | 1.16 | 1.22 |
| Assets/Equity | 2.14 | 2.16 | 2.25 | 2.36 | 2.40 | 2.36 | 2.31 | 2.22 | 2.28 | 2.37 |
| (Per-share) Unit: JPY | ||||||||||
| EPS | 40.1 | 52.7 | 37.8 | -12.1 | -5.2 | 25.8 | 117.0 | 130.3 | 147.0 | 190.2 |
| BPS | 986.8 | 1,028.9 | 1,027.4 | 995.8 | 970.4 | 993.9 | 1,101.3 | 1,212.0 | 1,001.1 | 1,147.8 |
| Dividend per Share | 13.00 | 13.00 | 13.00 | 13.00 | 13.00 | 15.00 | 37.00 | 42.00 | 55.00 | 75.00 |
| Shares Outstanding (million shares) | 52.14 | 52.14 | 45.61 | 45.66 | 45.66 | 45.66 | 45.66 | 45.66 | 53.38 | 53.38 |
Source: Omega Investment from company materials