2026-06-05
Home
Japanese

Omega Investment Co., Ltd.
f-code (Investment report – Basic report)
| Share price (6/8) | ¥1,422 | Dividend Yield (26/12 CE) | 0.0 % |
| 52weeks high/low | ¥1,330/2,985 | ROE(25/12) | 20.3 % |
| Avg Vol (3 month) | 126.3 thou shrs | Operating margin (TTM) | 19.4 % |
| Market Cap | ¥17.70 bn | Beta (5Y Monthly) | 1.45 |
| Enterprise Value | ¥23.53 bn | Shares Outstanding | 12.449 mn shrs |
| PER (26/12 CE) | 9.1 X | Listed market | TSE Growth |
| PBR (25/12 act) | 2.2 X |
| Click here for the PDF version of this page |
| PDF version |
A high-ROE growth stock mired in a low PER. We would like to actively build a position in phases where financial and intangible asset risks are overly priced in.
Investment conclusion
A high-ROE growth stock mired in a low PER. We would like to actively build a position in phases where financial and intangible asset risks are overly priced in.
f-Code Inc. (the Company) is a growth company that has expanded its digital marketing support, AI and Technology, and school and education domains through roll-up M&A and provides marketing, AI utilization support, and DX talent development in an integrated manner. In the previous Basic report, we evaluated the Company’s subscription-type SaaS, expansion of business domains through M&A, and high-ROE structure. We took a positive view of its medium- to long-term investment appeal. In the subsequent 4Q update, while earnings growth continued to be high, the PER declined significantly, and we revised our view to one in which we would like to actively build a position during phases of share price declines. Even after taking into account the 1Q FY12/2026 results this time, we maintain this investment view and believe the investment appeal in the low-PER phase has rather strengthened.
In 1Q FY12/2026, revenue was 3.90 billion yen and operating profit was 0.78 billion yen, expanding to approximately 1.6x and approximately 1.4x year on year, respectively. Progress against the full-year plan was 26.9% for revenue, 23.8% for operating profit, and 24.3% for quarterly profit attributable to owners of the parent. While making upfront investments to expand sales of mainstay products in the AI and Technology domain, the Company views progress in operating profit as within expectations, and the 1Q results do not increase concerns about the full-year plan. Rather, the Marketing and School domain showed high progress in both revenue and profit, and revenue in the AI and Technology domain is also expanding steadily. The low profit progress rate should be viewed in the context of business expansion accompanied by growth investment.
The current share price indicators are a forecast PER of 8.88x, a trailing PBR of 2.24x, a forecast ROE of 27.2%, a forecast EPS of 167.9 yen, and a forecast dividend of 0 yen. The share price based on forecast EPS is approximately 1,491 yen, and the BPS reverse-calculated from PBR is approximately 666 yen. When the long-term expected EPS growth rate priced in by the market at this level is estimated using a PBR model assuming a cost of equity of 12.5%, it remains at only around 0-1%. At a cost of equity of 12.0%, the embedded growth rate is almost zero. The actual and forecast EPS CAGR over the past five years is approximately 55% per annum, from EPS of 18.6 yen in FY12/2021 to forecast EPS of 155.6 yen in FY12/2026, and approximately 66% per annum if the adjusted EPS of 13.4 yen disclosed by the Company is used as the starting point. Of course, this high growth will not continue forever as it is, but the current share price reflects a substantial degree of expected growth deceleration.
The reason the Company’s shares are placed at an extremely low PER lies not in earnings themselves but in caution regarding accounting, finance, and liquidity associated with roll-up M&A. Specifically, goodwill, contingent consideration, net debt, the continuity of M&A, upfront investment in the AI and education domains, and liquidity constraints as a Growth Market stock are suppressing valuation multiples. In addition, we believe that the rapid expansion of business domains has made the Company’s earnings structure harder to understand, which is also one reason for the decline in PER.
However, in the latest explanatory materials, the Company explains in considerable detail the financing, investment, and growth cycle for continuing M&A. During the three years after listing, it conducted two public offerings. It achieved a profit growth rate of more than 100%, but going forward, it is shifting to a policy of targeting profit growth of more than 50%, centered on debt financing backed by segment profits rather than equity financing. The Company presented a financing cycle comprising borrowings, investment execution such as M&A, profit expansion, and enhancement of corporate value, and put forward a growth model that does not depend on equity financing. This is a practical response to market concerns about share dilution.
Furthermore, the Company explains the reproducibility of growth using an index model with operating profit set at 100. Against an operating profit of 100, after-tax net profit of around 60 is accumulated as equity, and 240, equivalent to four times the incremental equity of 60, is regarded as capacity for debt financing and M&A investment. The payback period for past M&A has been within five years, and even after deducting increments in head office expenses and interest expenses, the design is to target an operating profit of 150 or more in the current fiscal year, or a profit growth rate of 50% or more, assuming existing business growth of around 15%. What is important here is not simply an increase in the number of M&A deals, but that operating profit, after-tax profit, equity, borrowing capacity, investment recovery, and reinvestment are connected as a single financial model.
Regarding goodwill, the Company does not simply present the figures on the balance sheet as they are; it explains the breakdown by separating fixed from unfixed goodwill. In the consolidated balance sheet as of 1Q FY12/2026, total assets were 31.6 billion yen, total equity was 7.7 billion yen, total liabilities were 23.9 billion yen, and goodwill was 15.8 billion yen. Of this, fixed goodwill was 10.6 billion yen and unfixed goodwill was 5.2 billion yen. Unfixed goodwill represents additional transfer consideration that arises when the target subsidiary’s performance grows significantly and is characterized by the absence of any payment obligation if performance does not grow. For the fixed goodwill of 10.6 billion yen, the Company expects recovery in approximately 3.2 years, based on the forecast annual EBITDA level of approximately 3.3 billion yen for the current fiscal year, consistent with its M&A investment criterion of recovery within five years.
This explanation does not eliminate all intangible asset risks that the equity market is concerned about. As long as the Company continues with M&A, caution regarding goodwill, contingent consideration, impairment assessments, and financial leverage will remain warranted. However, the Company is beginning to disclose M&A not as an external driver of growth but as a capital allocation model premised on profit creation. The explanatory power regarding finance and intangible assets, which was an issue at the time of the 4Q update, has improved further in the latest materials. Going forward, the continuity of explanation and the actual build-up of operating profit, FCF, and ROIC will be key to a PER re-rating.
In line with our investment view, while taking liquidity constraints into account, we would like to actively build a position in low-PER phases following share price declines. In the short term, the share price is likely to fluctuate due to accounting treatment related to M&A, upfront investment in the AI and Technology domain, and changes in net debt. On the other hand, over an investment period of one to two years, if achievement of the FY12/2026 plan, profit contribution from additional M&A, profit contribution from AI Comp., and the school business, and continued disclosure regarding goodwill and contingent consideration are confirmed, share price appreciation through an uplift in PER and PBR can be targeted. Over the medium-to-long-term, three to four years, how closely the Company can come to the FCODE plan 2027 operating profit target of 5.0 billion yen will be central to equity value formation.
1. Company overview and business characteristics
A roll-up marketing tech company that bundles Marketing and School with AI and Technology, and supports corporate DX implementation.
Founded in 2006, the Company operates businesses in digital marketing, CX improvement, Web customer service, SaaS, AI utilization support, system and application development, and school and education domains. The Company’s mission is to “Create a better world with Marketing Technology,” and it has expanded its business as an execution-support corporate group that improves corporate digital touchpoints and enhances sales, LTV, and operational efficiency, rather than merely as an advertising operation company or SaaS vendor.
The Company’s business domains consist of two pillars: the Marketing and School domain and the AI and Technology domain. The Marketing and School domain includes marketing SaaS, data analytics, SNS marketing, marketer matching, AI marketing, LTV marketing, online schools, and sales support. It is a domain that covers customer companies’ digital touchpoints, supports the maximization of marketing results, and forms the earnings base of the Company group.
Meanwhile, the AI and Technology domain is responsible for generative AI engineering, AI reskilling, system engineering services, site production, system and application development, product planning and development, infrastructure construction, and CMS implementation. It is a domain that provides high-quality AI and technology services for corporate DX and advanced digitalization and is positioned as a growth driver that will affect future growth rates and valuation multiples. From FY12/2026, the Company reorganized the former Marketing domain as the Marketing and School domain, explicitly positioning school and education as revenue drivers.
The Company’s value proposition lies not in selling a single service, but in combining functions accumulated within the group across marketing, AI, system development, education, talent development, and sales support, and supporting customer companies’ problem-solving end-to-end. What differentiates the Company from advertising agencies and consulting firms is that it deeply engages in the execution phase, including not only strategy formulation but also web production, application development, SNS operations, AI implementation, education and training, sales support, and LTV improvement. By using issues in customer companies’ digital touchpoints as an entry point and bundling multiple services for provision, the Company aims to raise customer unit prices and expand recurring transactions.
As of May 2026, the Company group consisted of 19 companies and approximately 900 officers and employees. Group companies include f-Code itself, which handles digital consulting and CX improvement SaaS; SAKIYOMI, which provides SNS marketing support; CRAFT, which provides advertising operation and digital marketing support; BINKS, which provides data science and LTV marketing support; BUZZ, which operates an SNS school business; Deitora, which operates a digital skills school; Real us, which provides schools for women and influencer support; Buist, which operates a video production school; En place, which provides MEO and marketing support for physical stores; AI ONE, which operates a generative AI school; ONE, which operates a commerce school; and Roombox, which provides marketing support for the real estate industry. In the AI and Technology domain, the Company has under its umbrella Microwave Creative, which provides website construction and creative production; JITT; Ragnarok, which provides product development support and DX support; Ciel Zero, which provides IT consulting and SES; SmartContract, which provides sales support and AI implementation support; and SpinFlow, which provides generative AI utilization consulting and education and training.
The Company’s business strategy, as seen in this group structure, is a roll-up expansion that starts with digital marketing and broadens its scope into AI, education, system development, physical-store marketing, and real estate. Its feature is that it does not stop at expanding the sales scale through acquisitions of individual companies, but also aims simultaneously at sales growth and management efficiency through cross-selling, integrated sales, sharing of sales channels, joint product development, joint purchasing, and back-office integration. This is the core of the Company’s investment story, and the success or failure of M&A should be judged not by the number of acquisitions but by the post-acquisition buildup of profits, sharing of customers, integration of management functions, and mutual growth with existing businesses.
Specific intra-group synergies are also beginning to emerge. AI Comp, a generative AI tool developed by SpinFlow, is sold by SmartContact and has acquired more than 1,000 IDs per month. This is an increase from the pace of 300 IDs per month in the previous quarter and can be viewed as the result of combining the sales capability for generative AI tools with sales operations for SMBs. In addition, AI ONE provides consulting and operational support for customer acquisition and customer success at Buist’s video editing school, leading to increased sales. Furthermore, examples have been presented in which CRAFT expanded its support areas to improve results for existing clients, resulting in a budget increase of more than 10 million yen per month. These examples indicate that the Company’s roll-up is not merely a build-up of consolidated sales, but a model that raises customer unit prices and profits through service collaboration within the group.
The school business is also becoming more important within the Company’s growth model. In the school business being developed through roll-ups, the cumulative number of students has exceeded 40,000, and courses within the group have been certified under the Ministry of Health, Labor and Welfare’s Specialized Practical Education and Training Benefit. The fields offered are wide-ranging, including engineering, web production, AI fundamentals and practice, web design, video production and editing, SNS operation, e-commerce, e-commerce platform operation, web marketing, and corporate sales. The school’s business not only generates tuition revenue on a standalone basis but also drives increased orders for Marketing, AI, and Technology services for corporations, where the shortage of DX talent is pronounced. The ability to connect the talent and know-how developed in the education domain to corporate DX support represents a unique opportunity for expansion within the Company group.
The customer base is also broad. The Company supports more than 2,500 corporate customers through ongoing transactions and has a track record of providing education support to more than 40,000 individuals cumulatively. Corporate customers span a wide range of industries, including finance, manufacturing, retail, services, restaurants, e-commerce, and education, and the structure is designed so that the Company addresses each company’s digital issues while limiting excessive dependence on any single industry or customer. By providing marketing support to corporate customers and to schools for individuals and corporations, the Company has touchpoints with both the demand side and the talent supply side.
In future business development, the combination of horizontal expansion and vertical expansion will be important. In horizontal expansion, the Company provides functions such as marketing, AI, Technology, education, and sales support across industries. Meanwhile, in vertical expansion, in addition to the school and education domain, a model to go deep into the real estate industry has begun, with the participation of Roombox. Roombox operates an SNS and marketing support business specialized in the real estate industry, and has know-how that has generated more than 2,000 inquiries per month through its self-operated SNS. Its strength is a high profit margin through a performance-based revenue model, and collaboration with the Company group’s SNS support, marketing support, and AI utilization support is expected.
In this way, the Company is transitioning from a single-product company originating in CX improvement SaaS to a composite DX implementation company that bundles Marketing and School with AI and Technology. What is important for investors is not the breadth of business domains itself, but how that breadth connects to profit margins, ROIC, FCF, customer unit prices, and the post-M&A payback period. At present, multiple growth drivers, including intra-group collaboration, expansion of the school business, and an increase in AI Comp. IDs and vertical expansion into the real estate domain are beginning to move simultaneously, and the Company’s business content has become even more multi-layered than at the time of the previous Basic report.
2. Recent 1Q results and full-year progress
Revenue is steady, and operating profit is progressing within expectations after factoring in upfront investment.
In 1Q FY12/2026, revenue was 3,904 million yen, operating profit was 785 million yen, profit before tax was 742 million yen, and quarterly profit attributable to owners of the parent was 460 million yen. Year on year, revenue increased by 61.6%, operating profit by 38.6%, profit before tax by 38.9%, and quarterly profit attributable to owners of the parent by 43.7%. High growth continues in both revenue and profit.
The full-year plan is revenue of 14,500 million yen, operating profit of 3,300 million yen, profit before tax of 3,000 million yen, and profit attributable to owners of the parent of 1,900 million yen. Progress as of 1Q is 26.9% for revenue, 23.8% for operating profit, 24.7% for profit before tax, and 24.3% for profit attributable to owners of the parent. Revenue is at a sufficient level for quarterly progress. Although operating profit appears somewhat low, as it reflects upfront investment to expand sales of mainstay products in the AI and Technology domain, it is within the Company’s expectations.
By domain, 1Q revenue in the Marketing and School domain was 2,297 million yen, representing 29.4% of the full-year forecast of 7,820 million yen. Segment profit was 650 million yen, and progress against the full-year forecast of 2,400 million yen was 27.1%. This domain has made a strong start in both earnings stability and profit growth. Meanwhile, 1Q revenue in the AI and Technology domain was 1,695 million yen, progress against the full-year forecast of 6,680 million yen was 25.4%, segment profit was 317 million yen, and progress against the full-year forecast of 1,650 million yen was 19.3%. Revenue progress is steady, but on the profit side, the color of upfront investment remains.
The point to confirm in this 1Q is that the Company is accelerating investment in talent, products, and M&A while maintaining high growth. While upfront investment may restrain operating profit margin in the short term, we want to confirm whether profit contribution builds from 2Q onward through sales scale expansion in the AI and Technology domain and an increase in AI Comp. IDs, an increase in students in the school business, and progress in PMI at M&A target companies.
3. Long-term earnings trend
High growth, with sales expected to increase approximately 22x and operating profit approximately 21x over five years. However, the equity market applies a strong discount to its sustainability.
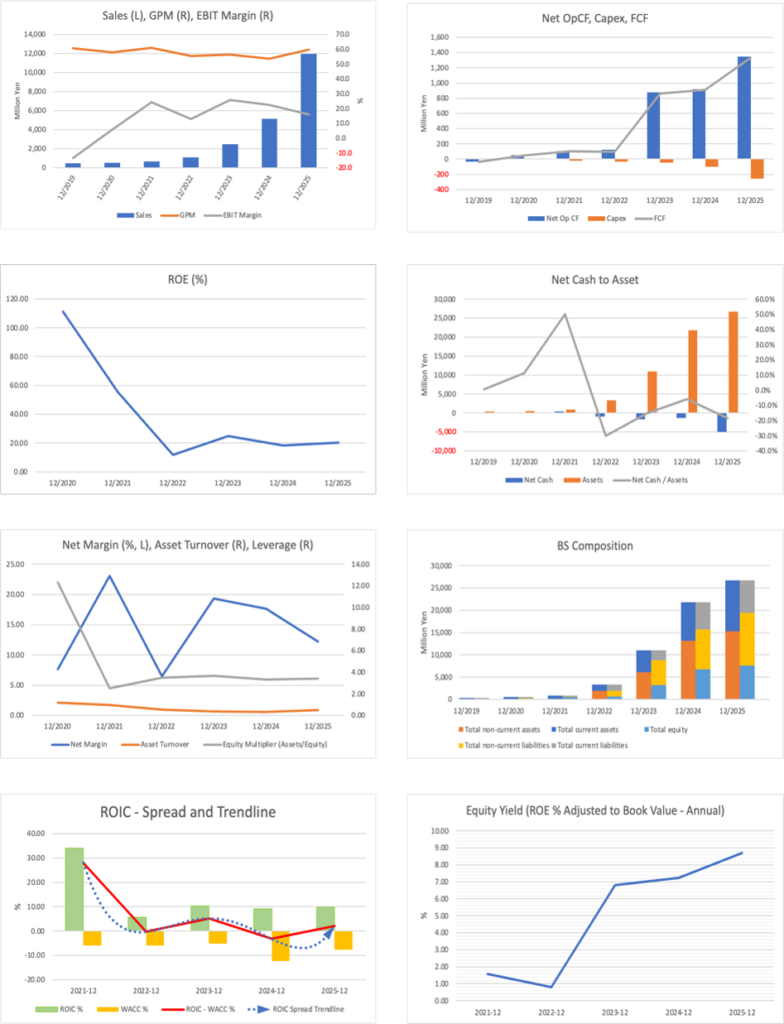
The Company’s long-term earnings have expanded rapidly in the short period since listing. Revenue expanded from 660 million yen in FY12/2021 to 11,937 million yen in FY12/2025, and the Company forecasts 14,500 million yen for FY12/2026. Operating profit will expand from 160 million yen in FY12/2021 to 2,277 million yen in FY12/2025, and to 3,300 million yen in the FY12/2026 forecast. The Company expects growth over the five years since listing of approximately 22x in revenue, approximately 21x in operating profit, and approximately 11x in EPS.
This growth is not the natural growth of a single product, but the result of overlapping growth in existing businesses, M&A, PMI, cross-selling, and expansion into the AI and education domains. Through FY12/2025, M&A contributions and growth in existing businesses pushed up growth. In FY12/2026, the Company plans operating profit growth of +45.1% through growth in existing businesses and expansion of cross-selling and synergies. The Company states that the performance of AI ONE, whose shares were acquired on February 24, and the impact of M&A executed after that date or to be executed in the future are not factored into the current full-year forecast, and profit contribution from additional M&A will be an upside factor.
On the other hand, the equity market is not straightforwardly evaluating this growth. A forecast PER of 8.88x is not a multiple typically assigned to a high-ROE, high-growth company. What the market is cautious about is not the high growth rate itself, but the quality of that growth, dependence on M&A, goodwill, contingent consideration, financial leverage, and liquidity. Therefore, in future share price formation, in addition to growth in revenue and operating profit, net debt, the effective equity ratio, the recoverability of goodwill, and post-M&A profit improvement will be important confirmation items.
Regarding our past forecasts and judgments on the Company, while we evaluated the high-growth premium of the share price in the previous Basic report, in the subsequent phase of share price declines, the market priced in M&A, intangible asset, and financial risks more strongly. Similarly, at the time of the previous Basic report, the PER was in the 20x range and the PBR in the 4x range, reflecting a valuation premised on continued growth. However, the PER has now declined to the single-digit range despite earnings growth. Therefore, while the bullish view itself in the previous Basic report was not wrong, we underestimated the importance of explanatory power regarding intangible assets and finance in share price valuation. We will revise this point honestly and, in this Basic report, add explanatory power regarding the financial model, goodwill, and contingent consideration to the valuation axes, assigning them the same weight as growth potential.
4. Growth strategy and key KPIs
Combining horizontal expansion and vertical expansion, and viewing M&A profit build-up and intra-group synergies as KPIs.
The Company’s growth strategy can be organized along two axes: horizontal expansion across solution domains and vertical expansion that deepens development within specific industries. Horizontal expansion increases the range of solutions that can be provided across industries, such as marketing, AI, Technology, schools, and sales support. In vertical expansion, in addition to the school and education domain, it is strengthening a model of expanding into the real estate industry and deeply entering specific industries through the participation of Roombox.
In 1Q FY12/2026, the Company executed three M&A deals with an investment of approximately 1.4 billion yen and expects an operating profit build-up of approximately 0.6 billion yen on a full-year basis. In addition, after entering 2Q, it announced the acquisition of Roombox and expects a total investment of approximately 0.43 billion yen, an assumed annual operating profit of approximately 0.06 billion yen, and an assumed investment recovery period of approximately five years. Roombox operates an SNS and marketing support business specializing in the real estate industry and has know-how that has generated more than 2,000 inquiries per month through its self-operated SNS. Its strength is a high profit margin through a performance-based revenue model, and synergies with marketing support companies and SNS support companies within the Company group are expected.
The key KPIs investors should look at are, first, not the number of M&A deals but the post-M&A build-up in operating profit. The Company conducts M&A investments based on a recovery criterion of within five years and notes that the payback period for past M&A has been within five years. Second is the segment profit margin of the Marketing and School domain and the AI and Technology domain. In addition to sales growth, it is important when upfront investment in the AI and Technology domain turns into profit margin improvement. Third is concrete results from cross-selling. The Company indicates that SmartContact sells AI Comp, SpinFlow’s generative AI tool, and has acquired more than 1,000 IDs per month. That budget expansion of more than 10 million yen per month is progressing with support from CRAFT for existing clients. We would like to confirm whether this intra-group collaboration shifts from one-off cases to a continuous revenue model.
Upside factors include the full-year contribution from additional M&A and an increase in AI Comp. IDs, an increase in students in the school business, vertical expansion into the real estate domain starting with Roombox, and cross-selling to existing customers. Downside factors are the time lag until upfront investment in the AI and Technology domain becomes profitable, underperformance by M&A target companies, goodwill impairment, remeasurement of contingent consideration, an increase in net debt, and liquidity constraints. In subsequent financial results, we would like to monitor segment profit margins by domain, full-year-equivalent M&A profit contribution, net debt, the effective equity ratio, the breakdown of goodwill, the number of IDs for AI-related products, the number of school students, and the monetary scale of cross-selling cases.
5. Financial model, goodwill, and capital efficiency
The borrowings-led growth model is reasonable, but continuous explanation is necessary for share price valuation.
Over the three years following listing, the Company conducted two public offerings and achieved a profit growth rate exceeding 100%. Going forward, it estimates that profit growth of around 50% is possible through debt financing backed by segment profit, without depending on equity financing. The financing, investment, and growth cycle explained by the Company involves circulating financing through borrowings, executing investments such as M&A, pursuing profit expansion, and enhancing corporate value. It represents a shift from a model that utilizes equity financing immediately after listing to a borrowings-led model that builds up profit and equity.
This point is important from the perspective of equity investment. At the time of the previous Basic report, the evaluation centered on growth potential, but the current market is sensitive to dilution, borrowings, goodwill, and contingent consideration. Therefore, the Company’s indication of a policy to secure growth funds through borrowings rather than equity financing, and to build equity through profit growth, is a factor that eases dilution concerns behind the decline in PER.
In the Company’s index model, if operating profit is set at 100, after-tax net profit of around 60 is accumulated as equity. The Company assumes that, using four times this incremental equity of 60 as a guide, 240 of debt financing and M&A investment is possible. The payback period for past M&A has been within five years. The Company states that, even after deducting increments in head office expenses and interest expenses, it is possible to target an operating profit of 150 or more in the current fiscal year and a profit growth rate of 50% or more, assuming existing business growth of around 15%. This presents operating profit, after-tax profit, equity, borrowing capacity, M&A investment, post-acquisition profit, and reinvestment as one continuous model.
Of course, there are assumptions that this model relies on. First, operating profit in existing businesses must continue to increase. Second, M&A target companies must be profitable, and profits must be maintained and expanded after acquisition. Third, the discipline of a payback period within five years must be maintained. Fourth, there must be a profit margin sufficient to absorb increases in interest rates and head office costs. Fifth, through post-acquisition PMI, cross-selling, integrated sales, joint purchasing, and back-office integration must actually translate into profit. The Company has assigned specialist personnel to M&A, PMI and value-up, human resources and general affairs, finance and accounting, and internal control, and positions this structure as the execution platform for the growth model.
Regarding goodwill, the Company explains the appearance on the balance sheet separately from the substance. In the consolidated balance sheet as of 1Q FY12/2026, total assets were 31.6 billion yen, total liabilities were 23.9 billion yen, total equity was 7.7 billion yen, and goodwill was 15.8 billion yen. This goodwill of 15.8 billion yen comprises fixed goodwill of 10.6 billion yen and unfixed goodwill of 5.2 billion yen. Fixed goodwill is the portion corresponding to consideration paid and fixed at the time of M&A execution. Meanwhile, unfixed goodwill is an estimate of additional transfer consideration that arises when the target company’s performance grows significantly and is characterized by a payment obligation that disappears if performance does not grow. Under IFRS accounting, these unfixed estimated payment amounts are also recorded as goodwill, so looking only at the total amount of goodwill on the balance sheet tends to make it appear larger than the actual amount of the investment paid.
For the fixed goodwill of 10.6 billion yen, the Company expects recovery in approximately 3.2 years, based on the forecast annual EBITDA of approximately 3.3 billion yen for the current fiscal year. This is consistent with the Company’s five-year recovery period, which it sets as a criterion for M&A investment. For investors, what matters is not only the headline amount of total goodwill of 15.8 billion yen, but also the breakdown between the fixed and unfixed portions, the number of years required to recover the fixed portion through EBITDA, and the extent to which the unfixed portion will involve future payments.
The Company also explains the effective equity ratio that takes into account the nature of contingent consideration. It has recorded other financial liabilities of 5.7 billion yen as consideration payable only if performance grows significantly, and the ratio of equity attributable to owners of the parent in the earnings release is 25.3%. Meanwhile, the effective equity ratio calculated by deducting this 5.7 billion yen is 30.8%. This view reflects that the additional consideration is linked to performance and is not always paid in full as a fixed debt. From the equity market’s perspective, we would like to consider not only the normal equity ratio of 25.3% but also the effective equity ratio of 30.8%, net debt, operating cash flow, and EBITDA together.
According to the ROIC/Net Cash materials reviewed this time, the Company‘s net debt was approximately 5.44 billion yen most recently, and the LTM ROIC based on FactSet was 9.8%. This is nearly the same as the ROIC of 9.8% at the time of the previous update, and it is better to view ROIC somewhat more conservatively than the approximately 11% reported by the Company. However, an ROIC of 9.8% remains high for a roll-up company on the Growth Market and is a positive indicator that investment returns exceed the cost of capital, while continuing borrowings-led M&A.
The Company explains that it is generating business returns that significantly exceed its financing cost of 4.8%. The borrowing rate is estimated at an average of 1.40% based on interest expenses and the average borrowing balance in FY12/2025, and the cost of debt is kept low. The Company’s estimated WACC is 4.8%; even if the borrowing rate and cost of debt double to 2.80%, the WACC is estimated at 5.8%. Even using the FactSet-based ROIC of 9.8%, a spread against the Company’s estimated WACC remains. Therefore, at this point, we do not view M&A using borrowings as impairing shareholder value.
However, investors’ required return may be estimated at a higher level than the WACC indicated by the Company. In light of the Growth Market, liquidity constraints, the complexity of M&A, the lack of dividends, and competition in the AI and education domains, the equity market demands a higher risk premium. Therefore, simply maintaining an ROIC of 9.8% is not sufficient; consistent improvement in operating profit, EBITDA, operating cash flow, FCF, goodwill recovery, and net debt management is necessary for a recovery in share price valuation.
6. Shareholder distribution
Founder-led stability and liquidity constraints coexist. An increase in external institutional investors will be a clue to re-evaluation.
According to FactSet Ownership data, the Company’s identifiable shareholders hold approximately 69.3% of the shares outstanding, and the free float ratio is 42.9%. The largest shareholder is President and Representative Director Tsutomu Kudo, with a 38.5% ownership stake. The fact that the founder holds a large stake works positively for commitment to long-term corporate value creation, consistency in management decisions, including M&A, and reduced susceptibility to short-term market pressure. Meanwhile, because the number of shares in circulation is limited, institutional investors find it difficult to take large positions, and the share price tends to fluctuate significantly around catalyst announcements and earnings releases.
Among external shareholders, Ascender Capital Limited holds 5.3%, Asset Management One holds 4.0%, Mynavi holds 3.2%, and Future holds 3.1%. The new Ascender Capital holding and the holdings of Tokio Marine Asset Management, Rheos, Dimensional-affiliated funds, and others indicate that interest in the Company’s low PER, high ROE, and sustained growth is also spreading among external investors. Meanwhile, thin liquidity tends to create price impact for both buyers and sellers. Therefore, we would like to position the Company’s shares not as a stock to acquire in large amounts at once, but as a stock to build over time through phases of share price declines and increases in trading volume.
To organize the advantages and disadvantages of the shareholder distribution, the positive aspects are the long-term perspective under founder-led management, continuity of the M&A strategy, and the presence of stable shareholders. The negative aspects are liquidity constraints, limits on inclusion by institutional investors, and volatility driven by short-term supply and demand dynamics. Going forward, if the Company improves disclosure quality, enhances liquidity, and continues to consider a transition to the Prime Market, a broadening of the shareholder base may lead to an uplift in share price valuation multiples.
7. Share price trends and valuation
Earnings are growing, but the share price reaction is weak. The market is focusing more strongly on M&A, finance, and intangible asset risks than on growth potential.
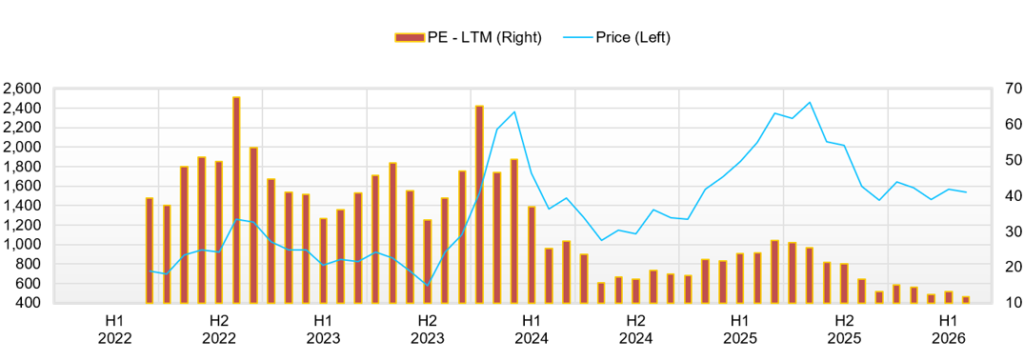
After rising significantly on the back of high growth expectations following its listing, the Company’s share price has fluctuated sharply amid accelerated M&A activity, equity financing, goodwill and contingent consideration write-downs, net debt, and valuation adjustments across growth stocks. From 2023 to the first half of 2024, earnings expansion through M&A, expectations for SaaS and AI-related businesses, and a sharp increase in operating profit pushed up the share price. Thereafter, from the second half of 2024 through 2025, earnings grew, but the share price corrected from its high range. The background includes the view that profit growth depends on M&A activity, increases in intangible assets, the accounting treatment of contingent consideration, and caution regarding the equity ratio and net debt.
Even more recently, strong results and M&A announcements have generated short-term buying, but they have not readily led to a sustained rise in valuation. This is not because the Company’s growth is being denied, but because the market demands both the sustainability of growth and explanatory power regarding finance and intangible assets. The reason the share price reaction is weak despite strong earnings is that even though EPS, the denominator of PER, has increased, PER itself has contracted. In other words, share price stagnation is due not to insufficient profit but to a decline in valuation multiples.
Looking at the current indicators of a forecast PER of 8.88x, a trailing PBR of 2.24x, a forecast ROE of 27.2%, forecast EPS of 155.6 yen, and a forecast dividend of 0 yen, the share price factors in growth expectations quite conservatively. Assuming a cost of equity of 12.5% in the PBR model, the long-term growth rate indicated by the current PBR of 2.24x and ROE of 27.2% is only approximately 0.6%. At a cost of equity of 12.0%, the embedded growth rate is almost zero. Given that the EPS CAGR over the past five years exceeds 50% and that the Company has set an operating profit target of 5.0 billion yen for FY12/2027, the current market valuation can be described as a level that strongly discounts not only growth deceleration but also M&A, intangible assets, and financial risks.
Our fair share price estimates based on the three methods are as follows. The assumptions used were forecast EPS of 155.6 yen, reverse-calculated BPS of approximately 666 yen, net debt of approximately 5.44 billion yen, shares outstanding of approximately 12.4 million shares, a cost of equity of 12.0-12.5%, stepwise growth in FCF and a terminal growth rate of 2% for the DCF method, and FactSet-based LTM ROIC of 9.8% for the ROIC method.
Under the PBR method, for an ROE of 27.2%, taking into account goodwill, leverage, and liquidity, we set the fair PBR at 2.2-3.2x, with a median of 2.7x. The fair share price range is approximately 1,460-2,130 yen, and the median is approximately 1,800 yen. Compared with the current share price of approximately 1,491 yen, there is approximately 21% upside on a median basis.
Under the DCF method, based on FCF for FY12/2025, we factored in profit growth from 2026 onward, the effects of M&A, and an improvement in the FCF conversion rate, and estimated the value using a WACC of 8-10% and a terminal growth rate of 2%. The fair share price range is approximately 2,350-4,000 yen, and the median is approximately 3,260 yen. DCF is sensitive to continued growth and FCF improvement, indicating significant upside potential relative to the current share price. However, because this range assumes post-M&A FCF generation and leverage management, we do not expect the equity market to price it in immediately.
Under the ROIC method, assuming a FactSet-based LTM ROIC of 9.8%, the Company’s estimated financing cost, and net debt of approximately 5.44 billion yen, we set the fair share price range at approximately 1,300-2,050 yen, with a median of approximately 1,650 yen. Because we adopted a more conservative figure than the ROIC of approximately 11% based on the Company’s explanatory materials used in the previous report, the median under the ROIC method declines somewhat. However, compared with the current share price, the upside remains greater than the downside, and even under the ROIC method, we do not view the current share price as overvalued.
On a simple average of the three methods, the fair share price range is approximately 1,700-2,730 yen, and the median is approximately 2,240 yen. Compared with the current share price of approximately 1,491 yen, this represents approximately +50% upside potential on a median basis. However, because the median under the DCF method is high, while the PBR method converges around 1,800 yen and the ROIC method around 1,650 yen, in practice we would assume a phased share price formation: first a recovery toward the 1,650-1,800 yen range, then a re-evaluation to the 2,200 yen range accompanied by a retreat of concerns regarding finance and intangible assets, and further movement closer to DCF-based valuation in a phase where the certainty of achieving FCODE plan 2027 increases.
8. Risks and monitoring items
Rather than growth deceleration, we want to be alert to a decline in valuation multiples caused by insufficient market understanding.
The Company’s risks are, first, post-M&A PMI. If the growth rate, profit margin, management control, internal control, and talent retention at acquired companies do not progress as assumed, the buildup in operating profit will slow. Second are goodwill and contingent consideration. Under IFRS, fair value measurement of contingent consideration and goodwill impairment may cause profit and loss to fluctuate, destabilizing investors’ views. Third are net debt and interest rates. The borrowings-led growth model is reasonable for avoiding dilution, but concerns about financial flexibility are likely to emerge when interest rates rise or performance falls short of expectations. Fourth is competition in the AI and education markets. Generative AI utilization support, AI reskilling, and online schools are growth markets, but the number of entrants is also large, and unit prices, continuation rates, and differentiation will be tested. Fifth is liquidity constraints. Large institutional investors find it difficult to enter in size, and there are phases where the share price rise does not continue even when catalysts emerge.
Items to confirm in subsequent financial results are full-year progress in revenue and operating profit, segment profit margins by domain, profit margin improvement in the AI and Technology domain, stable growth in the Marketing and School domain, full-year-equivalent operating profit contribution from M&A, progress in PMI for new M&A including Roombox, and the number of AI Comp. IDs, the number of school students, budget expansion through cross-selling, net debt, the effective equity ratio, the breakdown of goodwill, changes in contingent consideration, operating cash flow, and FCF.
In terms of the share price, when PER falls below 10x, the discount to growth expectations can be considered widened. The current forecast PER of 8.88x meets that condition. Therefore, it is reasonable to consider building a position in phases of share price declines, and if profit progress and financial explanatory power are confirmed in subsequent financial results, to decide to increase the ownership ratio.
9. Equity investment conclusion
The reason for the low valuation is understandable, but the current PER does not adequately reflect the high ROE and growth track record. We maintain an active stance.
The Company is transitioning from a rapid growth phase to an expansion phase. The investment story of SaaS, M&A, and high ROE that we evaluated in the previous Basic report has now evolved into Marketing and School, AI and Technology, an M&A financial model, and high ROE. While the breadth of growth has expanded, the equity market has become somewhat complex to understand, and this complexity is one reason for the decline in PER.
The latest 1Q results do not weaken our investment view. Revenue is progressing steadily, and operating profit is also progressing in line with expectations after accounting for upfront investment. M&A is also continuing, with three deals in 1Q and the acquisition of Roombox executed after entering 2Q. The Company has strengthened its explanations regarding goodwill, the effective equity ratio, the borrowings-led growth model, M&A target markets, and group governance, and the reduction of uncertainty that was identified as an issue in the 4Q update is progressing.
Meanwhile, the share price remains at a forecast PER of 8.88x, which is quite a low valuation given a forecast ROE of 27.2%. The growth rate priced in by the market, as seen through the PBR model, is close to zero and is overly cautious relative to the EPS CAGR over the past five years and the FY12/2026 plan. In our fair share price estimates using the three methods, the median under the PBR method is approximately 1,800 yen, the median under the ROIC method is approximately 1,650 yen, the median under the DCF method is approximately 3,260 yen, and the median of the three-method average is approximately 2,240 yen. Compared with the current share price, there is room for recovery at least to the 1,650-1,800 yen range, and if accompanied by disclosure and earnings progress, room for re-evaluation to around 2,200 yen.
Therefore, our investment view is to actively build a position in low-PER phases and increase the ownership ratio, while confirming the explanatory power of finance, intangible assets, and profit progress. In the short term, the share price is likely to fluctuate due to accounting factors and M&A-related disclosure. However, the current share price substantially reflects a deceleration in growth and financial risk. If strong performance, net debt management, the recoverability of goodwill, and profit contribution from the AI and education domains are confirmed, an uplift in PER and PBR can be expected. In a medium- to long-term portfolio, while accounting for liquidity, we judge this to be a stock worth including as a growth engine.
Key stock price data
Key financial data
| Unit: million yen | 2021 | 2022 | 2023 | 2024 | 2025 | 2026 CE |
| Sales | 661 | 1,072 | 2,482 | 5,131 | 11,938 | 14,500 |
| EBIT (Operating Income) | 160 | 138 | 638 | 1,149 | 1,902 | |
| Pretax Income | 150 | 124 | 605 | 1,323 | 2,115 | 3,000 |
| Net Profit Attributable to Owner of Parent | 152 | 69 | 480 | 906 | 1,452 | 1,900 |
| Cash & Short-Term Investments | 602 | 978 | 4,040 | 6,236 | 8,086 | |
| Total assets | 843 | 3,281 | 10,975 | 21,825 | 26,741 | |
| Total Debt | 178 | 1,961 | 5,721 | 7,527 | 13,041 | |
| Net Debt | -424 | 983 | 1,681 | 1,291 | 4,955 | |
| Total liabilities | 351 | 2,592 | 7,655 | 15,720 | 19,975 | |
| Total Shareholders’ Equity | 492 | 690 | 3,187 | 6,728 | 7,545 | |
| Net Operating Cash Flow | 103 | 121 | 878 | 916 | 1,347 | |
| Capital Expenditure | 24 | 35 | 46 | 99 | 255 | |
| Net Investing Cash Flow | -16 | -1,441 | -3,404 | -2,881 | -4,460 | |
| Net Financing Cash Flow | 189 | 1,695 | 5,586 | 4,158 | 4,932 | |
| Free Cash Flow | 100 | 97 | 860 | 911 | 1,334 | |
| ROA (%) | 22.37 | 3.36 | 6.73 | 5.52 | 5.98 | |
| ROE (%) | 55.52 | 11.74 | 24.75 | 18.27 | 20.34 | |
| EPS (Yen) | 18.6 | 8.4 | 23.2 | 77.9 | 118.6 | 155.6 |
| BPS (Yen) | 60.0 | 83.2 | 302.2 | 548.8 | 618.0 | |
| Dividend per Share (Yen) | 0.00 | 0.00 | 0.00 | 0.00 | 0.00 | 0.00 |
| Shares Outstanding (Million shares) | 8.20 | 8.29 | 10.55 | 12.17 | 12.41 |
Source: Calculated by Omega Investment based on FactSet’s standard criteria, rounded to the nearest whole number.
Share price
Financial data (quarterly basis)
| Unit: million yen | 2024/12 | 2025/12 | 2026/12 | ||||||
| 1Q | 2Q | 3Q | 4Q | 1Q | 2Q | 3Q | 4Q | 1Q | |
| (Income Statement) | |||||||||
| Sales | 1,035 | 1,002 | 1,040 | 2,053 | 2,417 | 2,796 | 3,190 | 3,535 | 3,904 |
| Year-on-year | 168.7% | 109.3% | 45.2% | 127.7% | 133.4% | 178.9% | 206.7% | 72.2% | 61.6% |
| Cost of Goods Sold (COGS) | 401 | 482 | 475 | 1,083 | 851 | 1,261 | 1,319 | 1,600 | 1,605 |
| Gross Income | 635 | 520 | 565 | 970 | 1,565 | 1,535 | 1,871 | 1,935 | 2,299 |
| Gross Income Margin | 61.3% | 51.9% | 54.3% | 47.3% | 64.8% | 54.9% | 58.7% | 54.7% | 58.9% |
| SG&A Expense | 320 | 310 | 278 | 737 | 1,148 | 1,093 | 1,318 | 1,463 | 1,711 |
| EBIT | 315 | 210 | 287 | 233 | 417 | 442 | 553 | 471 | 588 |
| Year-on-year | 181.1% | 91.6% | 53.3% | 1.7% | 32.6% | 110.3% | 92.6% | 102.1% | 41.0% |
| Operating Income Margin | 30.4% | 21.0% | 27.6% | 11.4% | 17.3% | 15.8% | 17.3% | 13.3% | 15.1% |
| EBITDA | 356 | 257 | 333 | 292 | 460 | 484 | 600 | 558 | 642 |
| Pretax Income | 296 | 255 | 319 | 350 | 534 | 553 | 587 | 422 | 742 |
| Consolidated Net Income | 191 | 164 | 206 | 306 | 348 | 357 | 381 | 413 | 482 |
| Minority Interest | 8 | 4 | 2 | 15 | 28 | 36 | -8 | -2 | 21 |
| Net Income ATOP | 183 | 160 | 204 | 291 | 321 | 322 | 389 | 415 | 461 |
| Year-on-year | 144.6% | 153.9% | 41.4% | 47.2% | 75.4% | 100.5% | 91.1% | 42.5% | 43.7% |
| Net Income Margin | 17.7% | 16.0% | 19.6% | 14.2% | 13.3% | 11.5% | 12.2% | 11.7% | 11.8% |
| (Balance Sheet) | |||||||||
| Cash & Short-Term Investments | 4,937 | 7,233 | 7,021 | 6,236 | 4,969 | 7,206 | 7,867 | 8,086 | 8,353 |
| Total assets | 14,588 | 17,973 | 17,629 | 21,785 | 24,553 | 25,838 | 28,652 | 26,452 | 31,662 |
| Total Debt | 8,430 | 8,484 | 7,988 | 7,527 | 9,155 | 11,104 | 13,312 | 13,041 | 13,791 |
| Net Debt | 3,493 | 1,251 | 967 | 1,291 | 4,187 | 3,898 | 5,446 | 4,955 | 5,438 |
| Total liabilities | 10,980 | 12,424 | 11,803 | 15,748 | 18,607 | 19,755 | 22,294 | 19,712 | 23,947 |
| Total Shareholders’ Equity | 3,408 | 5,988 | 6,277 | 6,660 | 6,619 | 6,741 | 7,134 | 7,543 | 7,993 |
| (Profitability %) | |||||||||
| ROA | 5.94 | 5.45 | 5.29 | 5.12 | 4.99 | 5.19 | 5.72 | 6.00 | 5.64 |
| ROE | 19.01 | 15.58 | 16.09 | 17.02 | 19.46 | 17.86 | 19.73 | 20.36 | 21.71 |
| (Per-share) Unit: JPY | |||||||||
| EPS | 17.3 | 13.2 | 16.8 | 23.7 | 26.0 | 26.3 | 31.9 | 34.0 | 37.7 |
| BPS | 282.1 | 494.5 | 518.3 | 543.3 | 536.8 | 552.5 | 584.3 | 617.9 | 653.1 |
| Dividend per Share | 0.00 | 0.00 | 0.00 | 0.00 | 0.00 | 0.00 | 0.00 | 0.00 | 0.00 |
| Shares Outstanding(million shares) | 10.61 | 12.11 | 12.11 | 12.17 | 12.35 | 12.40 | 12.41 | 12.41 | 12.41 |
Source: Calculated by Omega Investment based on FactSet’s standard criteria, rounded to the nearest whole number.
Financial data (full-year basis)
| Unit: million yen | 2021/12 | 2022/12 | 2023/12 | 2024/12 | 2025/12 |
| (Income Statement) | |||||
| Sales | 661 | 1,072 | 2,482 | 5,131 | 11,938 |
| Year-on-year | 24.3% | 62.3% | 131.5% | 106.7% | 132.7% |
| Cost of Goods Sold | 258 | 479 | 1,084 | 2,379 | 4,813 |
| Gross Income | 403 | 593 | 1,398 | 2,752 | 7,125 |
| Gross Income Margin | 61.0% | 55.3% | 56.3% | 53.6% | 59.7% |
| SG&A Expense | 242 | 455 | 759 | 1,603 | 5,223 |
| EBIT (Operating Income) | 160 | 138 | 638 | 1,149 | 1,902 |
| Year-on-year | 407.6% | -13.9% | 362.0% | 80.0% | 65.5% |
| Operating Income Margin | 24.3% | 12.9% | 25.7% | 22.4% | 15.9% |
| EBITDA | 164 | 172 | 711 | 1,238 | 2,113 |
| Pretax Income | 150 | 124 | 605 | 1,323 | 2,115 |
| Consolidated Net Income | 152 | 69 | 479 | 934 | 1,505 |
| Minority Interest | 0 | 0 | 0 | 28 | 54 |
| Net Income ATOP | 152 | 69 | 480 | 906 | 1,452 |
| Year-on-year | 275.3% | -54.5% | 591.7% | 88.8% | 60.3% |
| Net Income Margin | 23.1% | 6.5% | 19.3% | 17.7% | 12.2% |
| (Balance Sheet) | |||||
| Cash & Short-Term Investments | 602 | 978 | 4,040 | 6,236 | 8,086 |
| Total assets | 843 | 3,281 | 10,975 | 21,825 | 26,741 |
| Total Debt | 178 | 1,961 | 5,721 | 7,527 | 13,041 |
| Net Debt | -424 | 983 | 1,681 | 1,291 | 4,955 |
| Total liabilities | 351 | 2,592 | 7,655 | 15,720 | 19,975 |
| Total Shareholders’ Equity | 492 | 690 | 3,187 | 6,728 | 7,545 |
| (Cash Flow) | |||||
| Net Operating Cash Flow | 103 | 121 | 878 | 916 | 1,347 |
| Capital Expenditure | 24 | 35 | 46 | 99 | 255 |
| Net Investing Cash Flow | -16 | -1,441 | -3,404 | -2,881 | -4,460 |
| Net Financing Cash Flow | 189 | 1,695 | 5,586 | 4,158 | 4,932 |
| Free Cash Flow | 100 | 97 | 860 | 911 | 1,334 |
| (Profitability ) | |||||
| ROA (%) | 22.37 | 3.36 | 6.73 | 5.52 | 5.98 |
| ROE (%) | 55.52 | 11.74 | 24.75 | 18.27 | 20.34 |
| Net Margin (%) | 23.06 | 6.47 | 19.33 | 17.65 | 12.16 |
| Asset Turn | 0.97 | 0.52 | 0.35 | 0.31 | 0.49 |
| Assets/Equity | 2.48 | 3.49 | 3.68 | 3.31 | 3.40 |
| (Per-share) Unit: JPY | |||||
| EPS | 18.6 | 8.4 | 23.2 | 77.9 | 118.6 |
| BPS | 60.0 | 83.2 | 302.2 | 548.8 | 618.0 |
| Dividend per Share | 0.00 | 0.00 | 0.00 | 0.00 | 0.00 |
| Shares Outstanding (million shares) | 8.20 | 8.29 | 10.55 | 12.17 | 12.41 |
Source: Calculated by Omega Investment based on FactSet’s standard criteria, rounded to the nearest whole number.