Sansei Landic (Company Note)

| Share price (10/4) | ¥817 | PER (21/12CE) | 13.5 |
| 52weeks high/low | ¥908/722 | PBR (20/12act) | 0.67 倍 |
| ADVT (¥ mn, monthly) | ¥10 mn | ROE (20/12act) | 3.6% |
| Mkt cap. | ¥6.9 bn | DY (21/12 CE) | 3.06% |
| Shrs out. | 8.474 mn, shrs | Shr eqty ratio(21/3) | 54.8% |
| Listed market | TSE 1st section | Foreign shareholding ratio | 3.00% |
| Click here for the PDF version of this page |
| 3277SL20211005EN |
Pioneer of real estate rights adjustment business
High ROE and stable growth in niche markets
Points of interest
Sansei Landic has strengths in the real estate rights adjustment business and is expanding nationwide. Real estate rights adjustment is a niche market and is difficult for big companies to enter, meaning opportunities of stable earnings for Sansei Landic over the long term. It has delivered ROE of 10% or more for the past few years, and the stock price looks undervalued. Although the company’s business was significantly affected by COVID-19 in FY2020/12, it is already recovering. The medium-term business plan will be announced soon.
Summary
- Sansei Landic is a real estate sales company that has a strong edge in adjusting real estate rights business. The company is engaged in “Real Estate Sales” , which deals with land with leasehold rights and old unutilised properties (old condominiums with tenants, etc.) and ”Construction”, which provides custom-built housing and renovation.
- Leasehold land: In this business, the company adjusts intertwined rights to increase the value of properties, which are undervalued because the old land lease law protects the rights of the landlords. The company either purchases land from the landowner and sells it to the building owner or purchases the ownership of the building, thereby eliminating the unfavorable conditions of both the landowner and the building owner if the land is left unchanged. Land rights adjustment requires complicated adjustments, so experience and know-how are critically important. It is a business that other companies cannot enter with ease.
- Old unutilised properties: A business that adjusts the rights of old condominiums with residents and redevelops them. It is different from the likes of restaurant transfers with all the furniture and stocks. The company buys the property, negotiates with the resident, which are difficult for the original owner to do, and finds a relocation destination for the residents if necessary. After the relocation, vacant land will be sold. This business requires special experience and unique know-how as in the leasehold land business.
- Construction business: Through the subsidiary One’s Life Home, the company provides custom-built houses and renovation work by high-quality designer architects. One’s Life Home differentiates itself with its designing excellence, but Sansei Landic is considering a merger with it as it is a little too small.
- Medium-term business plan: The company will announce a new medium-term business plan in the fall of 2021. Although the contents are not known yet, it should be meaningful for investors to know where the company will head for.
- Recent earnings trends: In Q2 FY2021/12, sales were ¥9.1bn (up 9.0% YoY), operating profit was about ¥700mn (up 74.3%), and net income was ¥400mn (up 120.8%). All these results were above the management’s forecasts. The Real Estate Sales business was ¥8.6bn (up 15.8%) in sales. Among its subsegments, Leasehold Land was ¥4.7bn (up 102.8%) and Old Unutilised Properties was ¥3.4bn (up 11.9%). Sales of Construction business decreased to ¥500mn (down 45.4%). In Q2 FY2020/12, sales activities were significantly affected by COVID-19. Current sales are recovering as non-face-to-face sales are progressing. Business is running ahead of the company forecasts, and upward revisions look likely.
- Stock price: After the result announcement of FY2020/12, the stock price rose driven by the expectations on recovery from COVID-19 and the announcement of share buyback. Afterwards, the stock price reacted positively to the expectation on the to-be-announced medium-term business plan, going through some price adjustments. The company’s ROE is good averaging 11% over the long term, but the shares have been priced below PBR of 1 x. The upcoming announcement of the medium-term business plan may trigger revaluation of the shares. Please see our Investment View for more thoughts on stock price.
Table of contents
Key financial data
|
Fiscal Year |
2015/12 |
2016/12 |
2017/12 |
2018/12 |
2019/12 |
2020/12 |
Q2 2021/12 |
|
Net sales |
|||||||
|
Real estate sales business |
10,241 |
10,959 |
11,969 |
16,050 |
16,267 |
16,112 |
8,605 |
|
Construction business |
1,327 |
1,341 |
1,130 |
784 |
1,753 |
1,663 |
503 |
|
Total net sales |
11,568 |
12,300 |
13,099 |
16,833 |
18,020 |
17,775 |
9,109 |
|
Cost of sales |
3,769 |
3,957 |
4,532 |
4,805 |
5,119 |
3,986 |
6,777 |
|
Gross profit |
3,769 |
3,957 |
4,532 |
4,805 |
5,119 |
3,986 |
2,331 |
|
SG&A expenses |
2,470 |
2,510 |
2,770 |
3,039 |
3,258 |
3,139 |
1,642 |
|
Operating income |
1,300 |
1,446 |
1,762 |
1,766 |
1,861 |
847 |
689 |
|
Ordinary income |
1,196 |
1,329 |
1,669 |
1,643 |
1,759 |
709 |
631 |
|
Net income |
724 |
854 |
1,111 |
1,007 |
1,159 |
358 |
402 |
|
Current assets |
10,366 |
9,749 |
15,874 |
15,745 |
18,095 |
19,040 |
17,371 |
|
Cash and deposits |
2,253 |
2,435 |
3,558 |
3,594 |
4,133 |
4,329 |
4,281 |
|
Property for sale |
7,699 |
6,877 |
11,863 |
11,678 |
13,493 |
14,424 |
12,586 |
|
Total assets |
11,398 |
10,833 |
16,916 |
16,777 |
19,294 |
20,071 |
18,425 |
|
Total net assets |
6,034 |
6,856 |
8,006 |
8,908 |
9,895 |
10,067 |
10,093 |
|
Equity ratio (%) |
52.9 |
63.3 |
47.3 |
53.1 |
51.3 |
50.2 |
54.8 |
|
Cash flow from |
(1,451) |
1,611 |
(3,666) |
1,617 |
(420) |
(917) |
2,110 |
|
Cash flow from |
(116) |
(184) |
107 |
(64) |
(71) |
(288) |
(26) |
|
Cash flow from |
1,588 |
(1,278) |
4,667 |
(1,495) |
984 |
953 |
(2,129) |
|
Increase/decrease in |
21 |
149 |
1,108 |
58 |
493 |
(251) |
(46) |
Unit: ¥mn
Source: Omega Investment from company materials
Company profile
Sansei Landic has strengths in real estate transactions that require complicated adjustment of rights. It is engaged in ”Real Estate Sales” business centering on leasehold land and old unutilised properties. Through its subsidiary One’s Life Home Co., Ltd., the company operates “Construction” business for custom-built housing and renovation.
The company started to deal with leasehold land in June 1991. Although local real estate companies occasionally handle leasehold land and old unutilised properties, Sansei Landic is the only company that has continued to expand this business nationwide. The company is estimated to hold the top market share in this business. Headquartered in Chiyoda-ku, Tokyo, the company has seven branches in Sapporo, Sendai, Musashino, Nagoya, Kyoto, Kansai, and Fukuoka. It also has two affiliated companies, One’s Life Home Co., Ltd. and Sansei Landic Funding Co., Ltd.
The company’s sales in FY2020/12 were ¥17.7bn. Real Estate Sales business comprises 90.6% of sales and Construction business accounts for 9.4%. Nine-year CAGR of the overall sales from FY2010/12 to FY2019/12, excluding FY2020/12 which suffered COVID-19 infection, is 10.4% and that of the operating profit is 12.3%. So, the company has been achieving faster growth than the real estate industry, whose growth is stable.
Breakdown of sales by business

Sales and operating profit

History
The company was founded in 1976 and has a history of 45 years. Founder Katsumi Ozawa established Sansei Service, Co. Ltd. in Tokyo to do the real estate brokerage business. Mr. Ozawa paid attention to the leasehold land business as it is not easily affected by economic fluctuations, unlike the general real estate industry, which is easily affected by economic fluctuations and the lending regulations of governments and/or financial institutions. In 1991, the company started handling leasehold land and has expanded nationwide as the only real estate company specializing in this business. In 2005, the company established One’s Life Home Co., Ltd. and entered the construction business. After going public in JASDAQ in December 2011, the company’s listing market changed to the Second Section of the Tokyo Stock Exchange in January 2014. In December of the same year, the stock was designated as the First Section of the Tokyo Stock Exchange.
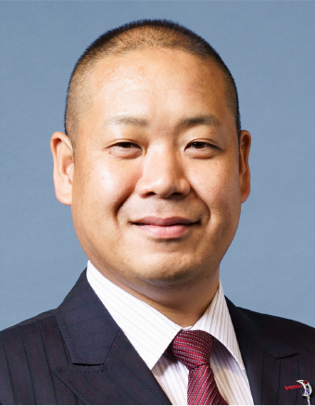
Mr. Takashi Matsuzaki, the current president and CEO, joined the company in May 1993 and took over the presidency from Mr. Ozawa in July 2003. He has been leading the company’s growth since then.
The company is considering a merger with One’s Life Home to improve the efficiency of the Construction business.
| Month/Year | Event |
|---|---|
| Feb. 1976 | Established Sansei Service Co., Ltd. (currently Sansei Landic Co., Ltd.) for the purpose of brokering real estate sales, leasing condominiums, apartments, buildings, etc. |
| Mar. 1976 | Obtained a residential land and building transaction business license (Governor of Tokyo (1) No. 30441) |
| Mar. 1987 | Changed the trade name to Sansei Co., Ltd. (currently Sansei Landic Co., Ltd.) |
| Jun. 1991 | Started handling Leasehold land |
| Aug. 1993 | Established Sansei Housing Sales Co., Ltd. (consolidated subsidiary Sansei Community Co., Ltd.) for the purpose of real estate sales and brokerage business. |
| Feb. 1997 | Changed trade name to Sansei Landic Co., Ltd. |
| Jan. 2002 | Made Sansei Community Co., Ltd. a wholly owned subsidiary |
| Apr. 2002 | Established Osaka branch (currently Kansai branch) and Sapporo branch |
| May 2002 | Changed the residential land and building transaction business license to the Minister of Land, Infrastructure, Transport and Tourism license (Minister of Land, Infrastructure, Transport and Tourism (1) No. 6292) |
| Aug. 2004 | Established Fukuoka branch |
| Mar. 2005 | Established One’s Life Home Co., Ltd. (currently a consolidated subsidiary) and started the construction business for selling houses. |
| Dec. 2007 | Established Nagoya Sales Office (currently Nagoya Branch) |
| Jan. 2008 | Started “Owners Partner”, a land management business |
| Dec. 2009 | Made One’s Life Home Co., Ltd. a wholly owned subsidiary |
| Mar. 2011 | Established Yokohama branch |
| Dec. 2011 | Listed on the Osaka Securities Exchange JASDAQ (Standard) |
| Jul. 2013 | Made Sansei Community Co., Ltd. a wholly owned subsidiary |
| Jan. 2014 | Market change to the second section of the Tokyo Stock Exchange |
| Dec. 2014 | Designated as a stock on the First Section of the Tokyo Stock Exchange |
| Jan. 2015 | Established Sendai branch |
| Jul. 2018 | Established Kyoto branch |
| Oct. 2019 | Established Sansei Landic Funding Co., Ltd. (currently a consolidated subsidiary) for the purpose of raising funds. |
| May 2020 | Yokohama branch integrated into head office sales department |
Business summary
Real Estate Sales business
The company’s Real Estate Sales business is characterized by purchasing undervalued properties with restricted utilisation due to the presence of multiple right holders in one real estate. After increasing the value of the properties by adjusting various rights, it sells those properties. The business system diagram is as follows.
Real Estate Sale business system diagram

The real estate business consists of the following four subsegments.
|
Sales |
Classification |
Contents / features |
Profit |
FY2020/12 |
|
|
Sales |
% of total
|
||||
|
(i) |
Leasehold land |
Purchase the Leasehold land, adjust the lots and |
◎ |
6,326 |
35.6 |
|
(ii) |
Old unutilised |
Purchase properties such as dilapidated apartments |
○ |
7,050 |
39.7 |
|
(iii) |
Freehold |
Purchasing properties, land and buildings that do |
△ |
2,271 |
12.8 |
|
- |
Others |
Rent income, real estate services and consulting |
- |
463 |
2.6 |
Note) Unit: ¥ mn, %
Source: Omega Investment from company materials
The flow chart in the next page shows how the company’s marketing is operated. Complex rights-resolving projects are captured from various networks. Each of them is categorized into subsegments of leasehold land, old unutilised properties, and freehold based on the classification at the time of purchase. Sometimes the leasehold land is changed to old unutilised properties due to rights adjustment after purchase, though it is counted as the leasehold land at the time of purchase. For properties with a mixture of leasehold land, old unutilised properties and freehold, if the leasehold land is included, it is counted in the leasehold land. If the property has only old unutilised properties and freehold, it is classified as the old unutilised properties.
Most real estate sales companies are not keen on dealing with properties that come with complicated rights. But Sansei Landic can assess and purchase those properties from the owner in a short period of time, backed by its knowledge and know-how nurtured over many years. Segment by segment, sales and profit tend to fluctuate rather significantly depending on the booking of large-scale properties, whose unit prices are very high.
Real Estate Sales business flow

Leasehold land
Leasehold land is land in which the right to use the land and the right to own the land are separated. The company uses the cup and saucer metaphor in the figure below. A cup and saucer are worth some value as a set. If they are separate, the value of each will be less than half the original value. The land part is called “leasehold land”, and the landowner is called “leasehold landowner”. The person who rents the land, builds his/her own building to live in is called “land lease right holder”, and his/her right is called “land lease right*”.
What is the leasehold land?

If the owner of the land and the building on it is the same, there is no problem. There will be inconveniences if there are a landowner and a building owner on one piece of land. Land lease right is a very strong right that protects the land lease right holder due in part to the historical background. It is difficult for landowners to cancel the contract, and the rent is often kept low due to the custom from the old days. Therefore, property is undervalued, and it is not easy to sell them. Also, the value of a building whose land lease right is held by the building owner tends to be undervalued, as he needs the consent of the landlord to rebuild his property.
For those leasehold land (land ownership right) and land lease right (building ownership right) issues, 1) this right relationship has been in place for a long time, and since the land lease holders rights have been strongly protected, both land owners, who own leasehold land, and land lease right holders are reluctant to resolve inconveniences, 2) the original land lease contract dates back to the old days and in some cases there are no records, so the rights relationship is often unclear, and 3) it is usual that landlords do not have the practical know-how to solve these issues. Those problems will emerge at the time of inheritance amongst both parties, which creates business opportunities.
This issue is a remnant of the measures to secure land and provide housing to the boosting urban residents, especially in metropolitan areas of Japan during the prewar and postwar times when land was in short supply. In recent years, as the generation change progresses and inheritance occurs, this problem has become more apparent.
Besides Sansei Landic, other real estate companies are reluctant to enter the leasehold land business market, because this business is time-consuming, and the deal is much smaller than large-scale development. Some players doing this business are either local or doing it because it is a part of a real estate development project. Sansei Landic is the only company that is growing this business nationwide by being dedicated to the rights adjustment.
Example of leasehold land rights adjustment
The figure below shows the actual case of the company’s leasehold land rights adjustment. In this example, there were 7 land lease right holders in a 300 tsubo i.e., about 1,000m2, land lot in Yokohama City. The company purchased the land from the landowner. So, the landowner could liquidate the land that had been difficult to sell because of many land lease right holders. 3 land pieces out of 7 leased land were not allowed for building reconstruction because they did not connect to the road, so the property value was low.
The company conducted precision surveys, consulted with the local government offices and extended the road within the land lot. Thanks to this, 2 out of the 3 properties were designated as good for building reconstruction. In addition, the remaining one land piece was also designated fine with reconstruction by subdividing. At the end, the land rights of 6 out of 7 were sold to land lease right holders. By combining the saucer and the cup, the value of the property was integrated.
Leasehold land rights adjustment case

Thanks to the increased value, land purchasers will be able to realise much better asset formation as the owner of both land and building. Regarding the remaining one lot, Sansei Landic purchased the land lease right from the land lease right holder and integrated the land and building rights. By this the company could sell it to a third party.
Underlying market size of the leasehold land
There is no concrete and objective data on the size of the leasehold land market. According to the 2018 Housing and Land Statistics Survey of the Statistics Bureau of the Ministry of Internal Affairs and Communications, the number of land lease rights was 874,000 as of October 1, 2018. This is thought to equal the number of land rights at least, so it suggests the market size of the leasehold land business. Considering that the company’s leasehold land lots in FY2020/12 were 345 while the 10-year aggregate was 3,427 from 2011 to 2020, there appears good scope for the company to grow. However, it should be noted that the concept of leasehold land is good only under the old land lease law. Instead, the new land lease law sets a fixed-term land lease right. Hence, the number of leasehold land rights will never increase. In fact, in the same survey of housing and land statistics in 2013, the number of land lease rights was 1.034 million, so it decreased by 160,000 over five years, averaging a decline of 32,000 as per year.
Leasehold land business trends
Leasehold land sales in FY2020/12 were ¥6,326mn (down 5.5% YoY), and the number of land lots sold was 345 (up 1.8%). The graph below illustrates the 10-year records. Both sales and unit price are on the rise. However, as mentioned earlier, some old unutilised properties may be booked in Leasehold Land segment. Moreover, booking and/or absence of large-scale projects influence 12-months sales and profit rather significantly.
Leasehold Land: Sales, number of lots, unit price

Old unutilised properties
The company’s Old Unutilised Property business deals with an apartment or building with tenants, too old to make reasonable profit. The Japanese word “Inuki” usually means properties such as of closed restaurant leaving furniture and stock, but the company’s “Inuki” or old unutilised properties is different. The company purchases an old unutilised property from an owner of land and building, and then asks the tenant right holders i.e., the renters who reside in the building, to move out. If necessary, the company finds a relocation destination and/or bears the relocation costs. As a result, the lease contract will be canceled, and the company will take full ownership. After the renters move out, the old building may be torn down and vacant land will be sold to real estate companies, business companies, individuals, etc. through real estate agents. As shown in the figure below, the main targets are wooden apartments aged over 30 years.
Image of unutilised property

Like the case of leasehold land, old unutilised properties require rights adjustment. For the land and building owner, those properties are not so profitable, but it is not easy for him to negotiate eviction. There is no choice but to keep the return low until all the residents move out. If the company purchases the properties, the owner can monetize it instantly and avoid troublesome eviction negotiations. Residents will also be able to relocate to better places with the support of the company.
Although there are no accurate statistics on the size of the old unutilised property market, according to the 2018 Housing and Land Statistics Survey of the Statistics Bureau of the Ministry of Internal Affairs and Communications, there are approximately 2.35 million wooden condominiums in Japan. Of these, 648,600 units were built before 1990. The company mainly targets metropolitan areas, where the number of properties is expected to decrease. However, the company dealt with only 75 old unrealized properties in FY2020/12 and the total trades from 2011 to 2020 were just 442. These point to untapped demand significant enough for this business.
Old unutilised properties: Sales, number of lots, and unit price

Old unutilised properties business trends
In FY2020/12, old unutilised properties sales were ¥7.0bn (down 4.7%) and the number of lots was 75 (up 11.9%). The unit price was higher than that of the leasehold land; the unit price of the leasehold land for the same period was ¥18.3mn while that of the old unutilised properties was ¥94.0mn. The graphic on the previous page shows the price move over the past 10 years. Sales grew significantly registering a CAGR of 15.1% from FY2011/12 to FY2020/12.
Freehold
“Freehold” is a sub-segment within the Real Estate Sales business segment. It is a property with full ownership of both land and building. The company purchases and sells these properties to real estate companies, business corporations and individuals through real estate agents. Unlike leasehold land and old unutilised properties, profit margin is low as it does not require complicated adjustment of rights. The company faces competition with other real estate sales companies.
Freehold sales in FY2020/12 were ¥2.2bn (+33.3% YoY) and the number of contracts were 13 (±0.0%). As Freehold does not require rights adjustment, each property is becoming larger in size and the unit price in FY2020/12 went up to ¥174.7mn. The graphic below shows the trend of the last 10 years. Sales grew at a CAGR of 26.1% from FY2011/12 to FY2020/12, marking the highest growth among the company’s subsegments under the Real Estate Sales division.
Freehold: Sales, number of lots, unit price trend

Others
The company owns rental real estate such as office buildings, condominiums and apartments. Rent income is booked in “Others “ segment. In addition, to support land management and operation by landowners, the company operates “Owners Partner”, a service that collectively undertakes land leasing management operations such as land rent collection, delinquency reminds, and land lease contract renewal procedures. Revenue from “Owners Partner” as well as the income from other services such as real estate consulting is also booked in this “Others” segment.
Real Estate Sales Business Performance Trends
|
JY mn. |
2011/12 |
2012/12 |
2013/12 |
2014/12 |
2015/12 |
2016/12 |
2017/12 |
2018/12 |
2019/12 |
2020/12 |
|
Net sales |
6,886 |
7,770 |
7,599 |
8,839 |
10,240 |
10,959 |
11,968 |
16,049 |
16,266 |
16,111 |
|
Leasehold land |
4,378 |
3,765 |
3,690 |
4,134 |
5,300 |
5,413 |
5,066 |
7,087 |
6,697 |
6,326 |
|
Old unutilised properties |
1,990 |
2,725 |
2,310 |
3,034 |
3,851 |
3,404 |
5,649 |
5,061 |
7,399 |
7,050 |
|
Freehold |
281 |
1,084 |
1,278 |
1,347 |
690 |
1,791 |
899 |
3,454 |
1,703 |
2,271 |
|
Others |
750 |
517 |
920 |
1,205 |
1,300 |
1,446 |
1,762 |
1,766 |
1,861 |
847 |
|
Segment profit |
1,207 |
952 |
1,580 |
1,779 |
2,018 |
2,251 |
2,742 |
2,881 |
2,953 |
1,935 |
|
Seg. profit margin |
17.5% |
12.3% |
20.8% |
20.1% |
19.7% |
20.5% |
22.9% |
18.0% |
18.2% |
12.0% |
Source: Omega Investment from company materials
Construction business
One’s Life Home Co., Ltd. (OLH) is a consolidated subsidiary, which is engaged in planning, designing, construction and management of made-to-order houses and remodeling work. OLH differentiates itself by its excellent designing ability. It runs a method of architect selection from the pool of affiliated architects, conducts a design competition for the customer’s housing plan and then decides a detailed plan. OLH provides an integrated service from construction to maintenance after construction.
The business system diagram of Construction business is as follows.

One’s Life Home Business Overview and Features

In FY2020/12, the Construction business registered sales of ¥1,662mn (down 5.2% YoY). The number of contracts was 163 (down 6.9%). Deficit was reduced to a loss of ¥4mn from the previous year’s ¥44mn. But the profitability of the segment, which the management regards as critical, was not achieved.
Construction busines sales, segment profit, number of contracts

Financial results trends
Quarterly sales and operating profit
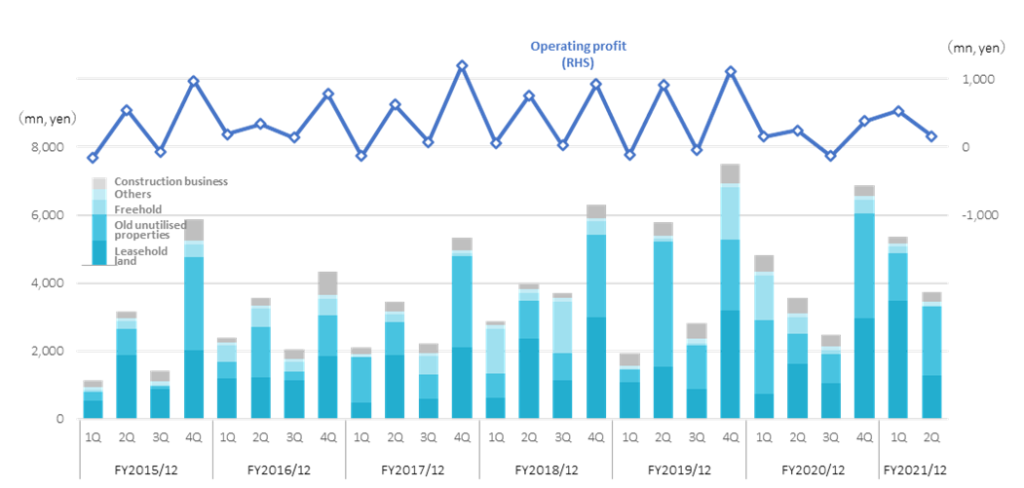
1)Q2 FY2021/12 consolidated results (cumulative): sales rose 9.0% YoY, operating profit up by 74.3%
Q2 FY2021/12 results were sales of ¥9,109mn (up 9.0% YoY), operating profit of ¥689mn (up 74.3%), and ordinary profit of ¥631mn (up 116.4%). Net income attributable to owners of the parent was ¥402mn (up 120.8%). Sales and profit beat the management’s forecasts rising over the previous year.
Face-to-face activities are essential in real estate transactions, so, the company’s marketing activities in FY2020/12 were greatly affected by COVID-19 after Q2. The company implemented well-thought-out counter-measures against COVID-19 for business partners and employees. Since Q4 FY2020/12, marketing activities have become almost normal and business performance is recovering.
Sales came in way above the company estimates, as a project that includes both leasehold land and old unutilised properties was booked this term instead of last year, and as sales in general progressed well. In terms of profits, it was positive that the profit margin was better than forecast, resulting in a significantly better overall profits YoY.
|
JPY, mn |
Net sales |
YoY |
Oper. |
YoY |
Ord. |
YoY |
Profit |
YoY |
EPS |
DPS |
|
2017/12 |
13,098 |
6.5 |
1,762 |
21.9 |
1,668 |
25.6 |
1,111 |
30.2 |
134.45 |
18.00 |
|
2018/12 |
16,833 |
28.5 |
1,765 |
0.2 |
1,642 |
-1.5 |
1,006 |
-9.4 |
119.62 |
21.00 |
|
2019/12 |
18,020 |
7.1 |
1,860 |
5.4 |
1,758 |
7.0 |
1,158 |
15.1 |
137.08 |
23.00 |
|
2020/12 |
17,774 |
-1.4 |
847 |
-54.5 |
709 |
-59.7 |
357 |
-69.1 |
42.34 |
25.00 |
|
2021/12 (CE) |
18,385 |
3.4 |
919 |
8.5 |
762 |
7.5 |
505 |
41.3 |
59.88 |
25.00 |
|
2020/12 Q2 |
8,354 |
8.5 |
395 |
-50.0 |
291 |
-61.1 |
182 |
-61.5 |
21.58 |
– |
|
2021/12 Q2 |
9,109 |
9.0 |
689 |
74.3 |
631 |
116.4 |
402 |
120.8 |
48.37 |
– |
Sales and operating income by quarterly segment
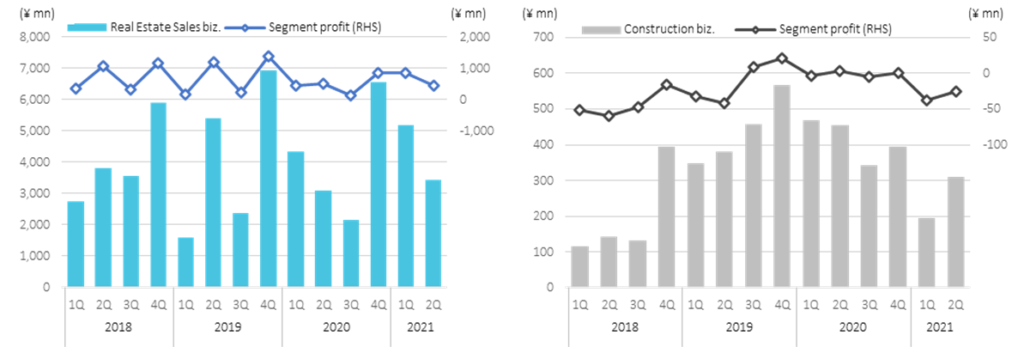
2)Results by segment
a)Real Estate Sales business: Sales ¥8,605mn (up 15.8%), profit ¥1,279mn (up 34.2%) ●
– Leasehold land: Sales ¥4,731mn (up 102.8%). The property with a mixture of old unutilised properties, which was scheduled to sell in Q4 FY2020/12, was booked this term. In addition, as a result of steady progress in Q2, sales almost doubled YoY, exceeding the management’s estimate for Q2 by 34.5%.
– Old unutilised properties: Sales ¥3,444mn (up 11.9%). Sales rose YoY but undershot the management’s forecast by 7.0%. Profit increased thanks to better-than-forecast profit margins
– Freehold: Sales ¥237mn (down 86.6%). Sales declined significantly YoY as those of the last year were abnormally high. The results were worse than the company forecasts, which were based on the inventory levels at the beginning of the current fiscal year.
The property stocking for the Real Estate Sales business was ¥4,491mn. It decreased by 50.4% as the stocking increased significantly in the same period of the previous year. Although the purchase of leasehold land, old unutilised properties and freehold, decreased, the number of projects and purchase contracts are increasing indicating good improvement. As per the number of plots, that of leasehold land area was 213, rising 10.9% YoY. Old unutilised properties saw the number of lots increase by 55.6% to 42. Freehold were 3 lots and decreased by 62.5%.
b)Construction business: Sales of ¥503mn (down 45.4%), loss of ¥63mn (¥0mn in the same period of the previous year)
Sales decreased significantly YoY as backlog orders were few at the beginning of this financial year. COVID-19 caused delays in negotiations and construction starts, and the results fell short of the company’s expectation.

In the balance sheet, property for sale decreased due to progress in sales activities. The balance at the end of June was ¥12,586mn, a decrease of ¥1,838mn from the end of December 2020. Interest-bearing liabilities decreased by ¥1,754mn. As a result, the equity ratio at the end of June 2021 was 54.8%, rising by 4.7 points.
Other topics
- Regional redevelopment project: Utilising the real estate rights adjustment know-how, the company cooperates with local governments and the tourism and accommodation industry in an aim to reinvigorate the regional economy.
- The company introduced a training program for employees to develop new businesses. The feasibility of the proposed business plans from this project is verified by the company.
- Continued crowd-funding efforts to diversify financing sources.
The company planned to merge with its subsidiary One’s Life Home on July 1, 2021, with the aim of strengthening the profitability of the construction business. However, during the investigation preceding the merger, the company detected a possibility of inappropriate transactions. An internal investigation committee was set up and investigation was conducted. By the investigation, the case was found out to be due to the former employee alone and no organizational involvement was found out. Sansei Landic announced that it will reassess the merger with One’s Life Home and the timing of it.
3)FY2021/12 full-year forecast: initial forecast unchanged
As of Q2 FY2021/12, the progress vis-à-vis the management’s full-year plan is 50% in sales, 75% in operating profit, 83% in recurring profit, and 80% in net profit. As per segment sales, the progress is Leasehold Land 59% (full-year plan; ¥8 bn), Old Unutilised Properties 47% (¥7.3bn), Freehold 30% (¥800mn), and Construction 30% (¥1.7bn). These suggest that the full-year company targets are easy to beat. However, the company left its forecasts unchanged, despite good sales, in fear of the re-expansion of COVID-19.
Stock information, etc.
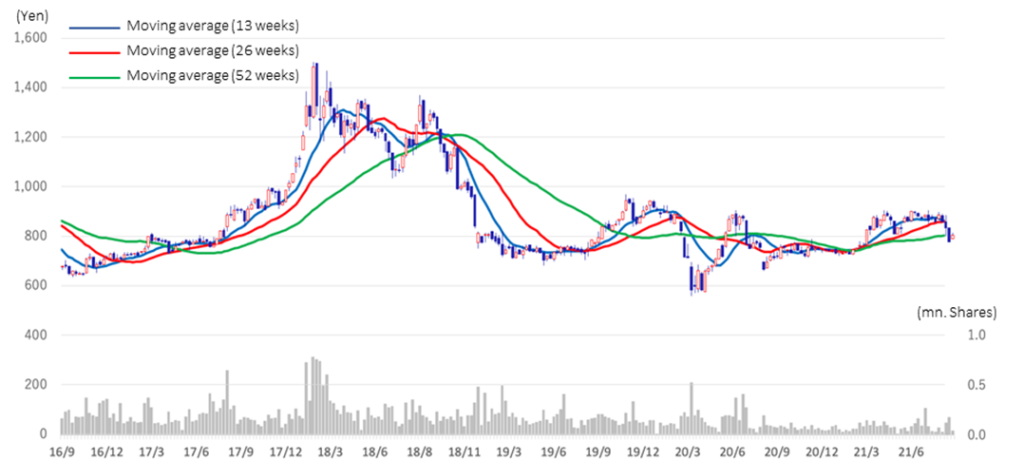
Stock price trends
The stock price has risen since the FY2020/12 result announcement on February 12, 2021, backed by the expectation of business recovery from the pandemic, as well as the company’s first share buyback. There have been some upward and downward stock price adjustments, but the stocks have been trading between ¥800 and ¥900 a share. Going forward, the announcement of a medium-term business plan, which is expected to make clear the direction of the company, may well trigger revaluation of the stock.
5-year stock price move
Valuation analysis
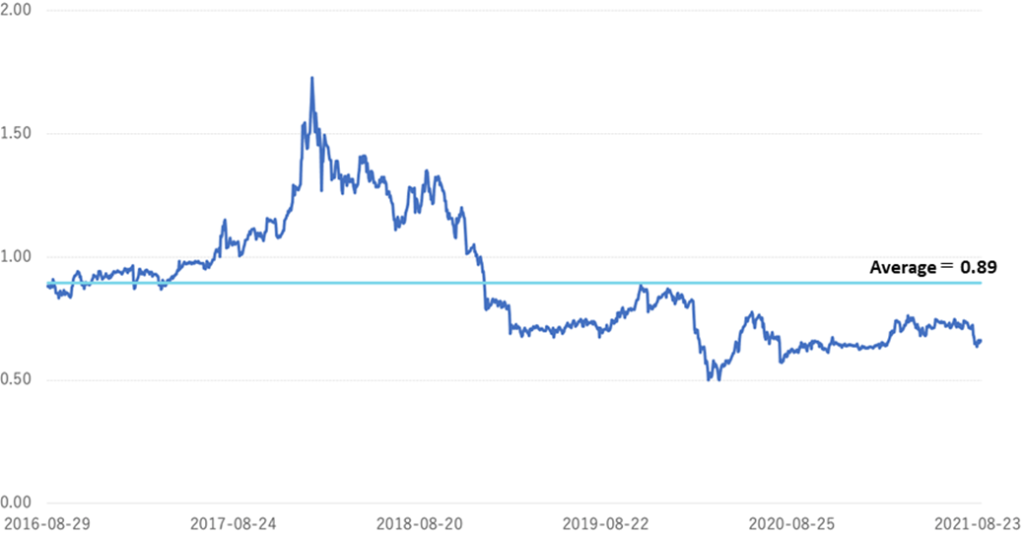
The company’s stock has been trading below 1.0 x book since the middle of 2018. Currently the stock trades below the five-year average of 0.89.
PBR Historical Trend (5 years)
Comparison of similar company profit indicators, etc.
|
Ticker |
Name |
Net sales |
Share price |
Market Cap |
PER |
PBR |
EV/ |
ROIC |
ROE |
Net profit |
Financial |
Total asset |
|
3277 |
Sansei Landic |
18,020 |
828 |
7,017 |
13.65 |
0.66 |
5.6 |
7.87 |
12.33 |
6.4 |
1.95 |
1.00 |
|
8934 |
Sun Frontier Fudousan |
73,218 |
1,220 |
59,394 |
8.39 |
0.79 |
3.9 |
10.44 |
17.72 |
14.6 |
2.02 |
0.61 |
|
8923 |
Tosei |
63,940 |
1,200 |
58,507 |
7.90 |
0.75 |
14.2 |
2.77 |
6.14 |
5.6 |
2.74 |
0.40 |
|
3299 |
Mugen Estate |
39,677 |
781 |
6,976 |
9.72 |
0.49 |
11.7 |
3.63 |
7.51 |
4.3 |
3.00 |
0.59 |
|
2975 |
Star Mica Holdings |
39,568 |
1,524 |
29,043 |
12.75 |
1.22 |
21.6 |
3.40 |
9.03 |
4.4 |
3.89 |
0.52 |
|
8940 |
Intellex |
37,863 |
498 |
12,132 |
18.34 |
0.54 |
17.6 |
2.47 |
4.90 |
1.4 |
3.63 |
1.00 |
|
8914 |
Arealink |
29,333 |
1,482 |
19,178 |
10.70 |
0.87 |
5.3 |
12.97 |
-9.97 |
-6.0 |
2.62 |
0.73 |
|
3236 |
Properst |
23,674 |
1,541 |
9,830 |
9.83 |
0.80 |
11.5 |
6.26 |
22.23 |
3.8 |
4.92 |
1.07 |
|
3294 |
E’grand |
20,464 |
147 |
5,167 |
7.29 |
1.03 |
6.8 |
6.11 |
12.27 |
4.3 |
2.50 |
1.13 |
|
3264 |
Ascot |
15,558 |
188 |
24,424 |
– |
1.06 |
17.5 |
4.36 |
6.46 |
5.0 |
2.61 |
0.52 |
|
3297 |
TOUBUJYUHAN |
6,850 |
1,031 |
2,796 |
7.93 |
0.79 |
7.8 |
6.41 |
9.06 |
4.0 |
1.74 |
1.38 |
Note) Unit: mn. yen, yen, %, x, times
Shown above is a cross-valuation of similar companies in the real estate industry. Since no other listed company operates leasehold land as a main business, companies that do refurbishment of used real estate or remodeling are picked up. The stocks of many of them trade at 1.0 x book or less. Considering that Sansei Landic delivers above average ROIC, ROE and net profit margin, current PBR of 0.66 times looks likely to be re-rated rather than not.
(See also our Investment View for the discussion of the company’s valuations.)
Shareholders
| Name | Shares owned | % to outstanding number of shares |
| Takashi Matsuzaki | 1,308,430 | 15.5 |
| Japan Trustee Services Bank, Ltd. (Trust Account) | 551,200 | 6.5 |
| Shoji Matsuura | 469,200 | 5.6 |
| The Master Trust Bank of Japan, Ltd. (Trust Account) | 367,500 | 4.4 |
| Junko Ozawa | 353,000 | 4.2 |
| Sansei Employee Stockholding Association | 187,608 | 2.2 |
| Yuka Kikuchi | 159,750 | 1.9 |
| Yusuke Ozawa | 159,750 | 1.9 |
| Kengo Ozawa | 159,750 | 1.9 |
| Fumihiko Kimura | 95,000 | 1.1 |
| Total | 3,811,188 | 45.2 |
| Number of issued shares | 8,468,300 |
Source : The company annual report (FY2020/12)
President Matsuzaki, Managing Director Matsuura, and the founder’s family are among the top shareholders. Internal directors also hold some shares, so they share the same value in common with shareholders. The top 10 shareholders have a 45% stake, which has been a stable composition.
Shareholder return policy
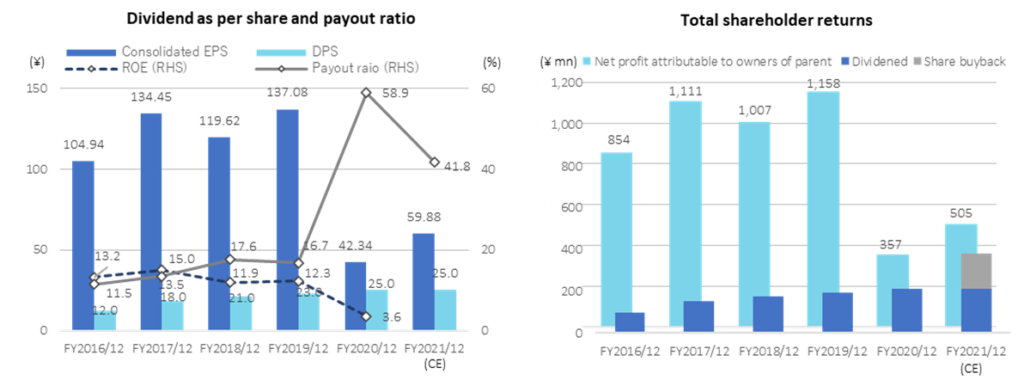
The company considers shareholder returns as one of the most important agenda and has been raising dividends almost every year over the last few years. The payout ratio has been above 10% consistently. In February 2021, the company acquired treasury stock for the first time in its history, in view of the cheap stock price. The company bought 200,000 shares, or 2.37% of the issued shares worth about 167 million yen, in the market.
In addition to the dividend, the company gives QUO cards and canned bread as shareholder gifts. The company concurs with the hunger relief project of the canned bread manufacturer, so the gift is the reflection of its belief in CSR. The gift is in the favour of shareholders as it is good stockpiling in the event of a disaster. From 2021, shareholders can also choose for catalog gifts.
Corporate governance and top management
The company has a board of corporate auditors and hires one full-time corporate auditor. There are nine directors, of which three are outside directors who comprise one-third of the board. President Matsuzaki, Managing Director Matsuura, and the founder’s family are among the top shareholders. There are three corporate auditors, including one full-time hire. Previously, the company’s directors and corporate auditors were all male, but in March 2021, Ms. Naoko Muramatsu was appointed as an outside director. The Tokyo Stock Exchange announced a revised version of the “Corporate Governance Code” in June 2021, requesting the listed companies to ensure the right function of the board of directors by increasing the ratio of independent outside directors and asked to diversify the core human resources. Also, TSE demands diversity in managerial positions, promotion of women, foreigners and mid-career hires. Currently the company’s business is mainly in Japan. It will need to deepen discussion to raise the levels of diversity.
The company’s corporate governance system

The profile of each top management person is shown on the next page. Takashi Matsuzaki, President and CEO, joined the company in 1993 and has been leading the company as CEO for nearly 20 years since July 2003. Under his leadership, he promoted all Japan expansion of the leasehold land business and grew the company’s business base today. He also realised the listing of the company. Among the management team, besides Mr. Matsuzaki, there are very experienced people in the real estate industry. These professionals help the company to keep a solid position in an industry, where the human network is extremely important.
The company’s policy for CSR
As an initial move towards CSR, the company has clarified its efforts on formulation of corporate governance guidelines and the initiatives for shareholders and investors, employees, society and the environment. As for social and environmental initiatives, the company submits a report on global warming countermeasures, in addition to social welfare support activities. The above-mentioned Corporate Governance Code of TSE requires listed companies to deal with issues related to sustainability such as TCFD in the future. Unlike the manufacturing industry, CO2 emissions may not be a major problem for the company for now. Nevertheless, the company will need to consider the issues such as SDGs.
The company’s top management (directors and corporate auditors)
Takashi Matsuzaki
May 1993 Joined the company
July 2003 Appointed President and Representative Director
Shoji Matsuura
April 1999 Joined the company
July 2004 Director, General Manager of General Affairs Department
March 2010 Senior Managing Director, General Manager of Administration Headquarters and General Manager of Accounting and Finance Department
January 2017 Senior Managing Director
Management manager:
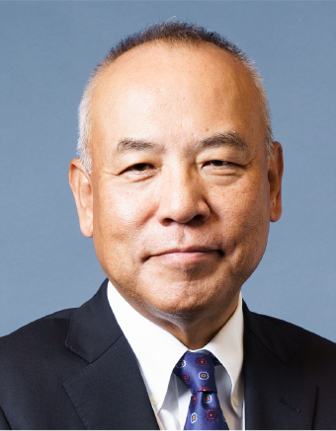
Takeshi Nagata
Joined Japan General Estate (currently Daiwa Land Residence) in October 1994.
May 2012 Joined the company
March 2013 Director, General Manager of Administration Division
March 2017 Managing Director, General Manager of Administration Division
January 2021 Managing Director and Managing Director
And General Manager of Second Sales Division:
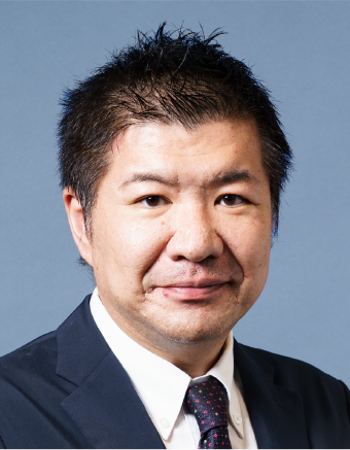
Makoto Taki
Joined Saison Group in April 1977
January 2016 Joined the company
March 2017 Director, General Manager of Second Sales Division
March 2019 Managing Director, General Manager of Second Sales Division
January 2021 Managing Director and General Manager of Second Sales Division
First Sales Headquarters:
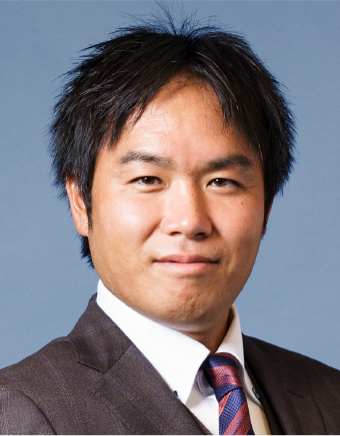
Noriyuki Imafuku
Joined the company in April 2003
March 2017 Director, General Manager of First Sales Division
Third Sales Headquarters Manager:
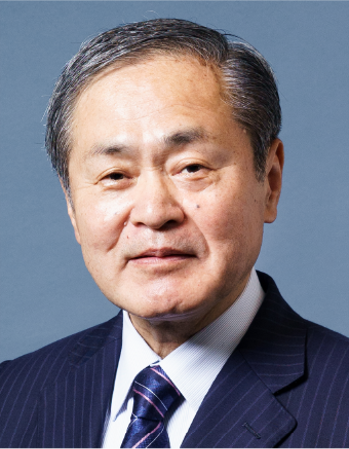
Shunyo Morioka
Joined the company in May 2008
March 2017 Director, General Manager of Third Sales Division and General Manager of Nagoya Branch
January 2021 Director, General Manager of Third Sales Division
Hiroshi Takahashi
December 1973 Joined Fuso Audit Corporatio
December 1973 Joined Fuso Audit CorporationSeptember 2010 General Manager, Business Promotion Office, Audit Business Headquarters, Ernst & Young ShinNihon Audit Corporation (currently EY Shinnihon LLC)
March 2012 Appointed as an outside director of the company

Yukihiro Seita
September 1997 Opened Kiyota Accounting Office (former Landmark Tax Accountant Corporation) Representative Employee
June 2016 Established Landmark Real Estate Appraisal Representative Director
March 2020 Appointed as an outside director of the company

Naoko Murasaki
April 1995 Joined the National Police Agency
April 2008 Bain & company Japan Incorporated
January 2016 Kroll International Inc. Managing Director and Representative of Japan Branch
March 2021 Appointed as an outside director of the company
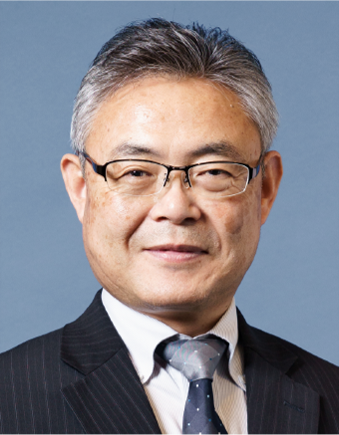
Koukichi Yamaguchi
August 1998 Joined Nippon Sogo Jisho (currently Daiwa Jisho Residence)
March 2016 Appointed Outside Audit & Supervisory Board Member of the company, One ’s Life Home Audit & Supervisory Board Member
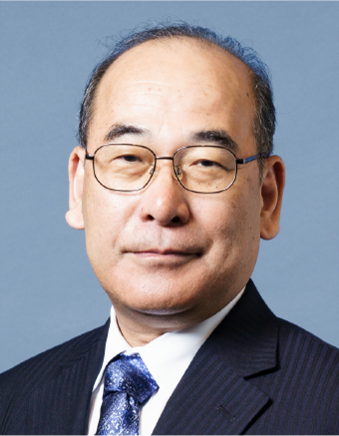
Masaru Hirasawa
January 1986 Joined Oshima Accounting Office
January 1996 Director, Katsutoshi Hirasawa Tax Accountant Office
March 2016 Appointed as an outside corporate auditor of the company
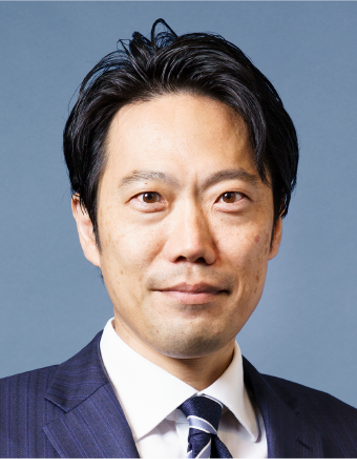
Toshihiro Enokizono
October 2002 Joined Shintokyo Law Offices
January 2012 Partner of Tokyoseiwa Law Office
March 2015 Appointed as an outside corporate auditor of the company
Financial data
|
FY (¥mn) |
2011/12 |
2012/12 |
2013/12 |
2014/12 |
2015/12 |
2016/12 |
2017/12 |
2018/12 |
2019/12 |
2020/12 |
|
[Statements of income] |
||||||||||
|
Net sales |
8,042 |
9,475 |
9,187 |
10,443 |
11,567 |
12,300 |
13,098 |
16,833 |
18,020 |
17,774 |
|
Cost of sales |
5,557 |
7,061 |
6,254 |
7,055 |
7,798 |
8,344 |
8,566 |
12,028 |
12,902 |
13,788 |
|
Gross profit |
2,485 |
2,415 |
2,934 |
3,389 |
3,769 |
3,957 |
4,532 |
4,805 |
5,119 |
3,986 |
|
SG&A expenses |
1,735 |
1,898 |
2,014 |
2,184 |
2,470 |
2,510 |
2,770 |
3,039 |
3,258 |
3,139 |
|
Operating income |
750 |
517 |
920 |
1,205 |
1,300 |
1,446 |
1,762 |
1,766 |
1,861 |
847 |
|
Non-operating income |
135 |
5 |
12 |
14 |
15 |
15 |
12 |
28 |
42 |
88 |
|
Non-operating expenses |
138 |
85 |
122 |
174 |
118 |
133 |
106 |
150 |
144 |
226 |
|
Ordinary income |
747 |
437 |
810 |
1,044 |
1,196 |
1,329 |
1,669 |
1,643 |
1,759 |
709 |
|
Extraordinary income |
54 |
23 |
97 |
32 |
||||||
|
Extraordinary expenses |
4 |
17 |
94 |
104 |
29 |
|||||
|
Loss before income taxes |
797 |
443 |
810 |
1,044 |
1,196 |
1,329 |
1,672 |
1,539 |
1,759 |
712 |
|
Total income taxes |
353 |
209 |
354 |
418 |
472 |
475 |
561 |
533 |
600 |
355 |
|
Net income |
444 |
233 |
456 |
626 |
724 |
854 |
1,111 |
1,007 |
1,159 |
358 |
|
[Balance Sheets] |
||||||||||
|
Current assets |
5,251 |
6,257 |
8,023 |
7,836 |
10,366 |
9,749 |
15,874 |
15,745 |
18,094 |
19,040 |
|
Property for sale |
3,698 |
4,834 |
6,346 |
5,166 |
7,699 |
6,877 |
11,863 |
11,678 |
13,493 |
14,424 |
|
Non-current assets |
834 |
836 |
895 |
957 |
1,031 |
1,083 |
1,042 |
1,032 |
1,199 |
1,030 |
|
Tangible assets |
136 |
135 |
569 |
603 |
572 |
591 |
467 |
458 |
456 |
306 |
|
Investments and other assets |
612 |
622 |
226 |
258 |
383 |
405 |
494 |
505 |
669 |
655 |
|
Total assets |
6,085 |
7,093 |
8,919 |
8,793 |
11,398 |
10,833 |
16,916 |
16,777 |
19,294 |
20,071 |
|
Current liabilities |
2,663 |
3,098 |
4,587 |
3,165 |
4,910 |
3,751 |
8,430 |
6,160 |
9,047 |
5,772 |
|
Short-term borrowings |
1,733 |
2,095 |
3,362 |
2,094 |
3,778 |
2,624 |
7,076 |
4,728 |
7,203 |
4,462 |
|
Non-current liabilities |
181 |
562 |
465 |
367 |
453 |
226 |
479 |
1,710 |
351 |
4,232 |
|
Long-Term Borrowings |
147 |
526 |
419 |
320 |
180 |
88 |
364 |
1,320 |
3,879 |
|
|
Total liabilities |
2,845 |
3,660 |
5,051 |
3,531 |
5,363 |
3,977 |
8,909 |
7,869 |
9,399 |
10,004 |
|
Total net assets |
3,241 |
3,433 |
3,868 |
5,262 |
6,034 |
6,856 |
8,006 |
8,908 |
9,894 |
10,066 |
|
Total shareholders’ equity |
3,241 |
3,433 |
3,868 |
5,262 |
6,034 |
6,852 |
8,002 |
8,904 |
9,890 |
10,062 |
|
Capital stock |
257 |
257 |
257 |
661 |
710 |
720 |
788 |
811 |
814 |
818 |
|
Legal capital reserve |
218 |
218 |
218 |
622 |
671 |
681 |
749 |
772 |
775 |
779 |
|
Retained earnings |
2,766 |
2,958 |
3,393 |
3,978 |
4,654 |
5,451 |
6,464 |
7,320 |
8,302 |
8,465 |
|
Stock acquisition right |
4 |
4 |
4 |
4 |
4 |
|||||
|
Total liabilities and net assets |
6,085 |
7,093 |
8,919 |
8,793 |
11,398 |
10,833 |
16,916 |
16,777 |
19,294 |
20,071 |
|
[Statements of cash flows] |
||||||||||
|
Cash flow from operating activities |
970 |
-953 |
-664 |
1,761 |
-1,451 |
1,611 |
-3,666 |
1,617 |
-420 |
-917 |
|
Loss before income taxes |
797 |
443 |
810 |
1,044 |
1,196 |
1,329 |
1,672 |
1,539 |
1,759 |
712 |
|
Cash flow from |
127 |
-15 |
-175 |
-111 |
-116 |
-184 |
107 |
-64 |
-71 |
-288 |
|
Cash flow from |
-877 |
692 |
1,136 |
-612 |
1,588 |
-1,278 |
4,667 |
-1,495 |
984 |
953 |
|
Issuance of shares |
406 |
800 |
97 |
21 |
37 |
45 |
6 |
9 |
||
|
Net increase in |
219 |
-276 |
296 |
1,039 |
22 |
150 |
1,108 |
58 |
493 |
-251 |
|
Cash and cash equiv. |
850 |
1,069 |
793 |
1,089 |
2,128 |
2,150 |
2,299 |
3,407 |
3,465 |
3,959 |
|
Cash and cash equiv. |
1,069 |
793 |
1,089 |
2,128 |
2,150 |
2,299 |
3,407 |
3,465 |
3,959 |
3,707 |
|
FCF |
1,097 |
-968 |
-839 |
1,650 |
-1,567 |
1,427 |
-3,559 |
1,553 |
-491 |
-1,205 |
Source: Omega Investment from company materials
