2026-07-27
Home
Japanese

Omega Investment Co., Ltd.
Sansei Landic (Company note 3Q update)
| Share price(12/7) | ¥811 | PER(21/12 CE) | 13.3 X |
| 52 weeks high/low | ¥908/722 | PBR(20/12 act) | 0.65 X |
| ADVT (¥ mn, monthly) | ¥10 mn | ROE(20/12 act) | 3.6 % |
| Shrs out | 8.474 mn shrs | Mkt cap | ¥6.8 bn |
| Listed market | TSE 1st section | Shr eqty ratio (21/9) | 51.6 % |
| Click here for the PDF version of this page |
| 3277SL2021Q3CN1208EN |
Sales and profits are up significantly yoy and are running way above the company target. The company should revise up, though there needs to be caution about pandemic disease.
◇Key points for the financial results for 3Q of FY 12/2021
- The company made up for delays in sales activities caused by COVID-19. Sales and profits are rising significantly over the last year and are running way above the guidance.
- Profits have already overachieved the full-year company forecasts, and upward revision looks likely.
- Despite the strong results, the stock price is left undervalued continuing adjustment.
◇Financial results for 3Q of FY 12/2021: Sales grew 22% * year-on-year and operating income increased 4 times
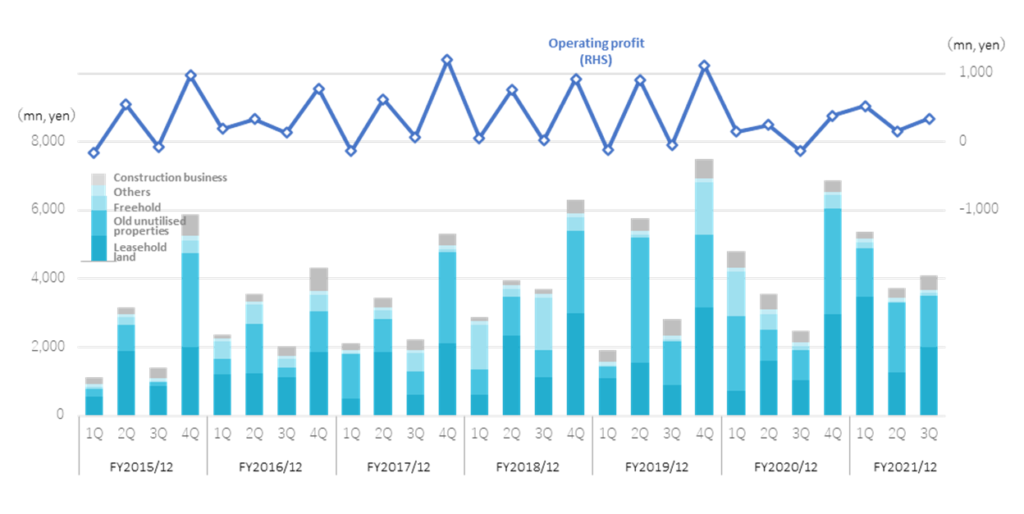
For 3Q of FY 12/2021, the company posted net sales of 13,198 million yen (up 21.8%), an operating income of 1,027 million yen (up 287.4%), an ordinary income of 943 million yen (up 519.8%), and a quarterly net income attributable to the shareholders of the parent company shareholders of 547 million yen (up 492.4%).
Sales and profits are up significantly year-on-year and are way above the company guidance. Business rebounded from the significant impact of COVID-19 in 2Q and 3Q of the previous year. Moreover, the countermeasures against COVID-19, such as the adoption of IT for marketing, were positive. (See also the next page and the graph)
By segment, the real estate sales business performed well, delivering sales of 12,284 million yen (up 28.4%) and a profit of 1,987 million yen (up 83.5%). On the other hand, the construction business registered sales of 913 million yen (down 27.9%) and the loss of 144 million yen (a loss of 5 million yen last year) (See the next page for details).
The procurement in the real estate sales business totaled 7,544 million yen (down 31.9%). The orders received in the construction business were 1,186 million yen (up 61.3%). Since the level was high in the previous year, the procurement decreased yoy. However, there appears no impact on the immediate business performance.
*Unless otherwise specified in this report, % of increase/decrease indicates year-on-year comparison (cumulative basis).
◇Full-year outlook for FY 12/2021: the forecast are left unchanged despite profits overachieving the full-year guidance
So far, sales have achieved 72% of the guidance, and profits have exceeded the management’s target by the end of 3Q. However, the management retained the full-year forecasts. Currently, the impact of the fifth wave of COVID-19 is significant, and the company says that it will carry over some of the properties scheduled for sale in 4Q to the next fiscal year. Still, the management may well revise up for the full year.
|
JPY, mn
|
Net sales |
YoY % |
Oper. profit |
YoY % |
Ord. profit |
YoY % |
Profit ATOP |
YoY % |
EPS (¥) |
DPS (¥) |
|
2017/12 |
13,098 |
6.5 |
1,762 |
21.9 |
1,668 |
25.6 |
1,111 |
30.2 |
134.45 |
18.00 |
|
2018/12 |
16,833 |
28.5 |
1,765 |
0.2 |
1,642 |
-1.5 |
1,006 |
-9.4 |
119.62 |
21.00 |
|
2019/12 |
18,020 |
7.1 |
1,860 |
5.4 |
1,758 |
7.0 |
1,158 |
15.1 |
137.08 |
23.00 |
|
2020/12 |
17,774 |
-1.4 |
847 |
-54.5 |
709 |
-59.7 |
357 |
-69.1 |
42.34 |
25.00 |
|
2021/12 (CE) |
18,385 |
3.4 |
919 |
8.5 |
762 |
7.5 |
505 |
41.3 |
59.88 |
25.00 |
|
2020/12 3Q |
10,835 |
3.1 |
265 |
-64.3 |
152 |
-77.5 |
92 |
-78.3 |
10.95 |
– |
|
2021/12 3Q |
13,198 |
21.8 |
1,027 |
287.4 |
943 |
519.8 |
547 |
492.4 |
66.02 |
– |
Quarterly sales and operating profit
◇Trends by segment: (See also “Financial data”)
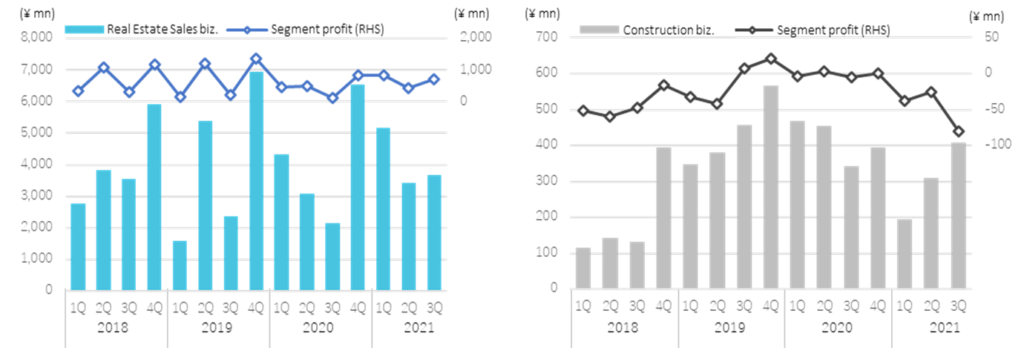
a)Real estate sales business : Sales of 12,284 million yen (up 28.4%, + 14.7% above the guidance), profit of 1,987 million yen (up 83.5%))
ー Leasehold land: Sales were 6,734 million yen (up 99.5%). The properties mixed with old unutilised properties, which the company scheduled to sell in the 4Q of the last year, were booked as sales this term. In addition, 3Q sales were strong.
As a result, nine-month sales doubled year-on-year, exceeding the company forecast by 23.7%.
ーOld unutilised properties (properties with furnishings of previous tenants): Sales of 4,932 million yen (up 24.9%). Sales in 2Q and 3Q expanded significantly by 125.8% and 70.6%, respectively. Nine-month sales and profits exceeded the forecasts.
ーFreehold: Sales registered 338 million yen (down 82.0%). Sales declined significantly year-on-year as they were more robust than usual last year. The management anticipated sales to drop considerably judging from the inventory at the beginning of this fiscal year. Sales did not reach even that forecast. However, the freehold business is a low-profit margin because of the competition with other more common real estate companies, and it is not easy to utilise the company’s features. Therefore, the impact on the overall profits is not so significant.
Sales and operating income by quarterly segment
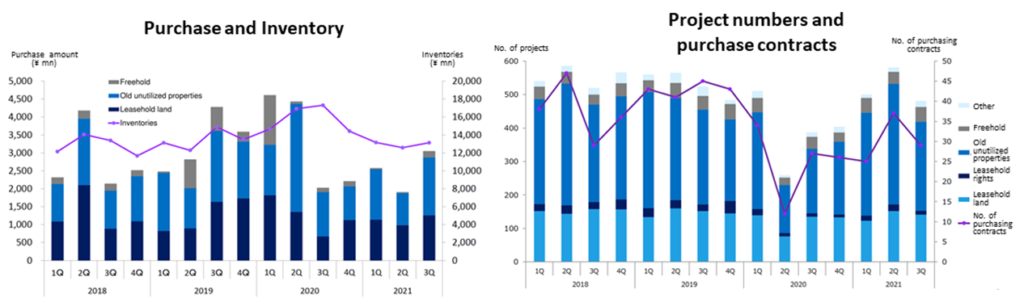
The procurement amount in the real estate sales business was 7,544 million yen. Although the number of projects and the number of purchase contracts have improved significantly, the period until settlement has become longer in some cases, and accumulation slowed down. Procurement decreased in all leasehold land, old unutilised properties and freehold, resulting in a total decline of 31.9%. However, this will not affect the company’s business performance for the current fiscal year. The company will focus on securing projects for the next fiscal year.
b)Construction Business: Sales of 913 million yen (down 27.9%, -21.3% below the forecast), a loss of 144 million yen (a loss of 5 million yen yoy)
COVID-19 delayed business negotiations and construction starts, and sales were down yoy, undercutting the company forecasts. The earnings were significantly affected by the provision for construction loss of about 82 million yen. This was related to wooden construction, the company’s high-value-added mainstay. There was a cost overrun of RC properties, which the company had started as a new initiative.
The orders received in the construction business are on track of recovery, despite COVID-19 and the skyrocketing lumber prices.
On the balance sheet, cash and deposits increased by 849 million yen (from the end of December 2020) to 5,179 million yen due to the steady progress of sales activities. Real estate for sale decreased by 1,290 million yen, and the balance at the end of September was 13,134 million yen. At the same time, interest-bearing debt decreased by 487 million yen to 7,853 million yen.
◇ Full-year outlook for FY 12/2021: Profit reached the initial forecast, but the management left guidance unchanged.
As per the nine-month progress, sales have achieved 72% of the management’s full-year target, and profits are already much above the company’s guidance. However, they left their forecasts unchanged. As the impact of the fifth wave of COVID-19 was more significant than expected, the company says that it will carry over some of the properties that it planned to sell in 4Q to the next fiscal year. Nevertheless, the expectations for an upward revision to the full-year earnings forecast should mount.
◇ Other topics: Application for “Standard Market” of Tokyo Stock Exchange
At the board of directors’ meeting held on November 12, the company resolved to select and apply for the “standard market” for listing the company’s stock in the new market category of TSE, which will be effective from April 4, 2022.
◇ Stock price: Financial results are good, but the stocks remain undervalued continuing adjustments.
Following the 2Q result report, the stock price rose due to the announcement of share buyback. But the stock price has been adjusting after the 3Q announcement. It is probably because the management did not revise up the full-year forecasts being cautious. As mentioned in our previous report, PBR is 0.65 and is below 0.89, which is the average over the last five years. If the company revises up at the time of 4Q result announcement and reveals a positive outlook for FY 12/2022, the stock price may well be re-rated. (Refer to the graph on the next page.)
Financial data
|
FY (¥mn) |
2019/12 |
2020/12 |
2021/12 |
||||||||
|
1Q |
2Q |
3Q |
4Q |
1Q |
2Q |
3Q |
4Q |
1Q |
2Q |
3Q |
|
|
[Sales by segment] |
|||||||||||
|
Net sales |
1,925 |
5,775 |
2,811 |
7,507 |
4,807 |
3,546 |
2,481 |
6,938 |
5,365 |
3,744 |
4,089 |
|
Year-on-year basis |
-33.0% |
45.8% |
-23.9% |
15.0% |
149.7% |
-38.6% |
-11.7% |
-7.6% |
11.6% |
-7.6% |
11.6% |
|
Real estate sales business |
1,576 |
5,396 |
2,353 |
6,941 |
4,339 |
3,092 |
2,137 |
6,543 |
5,171 |
3,434 |
3,679 |
|
Year-on-year basis |
-42.8% |
41.3% |
-33.9% |
17.5% |
175.3% |
-42.7% |
-9.2% |
-5.7% |
19.2% |
11.1% |
72.1% |
|
Sales composition ratio |
81.9% |
93.4% |
83.7% |
92.5% |
90.3% |
87.2% |
86.2% |
94.3% |
96.4% |
91.7% |
90.0% |
|
Leasehold land |
1,086 |
1,546 |
889 |
3,176 |
719 |
1,613 |
1,044 |
2,950 |
3,464 |
1,267 |
2,003 |
|
Year-on-year basis |
77.7% |
-34.2% |
-21.5% |
6.1% |
-33.8% |
4.3% |
17.4% |
-7.1% |
381.4% |
-21.5% |
91.9% |
|
Sales composition ratio |
56.4% |
26.8% |
31.6% |
42.3% |
15.0% |
45.5% |
42.1% |
42.5% |
64.6% |
33.8% |
49.0% |
|
Old unutilised properties |
351 |
3,657 |
1,283 |
2,108 |
2,180 |
897 |
872 |
3,101 |
1,419 |
2,025 |
1,488 |
|
Year-on-year basis |
-51.6% |
225.4% |
62.0% |
-12.9% |
520.6% |
-75.5% |
-32.0% |
-47.1% |
-34.9% |
125.8% |
70.6% |
|
Sales composition ratio |
18.2% |
63.3% |
45.6% |
28.1% |
45.4% |
25.3% |
35.1% |
44.7% |
26.4% |
54.1% |
36.4% |
|
Freehold |
28 |
88 |
55 |
1,532 |
1,305 |
465 |
106 |
395 |
191 |
46 |
101 |
|
Year-on-year basis |
-97.9% |
-60.4% |
-96.4% |
290.8% |
4560.7% |
428.4% |
92.7% |
-74.2% |
-85.3% |
-90.1% |
-4.7% |
|
Sales composition ratio |
1.5% |
1.5% |
2.0% |
20.4% |
27.1% |
13.1% |
4.3% |
5.7% |
3.6% |
1.2% |
2.5% |
|
Others |
110 |
104 |
126 |
126 |
133 |
117 |
116 |
97 |
96 |
95 |
88 |
|
Year-on-year basis |
11.1% |
-14.8% |
5.0% |
21.2% |
21.5% |
12.5% |
-7.9% |
-23.0% |
-28.3% |
-18.8% |
-24.1% |
|
Sales composition ratio |
5.7% |
1.8% |
4.5% |
1.7% |
2.8% |
3.3% |
4.7% |
1.4% |
1.8% |
2.5% |
2.2% |
|
Construction business |
349 |
379 |
457 |
566 |
468 |
455 |
343 |
395 |
194 |
309 |
409 |
|
Year-on-year basis |
202.6% |
166.5% |
246.1% |
44.0% |
34.1% |
19.8% |
-24.9% |
-30.1% |
-58.4% |
-32.1% |
19.3% |
|
Sales composition ratio |
18.1% |
6.6% |
16.3% |
7.5% |
9.7% |
12.8% |
13.8% |
5.7% |
3.6% |
8.3% |
10.0% |
|
[Statements of income] |
|||||||||||
|
Net sales |
1,925 |
5,775 |
2,811 |
7,507 |
4,807 |
3,546 |
2,481 |
6,938 |
5,365 |
3,744 |
4,089 |
|
Cost of sales |
1,346 |
4,014 |
2,076 |
5,466 |
3,865 |
2,557 |
1,934 |
5,431 |
4,020 |
2,756 |
2,945 |
|
Gross profit |
579 |
1,762 |
736 |
2,042 |
942 |
989 |
548 |
1,507 |
1,344 |
986 |
1,143 |
|
SG&A expenses |
696 |
855 |
783 |
924 |
792 |
744 |
678 |
925 |
816 |
826 |
805 |
|
Operating income |
-117 |
907 |
-47 |
1,117 |
150 |
245 |
-131 |
382 |
528 |
160 |
338 |
|
Non-operating income |
4 |
28 |
5 |
5 |
9 |
5 |
51 |
5 |
12 |
8 |
8 |
|
Non-operating expenses |
34 |
38 |
32 |
40 |
55 |
63 |
60 |
10 |
37 |
40 |
34 |
|
Ordinary income |
-147 |
898 |
-75 |
1,083 |
103 |
188 |
-140 |
298 |
502 |
128 |
311 |
|
Extraordinary income |
0 |
0 |
0 |
0 |
0 |
0 |
0 |
3 |
0 |
0 |
|
|
Extraordinary expenses |
0 |
0 |
0 |
0 |
0 |
0 |
0 |
0 |
0 |
||
|
Loss before income taxes |
-147 |
898 |
-75 |
1,083 |
103 |
188 |
-140 |
298 |
506 |
128 |
311 |
|
Total income taxes |
-35 |
312 |
-26 |
349 |
36 |
72 |
-49 |
295 |
183 |
48 |
166 |
|
Net income |
-112 |
585 |
-48 |
734 |
67 |
114 |
-90 |
176 |
323 |
79 |
145 |
|
[Balance Sheets] |
|||||||||||
|
Current assets |
16,007 |
15,596 |
17,458 |
18,095 |
18,816 |
20,798 |
20,577 |
19,040 |
17,554 |
17,371 |
18,769 |
|
Property for sale |
13,129 |
12,290 |
14,890 |
13,493 |
14,655 |
16,923 |
17,312 |
14,424 |
13,493 |
12,586 |
13,134 |
|
Non-current assets |
1,230 |
1,206 |
1,229 |
1,199 |
1,188 |
1,164 |
1,197 |
1,030 |
951 |
1,054 |
1,081 |
|
Tangible assets |
469 |
471 |
462 |
456 |
451 |
449 |
443 |
306 |
291 |
290 |
293 |
|
Investments and other assets |
694 |
666 |
689 |
669 |
668 |
653 |
691 |
655 |
595 |
703 |
732 |
|
Total assets |
17,236 |
16,802 |
18,686 |
19,294 |
20,004 |
21,962 |
21,774 |
20,071 |
18,505 |
18,425 |
19,849 |
|
Current liabilities |
6,904 |
6,996 |
9,135 |
9,047 |
9,883 |
7,767 |
7,699 |
5,772 |
5,517 |
7,540 |
8,633 |
|
Short-term borrowings |
5,645 |
5,360 |
7,702 |
7,203 |
7,729 |
6,352 |
6,676 |
4,463 |
4,272 |
6,105 |
7,171 |
|
Non-current liabilities |
1,714 |
602 |
389 |
351 |
345 |
4,303 |
4,274 |
4,232 |
2,919 |
792 |
976 |
|
Long-Term Borrowings |
1,347 |
222 |
3,958 |
3,929 |
3,879 |
2,570 |
483 |
683 |
|||
|
Total liabilities |
8,618 |
7,598 |
9,524 |
9,399 |
10,228 |
12,071 |
11,973 |
10,004 |
8,436 |
8,332 |
9,609 |
|
Total net assets |
8,618 |
9,204 |
9,162 |
9,895 |
9,776 |
9,891 |
9,801 |
10,067 |
10,070 |
10,093 |
10,240 |
|
Total shareholders’ equity |
8,618 |
9,204 |
9,162 |
9,895 |
9,776 |
9,891 |
9,801 |
10,067 |
10,070 |
10,093 |
10,240 |
|
Capital stock |
811 |
811 |
814 |
814 |
818 |
818 |
818 |
818 |
818 |
820 |
821 |
|
Legal capital reserve |
772 |
772 |
775 |
775 |
779 |
779 |
779 |
779 |
779 |
781 |
782 |
|
Retained earnings |
7,031 |
7,616 |
7,568 |
8,302 |
8,174 |
8,289 |
8,200 |
8,465 |
8,577 |
8,656 |
8,802 |
|
Stock acquisition right |
4 |
4 |
4 |
4 |
4 |
4 |
4 |
4 |
4 |
4 |
4 |
|
Total liabilities and net assets |
17,236 |
16,802 |
18,686 |
19,294 |
20,004 |
21,962 |
21,774 |
20,071 |
18,505 |
18,425 |
19,849 |
|
[Statements of cash flows] |
|||||||||||
|
Cash flow from operating activities |
-286 |
-419 |
-3,683 |
-916 |
2,110 |
||||||
|
Loss before income taxes |
750 |
1,758 |
291 |
712 |
635 |
||||||
|
Cash flow from investing activities |
-27 |
-70 |
-9 |
-287 |
-26 |
||||||
|
Cash flow from financing activities |
-446 |
984 |
3,021 |
952 |
-2,129 |
||||||
|
Net increase in cash and cash equiv. |
-760 |
493 |
-671 |
-251 |
-46 |
||||||
|
Cash and cash equiv. at beginning of period |
3,465 |
3,465 |
3,958 |
3,958 |
3,707 |
||||||
|
Cash and cash equiv. at end of period |
2,704 |
3,958 |
3,287 |
3,707 |
3,661 |
Source: Omega Investment from company materials