2026-07-27
Home
Japanese

Omega Investment Co., Ltd.
Digital Hearts Holdings (Company Note 3Q update)

| Share price (3/8) | ¥1,576 | Dividend Yield (22/3 CE) | 0.95 % |
| 52weeks high/low | ¥2,700 / 1,354 | ROE(TTM) | 24.56 % |
| Avg Vol (3 month) | 185.0 thou shrs | Operating margin (TTM) | 10.32 % |
| Market Cap | ¥37.6 bn | Beta (5Y Monthly) | 1.13 |
| Enterprise Value | ¥33.0 bn | Shares Outstanding | 23.890 mn shrs |
| PER (22/3 CE) | 18.9 X | Listed market | TSE 1st section |
| PBR (21/3 act) | 4.99 X |
| Click here for the PDF version of this page |
| PDF Version |
Strong performance in all business segments.
A 30% uplift in full-year OP guidance, to look at 40% growth YoY
◇Summary of Financial Results for Q3 FY2022/3
The company‘s Enterprise business grew enormously with the tailwind of accelerating DX, while the Entertainment business ran ahead of the forecasts. In addition to the M&A effect, organic growth was +17%. These resulted in a 30% YoY increase in nine-month consolidated sales, and operating profit rose 80% YoY. Consequently, the management raised its full-year operating profit forecast by about 30%. Since hitting a high on 13 December 2021, the share price has adjusted by around 40%, affected by the global growth stock sell-off. Considering the growth outlook in the future, we would see the current PER of 19.8x as undervalued.
◇Results for Q3 FY2022/3: Record level of sales and profits achieved
The company‘s Q3 results for FY2022/3 show strong performance in both Enterprise and Entertainment businesses. Sales of Enterprise business, which is the company’s focus, grew by 66%, driven by the acceleration of DX. In the Entertainment business, sales rose 15% YoY thanks to the M&A contribution and the strong performance of the Domestic debugging business. Overall, sales grew by 30% (to 21,246 million yen), or a 17% underlying growth excluding the M&A contribution.
An improvement in gross profit margin (+1.2% YoY) and robust top-line sales led to higher gross profit over the nine-month period. SG&A expenses were under reasonable control. The segment income of Enterprise business shot up 11 times YoY. The entertainment business, a cash cow, saw its profit rise 34% YoY to 2,884 million yen. All in all, the company booked OP of 2,123 million yen marking a 79.5% YoY growth. This already exceeds the historic-high annual profit registered in FY2016/3. The operating margin increased by 2.7% to 10.0%.
◇Full year forecast for FY2022/3: Operating profit forecast revised up by approx 30%
Following the Q3 results, the company raised its full-year forecast (see table below). The new sales forecast of 29.0 billion yen consists of 11.2 billion yen from Enterprise business (+60.1% YoY) and 17.8 billion yen from Entertainment business (+13.5% YoY). The market environment is favourable in Enterprise segment thanks to the accelerating DX. The company is working to win new orders through aggressive sales activities, hiring and training engineers, and strengthening cross-selling in areas such as test automation and security. The company won many domestic debugging projects for console games at a pace ahead of the plan in the Entertainment business. As per the global business, synergies from the acquisition of the DIGITAL HEARTS CROSS Group is already contributing to business results. To summarise, the main reasons for the upward revision are sales growth, high-profit projects, improving profitability by efficient project management and progress in cost control.
Over the past nine months, the company has achieved 73.3% of its revised full-year sales forecast and 78.6% vis-a-vis the operating profit guidance.
* In the text, unless otherwise stated, changes refer to year-on-year comparisons (cumulative basis).
JPY, mn, % |
Net sales |
YoY
|
Oper.
|
YoY
|
Ord.
|
YoY
|
Profit
|
YoY
|
EPS
|
DPS
|
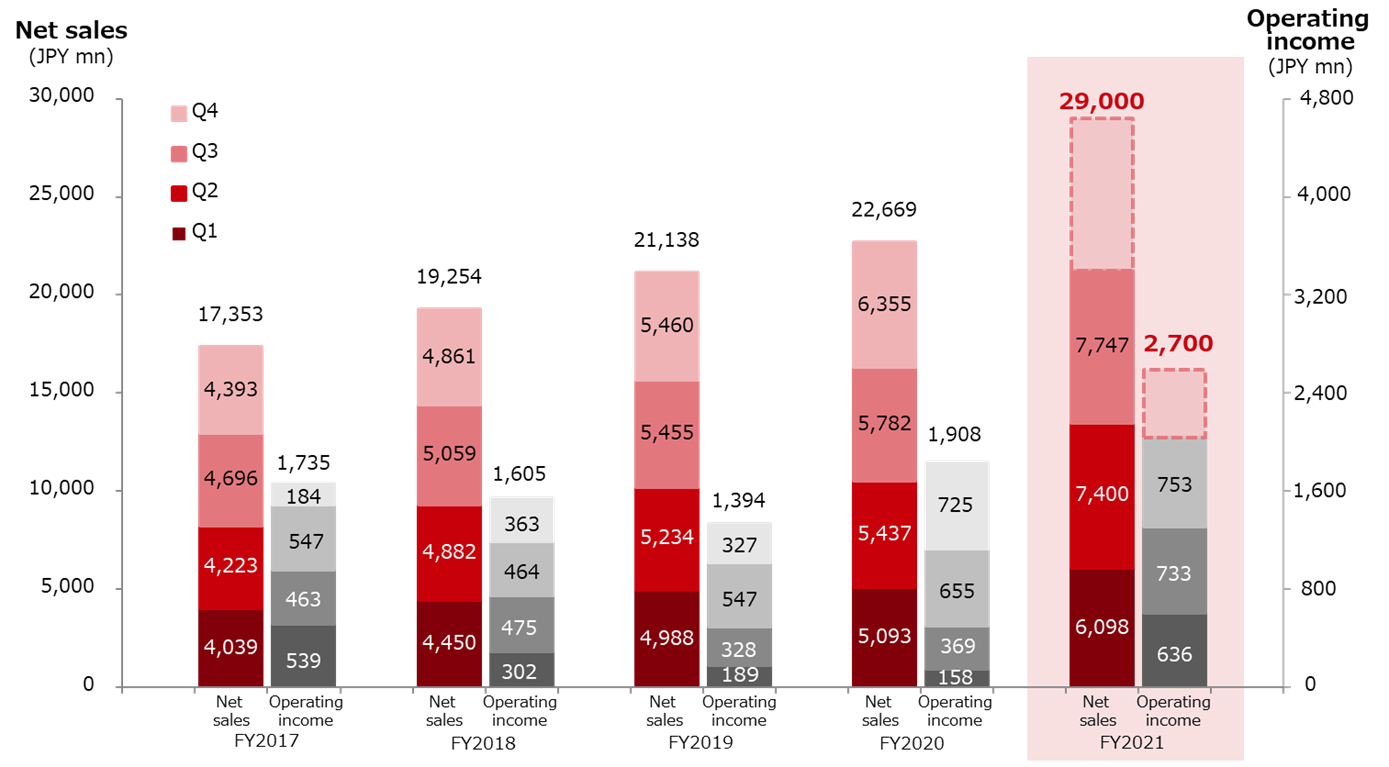
| 2018/3 | 17,353 | 12.4 | 1,735 | -9.0 | 1,782 | -10.8 | 1,200 | 50.9 | 55.14 | 11.50 |
| 2019/3 | 19,254 | 11.0 | 1,605 | -7.5 | 1,651 | -7.4 | 1,575 | 31.3 | 72.13 | 13.00 |
| 2020/3 | 21,138 | 9.8 | 1,394 | -13.2 | 1,372 | -16.9 | 792 | -49.7 | 36.31 | 14.00 |
| 2021/3 | 22,669 | 7.2 | 1,908 | 36.9 | 1,975 | 43.9 | 974 | 23.0 | 45.15 | 14.00 |
| 2022/3 (old CE) | 28,420 | 25.4 | 2,100 | 10.0 | 2,100 | 6.3 | 1,400 | 43.7 | 64.77 | 15.00 |
| 2022/3 (new CE) |
29,000 | 27.9 | 2,700 | 41.5 | 2,800 | 41.7 | 1,800 | 84.7 | 83.24 | 15.00 |
| 2021/3 3Q | 16,313 | 4.1 | 1,183 | 11.0 | 1,245 | 18.0 | 794 | 21.7 | 36.82 | – |
| 2022/3 3Q | 21,246 | 30.2 | 2,123 | 79.5 | 2,192 | 76.0 | 1,363 | 71.6 | 63.05 | – |
Full year consolidated sales / operating profit trend
◇Trends by segment:
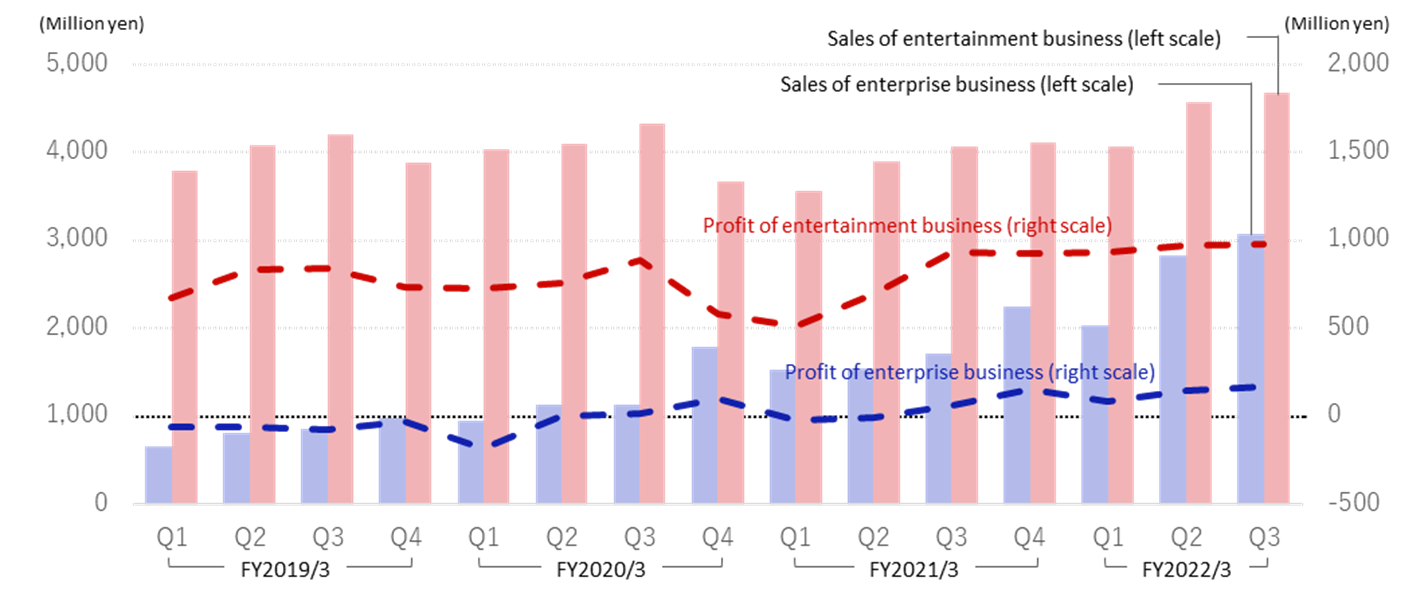
1) Enterprise business: Revenue up by 60% (7,937million yen), profit margin recorded 5.1%
The acceleration of DX and the recent M&A activity (see figure on next page) boosted sales. The company established profitability of this segment, with the segment income shooting up 11 times YoY to 403 million yen. The profit margin was 5.1%, overriding the amortization of goodwill on M&A.
System testing: Sales: 3,395 million yen (+35.7%). In addition to aggressive marketing, the reinforcement of cross-selling was successful. From Q2, MK Partners and TPP SOFT, which LogiGear acquired, contributed to the results. In addition, existing businesses achieved double-digit sales growth. Despite the consistent investment to grow this key segment, the company maintains a high gross profit margin of 34.4%. It aims to differentiate itself from the competition by leveraging game debugging resources and test automation services.
Sales/Profit by Segment
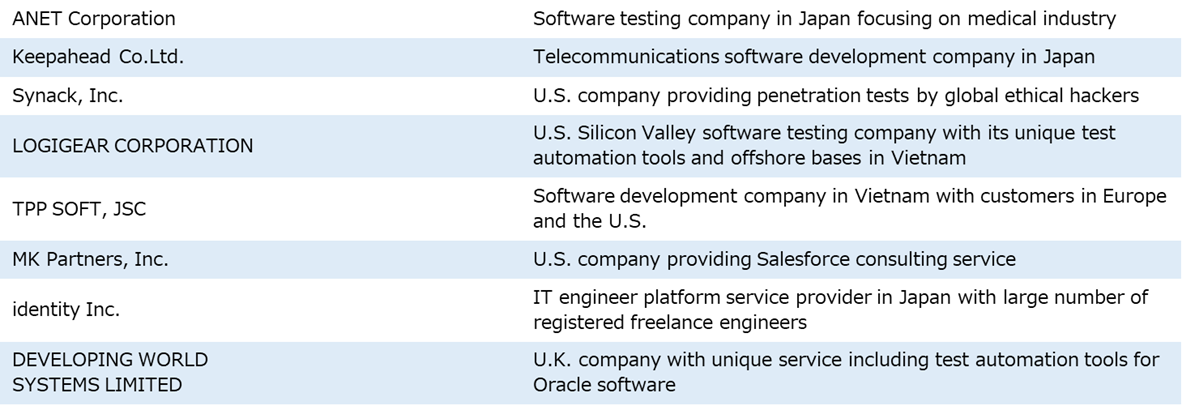
Mergers and acquisitions in Enterprise business
IT Service / Security: Sales doubled (to 4.5 billion yen) on the back of accelerating DX and the expansion of remote working. ”identity Inc.”, acquired in June 2021, also contributed. The company has strengthened its human resources. Even excluding the effect of the acquisition, the company has achieved double-digit sales growth in all services, i.e., contract development and SES, maintenance and operation, and security.
2) Entertainment business: A 15% increase in sales (13,308 million yen) and a 34% rise in segment profit.
Domestic debugging for console games was solid. Sales of Global and others increased by nearly 40% thanks to the corporate acquisitions. Profits rose 34% to 2,884 million yen on strong sales and better gross profit margins for Domestic debugging. The company’s cash cow continues to generate high levels of profit. The segment profit margin remained high at 21.7%.
Domestic debugging: Sales increased by 7.4% (9,111 million yen). The development of new titles for major console games in Japan has been active and strong. Since 3Q FY2021/3, this business has recovered from the impact of COVID-19 and secured a gross profit margin of over 30%.
Global and Other: Sales increased by 37.3% (4,196 million yen). The company won cross-border and global projects on the back of a positive market environment. The company delivered double-digit sales growth in Global, Creative, and Media and others. From Q2, the DIGITAL HEARTS CROSS Group (DHX, formerly Metaps Entertainment Limited, acquired in March 2021) made a significant contribution to the business performance.
◇ Growth strategy update, etc.
The company runs a growth strategy to achieve sales of 50 billion yen in FY2024/3. On top of organic growth, it plans to raise 5-10 billion yen by M&A. Based on the sales forecast for the current year, this translates into a top-line CAGR of 30% over the next two years. In FY2022/3 alone, the company expects to achieve a ca 30% rise in sales by M&A contributions and steady growth in existing businesses. We think the same degree of growth is achievable beyond this year. The company’s core Entertainment business is generating good cash from Domestic debugging, which should provide funds for further M&A. In addition, the company’s services, which M&A has already expanded, are generating enough revenue to cover the amortization of goodwill. Hopefully, the company should achieve sales of 50 billion yen.
Growth story
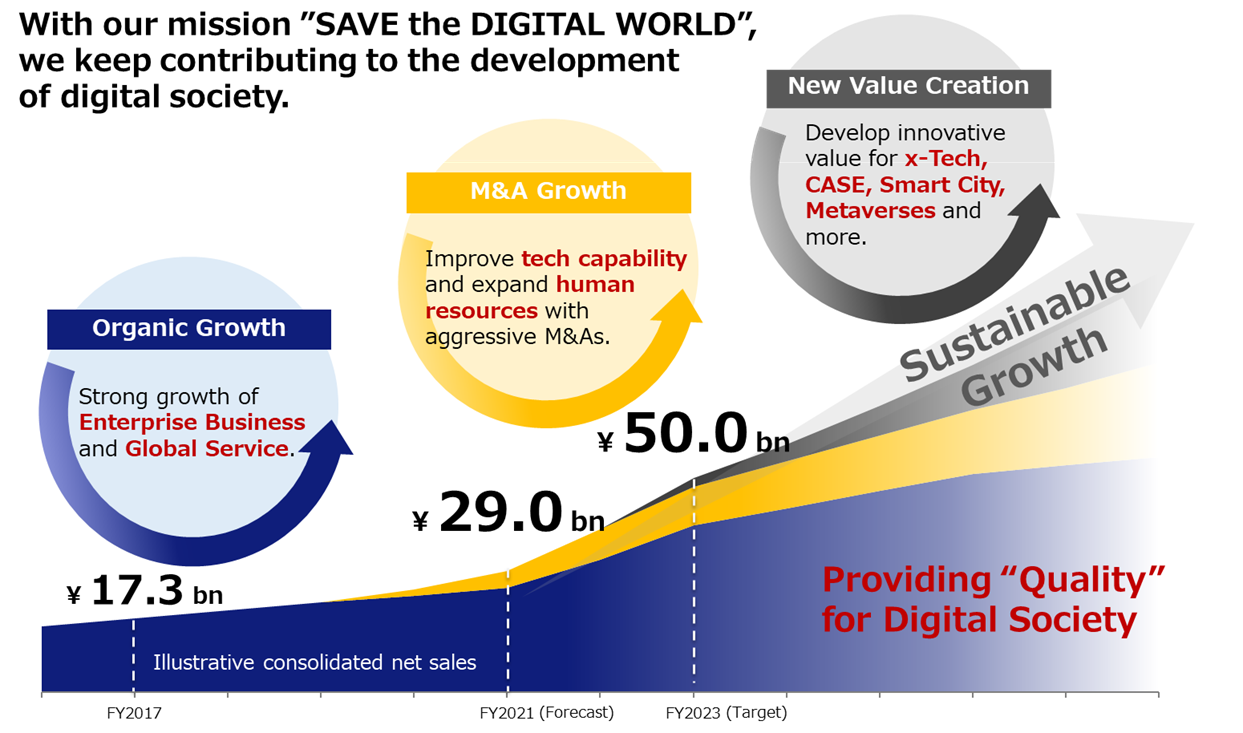
With FY2024/3 numbers now in sight, the company has revealed guidance on how it envisages growth from FY2024/3 onwards (see above): the transition to the second business phase in FY2018/3 marked a significant shift from a single focus on game debugging. The company expects Enterprise business to account for about half the consolidated sales in FY2024/3. From FY2024/3 onwards, it aims to provide innovative value through new business areas like metaverse. As previously announced, in April 2022, the company will spin out its Enterprise business from a single business unit into an independent corporation called AGEST Inc. AGEST will launch various projects and take on the challenge to create innovative value as described above.
◇ Share price: Affected by growth stock adjustment, but undervalued given growth outlook
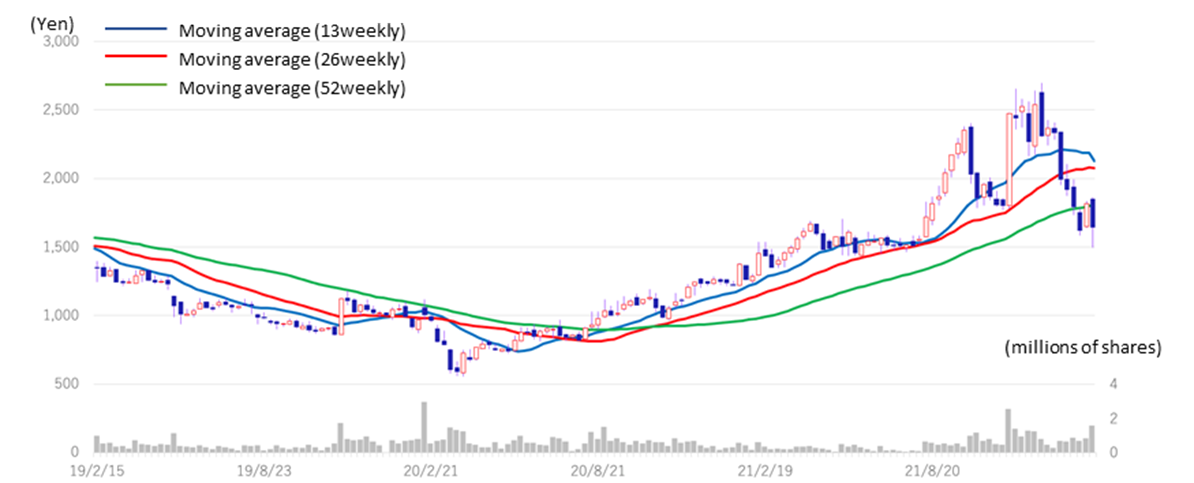
The share price hit a record high at 2,700 yen on 13 December 2021 after the announcement of the Q2 results but has fallen amidst the global repricing of growth stocks. The economic environment may affect the shares and the equity market moves during CY2022. Still, the company’s fundamentals are tracking a steady growth trajectory, as shown by the Q3 results. The latest share price adjustment should be closely monitored.
Digital Hearts Holdings (3676) Share Price Trend (3Year-to-date)
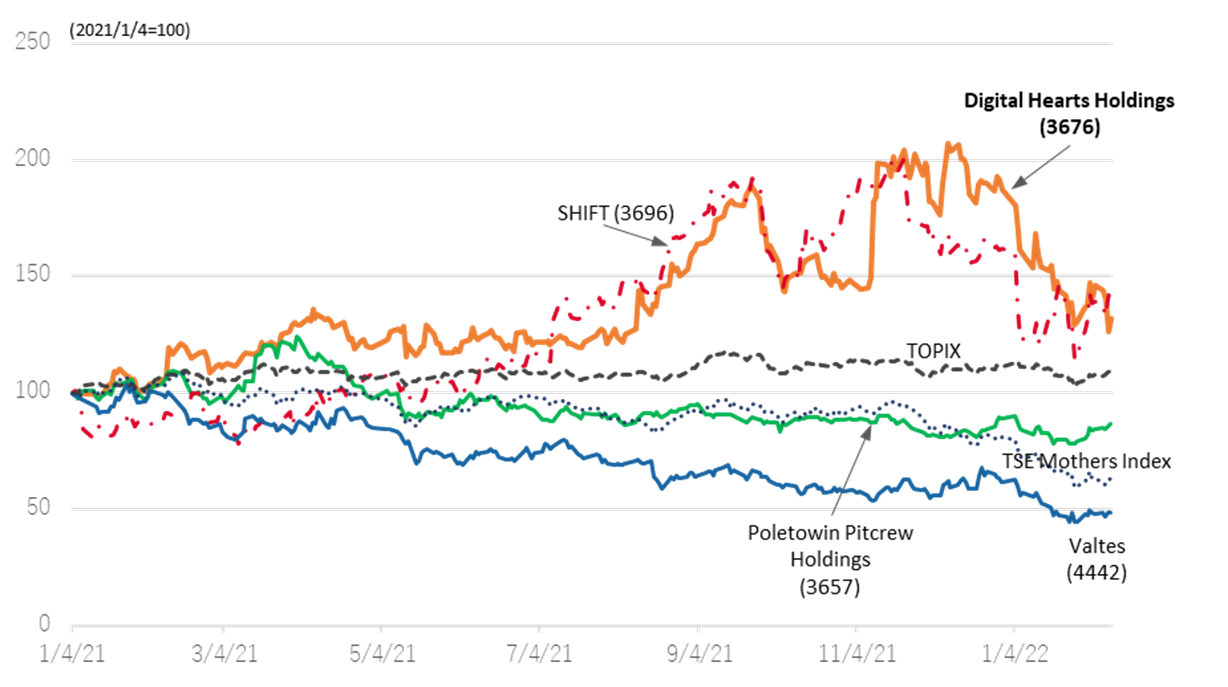
The following chart compares the share price performance of four software testing companies. Both the company and SHIFT (TSE: 3696) were on an upward trajectory since the beginning of CY2021 but have adjusted sharply since last autumn. SHIFT‘s sales composition is over 90% enterprise, and the company’s shares are awarded with high PER thanks to the rapid business expansion by M&A. The company’s revenue proportion of enterprise business is now around 40%, and M&A activities have been steady. From a valuation perspective, it may be better to view the company as an enterprise-focused high-tech company.
Share price performance (four software testing companies, TOPIX, TSE Mothers Index)
Software Testing four Companies Comparison
| Code | 3676 | 3657 | 3697 | 4442 | |
| Company name | Digital Hearts Holdings |
Poletowin Pitcrew Holdings |
SHIFT | Valtes | |
| Financial year | March, 2021 | January, 2021 | August, 2021 | March, 2021 | |
| Share price (2/10) | 1,647 | 1,007 | 21,470 | 1,071 | |
| Market cap. (millions of yen) | 39,387 | 37,927 | 287,470 | 7,329 | |
| PER (X) | 19.8 | 17.4 | 144.1 | 23.2 | |
| PBR (X) | 5.21 | 2.21 | 13.96 | 4.62 | |
| Percentage fall from recent peak | -39.0 | -31.4 | -27.4 | -45.9 | |
| Peak year/month/day | 2021/12/13 | 2021/4/2 | 2021/11/18 | 25/1/2021 | |
| Financial indicators | |||||
| ROE | 17.1 | 13.5 | 12.6 | 16.5 | |
| ROA | 6.8 | 10.4 | 8.2 | 9.7 | |
| ROIC | 13.1 | 17.6 | 8.6 | 14.2 | |
| DPS (plan, yen) | 15.00 | 14.00 | 0.00 | 0.00 | |
| Financial data (TTM basis) | |||||
| Net sales | 27,602 | 31,860 | 50,853 | 6,250 | |
| Three years growth rate | 14.4 | 10.8 | 58.4 | 17.4%* | |
| Operating profit | 2,857 | 3,218 | 5,400 | 376 | |
| Three years growth rate | 23.7 | 9.5 | 65.1 | 26.5* | |
| Operating profit margin | 10.4 | 10.7 | 10.6 | 6.0 | |
* Two years growth rate for VALTES
Source: Each company data
Financial data I
2020/3 |
2021/3 |
2022/3 |
|||||||||
1Q |
2Q |
3Q |
4Q |
1Q |
2Q |
3Q |
4Q |
1Q |
2Q |
3Q |
|
[Sales by segment] |
|||||||||||
Net sales |
4,988 |
5,234 |
5,455 |
5,460 |
5,093 |
5,437 |
5,782 |
6,355 |
6,098 |
7,400 |
7,747 |
Year on year |
12.1 |
7.2 |
7.8 |
15.0 |
2.1 |
3.9 |
6.0 |
16.4 |
19.7 |
36.1 |
34.0 |
Enterprise business |
954 |
1,140 |
1,133 |
1,794 |
1,523 |
1,540 |
1,710 |
2,246 |
2,029 |
2,833 |
3,074 |
Year on year |
46.3 |
41.5 |
32.0 |
82.5 |
59.6 |
35.1 |
50.9 |
25.2 |
33.2 |
83.9 |
79.7 |
Composition of sales |
19.1 |
21.8 |
20.8 |
32.9 |
29.9 |
28.3 |
29.6 |
35.3 |
33.3 |
38.3 |
39.7 |
System testing |
430 |
570 |
488 |
924 |
788 |
777 |
937 |
1,078 |
1,018 |
1,144 |
1,233 |
Year on year |
65.8 |
99.5 |
33.5 |
91.4 |
83.1 |
36.2 |
92.0 |
16.7 |
29.2 |
47.2 |
31.5 |
Composition of sales |
8.6 |
10.9 |
8.9 |
16.9 |
15.5 |
14.3 |
16.2 |
17.0 |
16.7 |
15.5 |
15.9 |
IT services and security |
523 |
569 |
645 |
869 |
735 |
763 |
772 |
1,167 |
1,011 |
1,688 |
1,841 |
Year on year |
33.4 |
9.5 |
30.9 |
73.9 |
40.4 |
34.1 |
19.8 |
34.3 |
37.5 |
121.2 |
138.2 |
Composition of sales |
10.5 |
10.9 |
11.8 |
15.9 |
14.4 |
14.0 |
13.4 |
18.4 |
16.6 |
22.8 |
23.8 |
Entertainment business |
4,033 |
4,093 |
4,321 |
3,666 |
3,566 |
3,900 |
4,072 |
4,109 |
4,069 |
4,566 |
4,672 |
Year on year |
6.2 |
0.5 |
2.9 |
-5.4 |
-11.6 |
-4.7 |
-5.8 |
12.1 |
14.0 |
17.1 |
14.7 |
Composition of sales |
80.9 |
78.2 |
79.2 |
67.1 |
70.0% |
71.7 |
70.4 |
64.7%. |
66.7 |
61.7 |
60.3 |
New sub-segments |
|||||||||||
Domestic debugging |
2,681 |
2,846 |
2,953 |
2,931 |
3,030 |
3,149 |
|||||
Year on year |
– |
– |
– |
9.3 |
6.4 |
6.7 |
|||||
Composition of sales |
52.7 |
52.4 |
51.1 |
48.1 |
41.0% |
40.7 |
|||||
Global and other |
887 |
1,049 |
1,118 |
1,137 |
1,536 |
1,522 |
|||||
Year on year |
– |
– |
– |
28.2 |
46.3 |
36.1 |
|||||
Composition of sales |
17.4 |
19.3 |
19.3 |
18.7 |
20.8 |
19.7 |
|||||
Old sub-segments |
|||||||||||
Debugging |
3,444 |
3,480 |
3,730 |
3,167 |
3,023 |
3,235 |
3,375 |
3,424 |
– |
– |
– |
Year on year |
10.8 |
6.0 |
6.8 |
-1.5 |
-12.2 |
-7.0 |
-9.5 |
8.1 |
– |
– |
– |
Composition of sales |
69.1 |
66.5 |
68.4 |
58.0 |
59.4 |
59.5 |
58.4 |
53.9 |
– |
– |
– |
Game Consoles |
1,186 |
1,056 |
1,341 |
1,126 |
1,023 |
1,147 |
1,258 |
1,402 |
– |
– |
– |
Year on year |
21.1 |
5.4 |
15.9 |
10.7 |
-13.7 |
8.6 |
-6.2 |
24.5 |
– |
– |
– |
Composition of sales |
23.8 |
20.2 |
24.6 |
20.6 |
20.1 |
21.1 |
21.8 |
22.1 |
– |
– |
– |
Mobile solutions |
2,013 |
2,171 |
2,141 |
1,848 |
1,819 |
1,959 |
2,005 |
1,870 |
– |
– |
– |
Year on year |
1.0 |
1.7 |
2.0 |
-4.9 |
-9.6 |
-9.8 |
-6.4 |
1.2 |
– |
– |
– |
Composition of sales |
40.4 |
41.5 |
39.2 |
33.8 |
35.7 |
36.0 |
34.7 |
29.4 |
– |
– |
– |
Amusement |
245 |
253 |
248 |
193 |
179 |
130 |
111 |
153 |
– |
– |
– |
Year on year |
77.5 |
75.7 |
4.6 |
-24.3 |
-26.9 |
-48.6 |
-55.2 |
-20.7 |
– |
– |
– |
Composition of sales |
4.9 |
4.8 |
4.5 |
3.5 |
3.5 |
2.4 |
1.9 |
2.4 |
– |
– |
– |
Creative |
350 |
307 |
282 |
285 |
311 |
367 |
372 |
398 |
– |
– |
– |
Year on year |
-31.4 |
-45.2 |
-33.1 |
-27.6 |
-11.2 |
19.6 |
32.0 |
39.2 |
– |
– |
– |
Composition of sales |
7.0 |
5.9 |
5.2 |
5.2 |
6.1 |
6.8 |
6.4 |
6.3 |
– |
– |
– |
Media and others |
238 |
306 |
308 |
212 |
234 |
294 |
324 |
286 |
– |
– |
– |
Year on year |
35.5 |
32.6 |
8.7 |
-19.4 |
-1.5 |
-3.9 |
5.0 |
34.5 |
– |
– |
– |
Composition of sales |
4.8 |
5.9 |
5.7 |
3.9 |
4.6 |
5.4 |
5.6 |
4.5 |
– |
– |
– |
Operating profit |
189 |
328 |
547 |
327 |
158 |
369 |
655 |
725 |
636 |
733 |
753 |
Year on year |
-37.2 |
-30.9 |
18.0 |
-9.9 |
-16.4 |
12.4 |
19.7 |
121.3 |
301.3 |
98.5 |
14.9 |
Operating profit margin |
3.8 |
6.3 |
10.0 |
6.0 |
3.1 |
6.8 |
11.3 |
11.4 |
10.4 |
9.9 |
9.7 |
Enterprise business |
-184 |
2 |
14 |
100 |
-21 |
-7 |
64 |
152 |
87 |
144 |
171 |
Year on year |
– |
– |
– |
– |
– |
– |
363.5 |
52.4 |
– |
– |
163.8 |
Segment profit margin |
-19.4 |
0.3 |
1.2 |
5.6 |
-1.4 |
-0.5 |
3.8 |
6.8 |
4.3 |
5.1 |
5.6 |
Entertainment business |
727 |
760 |
891 |
585 |
517 |
700 |
936 |
923 |
930 |
975 |
978 |
Year on year |
7.3 |
-8.8 |
6.1 |
-20.3 |
-28.9 |
-8.0 |
5.0 |
57.9 |
79.9 |
39.3 |
4.5 |
Segment profit margin |
18.0 |
18.6 |
20.6 |
16.0 |
14.5 |
18.0 |
23.0 |
22.5 |
22.9 |
21.4 |
20.9 |
Source: Omega Investment, based on company data
Financial data II
2020/3 |
2021/3 |
2022/3 |
|||||||||
1Q |
2Q |
3Q |
4Q |
1Q |
2Q |
3Q |
4Q |
1Q |
2Q |
3Q |
|
[Statements of income] |
|||||||||||
Net sales |
4,988 |
5,234 |
5,455 |
5,460 |
5,093 |
5,437 |
5,782 |
6,355 |
6,098 |
7,400 |
7,747 |
Cost of sales |
3,772 |
3,830 |
3,949 |
3,953 |
3,819 |
4,002 |
4,001 |
4,700 |
4,271 |
5,290 |
5,579 |
Gross profit |
1,216 |
1,403 |
1,506 |
1,507 |
1,273 |
1,437 |
1,781 |
1,655 |
1,827 |
2,109 |
2,167 |
SG&A expenses |
1.026 |
1,074 |
958 |
959 |
1,115 |
1,067 |
1,126 |
1,150 |
1,191 |
1,375 |
1,414 |
Operating profit |
189 |
328 |
547 |
327 |
158 |
369 |
655 |
725 |
636 |
733 |
753 |
Non-operating income |
3 |
2 |
1 |
1 |
38 |
10 |
24 |
5 |
38 |
31 |
12 |
Non-operating expenses |
3 |
7 |
7 |
7 |
2 |
3 |
4 |
10 |
4 |
4 |
5 |
Ordinary profit |
189 |
323 |
542 |
542 |
194 |
376 |
675 |
720 |
670 |
760 |
759 |
Extraordinary income |
0 |
0 |
0 |
19 |
32 |
|
13 |
66 |
1 |
||
Extraordinary expenses |
0 |
0 |
75 |
82 |
13 |
16 |
415 |
2 |
42 |
32 |
|
Net profit before income taxes |
189 |
323 |
542 |
240 |
113 |
381 |
691 |
318 |
681 |
785 |
730 |
Total income taxes |
77 |
159 |
162 |
99 |
38 |
122 |
224 |
145 |
189 |
281 |
233 |
Net profit attributable to
|
112 |
165 |
375 |
139 |
99 |
256 |
438 |
180 |
487 |
429 |
445 |
[Balance Sheets] |
|||||||||||
Current assets |
6,717 |
7,574 |
7,710 |
7,453 |
6,648 |
7,291 |
8,017 |
9,744 |
9,604 |
9,848 |
10,658 |
Cash and deposits |
3,650 |
3,849 |
3,882 |
3,739 |
3,027 |
3,482 |
4,085 |
5,076 |
4,911 |
5,435 |
5,746 |
Notes and accounts receivable |
2,677 |
3,017 |
3,013 |
2,985 |
2,889 |
3,099 |
3,201 |
4,097 |
|||
Notes, accounts receivable andcontract assets |
4,161 |
3,872 |
4,372 |
||||||||
Non-current assets |
2,481 |
3,252 |
3,227 |
3,184 |
3,205 |
3,167 |
3,160 |
4,593 |
6,321 |
6,178 |
6,342 |
Tangible fixed assets |
545 |
646 |
627 |
579 |
560 |
549 |
565 |
598 |
602 |
623 |
621 |
Intangible fixed assets |
793 |
1,404 |
1,390 |
1,379 |
1,445 |
1,424 |
1,433 |
2,670 |
4,389 |
4,244 |
4,225 |
Goodwill |
491 |
1,066 |
1,033 |
1,027 |
1,032 |
991 |
950 |
2,467 |
4,175 |
4,042 |
3,945 |
Investments and other assets |
1,142 |
1,202 |
1,209 |
1,225 |
1,199 |
1,193 |
1,161 |
1,324 |
1,330 |
1,309 |
1,495 |
Total assets |
9,199 |
10,827 |
10,938 |
10,637 |
9,854 |
10,459 |
11,177 |
14,338 |
15,925 |
16,026 |
17,001 |
Current liabilities |
3,621 |
4,679 |
4,863 |
5,135 |
4,450 |
4,655 |
5,061 |
7,904 |
8,954 |
8,775 |
9,354 |
Short-term borrowings |
1,704 |
2,504 |
2,506 |
2,546 |
2,546 |
2,551 |
2,552 |
4,728 |
5,534 |
5,406 |
5,406 |
Non-current liabilities |
622 |
624 |
629 |
63 |
62 |
132 |
135 |
119 |
294 |
55 |
58 |
Long-term debt |
48 |
46 |
48 |
– |
– |
66 |
65 |
63 |
236 |
– |
– |
Total liabilities |
4,243 |
5,304 |
5,493 |
5,198 |
4,513 |
4,788 |
5,196 |
8,024 |
9,249 |
8,830 |
9,413 |
Total net assets |
4,955 |
5,523 |
5,445 |
5,438 |
5,340 |
5,670 |
5,980 |
6,314 |
6,677 |
7,196 |
7,588 |
Shareholders’ equity |
4,734 |
5,039 |
4,919 |
4,898 |
4,841 |
5,172 |
5,460 |
5,642 |
5,983 |
6,436 |
6,719 |
Capital |
300 |
300 |
300 |
300 |
300 |
300 |
300 |
300 |
300 |
300 |
300 |
Legal capital reserve |
366 |
357 |
357 |
355 |
355 |
331 |
331 |
331 |
331 |
338 |
338 |
Retained earnings |
6,378 |
6,543 |
6,765 |
6,904 |
6,848 |
7,105 |
7,393 |
7,575 |
7,916 |
8,342 |
8,626 |
Treasury shares |
-2,311 |
-2,162 |
-2,503 |
-2,662 |
-2,662 |
-2,565 |
-2,565 |
-2,565 |
-2,565 |
-2,545 |
-2,546 |
Stock acquisition right |
13 |
13 |
13 |
13 |
13 |
13 |
13 |
13 |
– |
– |
– |
Total liabilities and net assets |
9,199 |
10,827 |
10,938 |
10,637 |
9,854 |
10,459 |
11,177 |
14,338 |
15,925 |
16,026 |
17,001 |
[Statements of cash flows] |
|||||||||||
Cash flow from operating activities |
-5 |
1,086 |
101 |
1,416 |
1,703 |
||||||
Net profit before tax and otheradjustments |
513 |
1,296 |
494 |
1,504 |
1,466 |
||||||
Cash flow from investing activities |
-963 |
1,018 |
-261 |
-1,813 |
-1,682 |
||||||
Cash flow from financing activities |
|
637 |
|
-515 |
|
-90 |
|
1,730 |
|
316 |
|
Free cash flow |
958 |
68 |
362 |
3,229 |
3,385 |
||||||
Cash and cash equivalents
|
-347 |
-458 |
-252 |
1,341 |
359 |
||||||
Cash and cash equivalents
|
4,162 |
4,162 |
3,704 |
3,704 |
5,041 |
||||||
Cash and cash equivalents
|
3,814 |
3,704 |
3,447 |
5,041 |
5,400 |
Source: Omega Investment, based on company data