2026-07-09
Home
Japanese

Omega Investment Co., Ltd.
Chiome Bioscience (Company Note 4Q upadate)

| Share price (3/14) | ¥176 | Dividend Yield (22/12 CE) | – % |
| 52weeks high/low | ¥386/156 | ROE(TTM) | -59.16 % |
| Avg Vol (3 month) | 458.3 thou shrs | Operating margin (TTM) | -187.16 % |
| Market Cap | ¥7.5 bn | Beta (5Y Monthly) | 1.11 |
| Enterprise Value | ¥4.7 bn | Shares Outstanding | 42.409 mn shrs |
| PER (22/12 CE) | – X | Listed market | TSE Mothers |
| PBR (21/12 act) | 2.72 X |
| Click here for the PDF version of this page |
| PDF Version |
CBA-1205 trial progresses to the second half of the Phase I trial.
On track to procure funds for drug development and investment.
◇Summary of financial results for FY12/2021
Each pipeline is progressing well in the drug discovery and development business; CBA-1205 is in the second half of Phase I trials, and CBA-1535 will be filed for clinical trials in Japan. In FY12/2021, sales grew by 48.3% YoY (to 712 million yen) driven by the drug discovery support business. The operating loss increased to 1.33 billion yen from 1.28 billion yen in the previous year. The company is on track to procure approximately 1.7 billion yen in financing through the issue of new share warrants in December 2021.
The share price of Japanese drug discovery ventures has continued to decline in the aftermath of the global growth stock adjustment. Chiome’s share price has also been sliding down since hitting a high at 386 yen on 8 July 2021. While it is difficult to resist the market trend, the company’s drug discovery projects are making steady progress. We expect the share price to react to the announcement of events that point to earnings creation, such as licence agreements with partners and milestone revenues, in the future.
◇Results for FY12/2021: 48% YoY increase in revenue, operating loss of 1.3 billion yen.
Chiome Bioscience’s financial results for FY12/2021 show a 48.3% increase in sales (to 712 million yen) driven primarily by a 27.6% rise in the revenue of the drug support business. The operating loss registered 1,334 million yen versus 1,283 million yen in FY12/2020.
Sales in the drug discovery and development business were 103 million yen (the previous year: 3 million yen), including an upfront payment for the LIV-2008/2008b licence agreement. Sales in the drug discovery support business registered 609 million yen, increasing by 132 million yen thanks to stable business with existing customers, mainly domestic pharmaceutical companies. Regarding costs, the company spent 1,312 million yen on research and development, raising the expenditure by 155 million yen YoY. This incurred costs for CBA-1535 investigational drug manufacturing and other CMC development expenses.
In BS, cash and deposits at the end-December 2021 were 1,790 million yen, a decrease of 895 million yen YoY. Also, fixed assets decreased by 124 million yen due to a valuation loss on investment securities of a portfolio company. Total net assets amounted to 1,893 million yen due to a decrease of 1,479 million yen in retained earnings as a result of the net loss. This compares to the net assets of 3,109 million yen at the end of the previous year. Total assets were 2,339 million yen (previous year-end: 3,494 million yen). Capital and capital reserves increased by 128 million yen each due to the exercise of subscription rights. The equity ratio fell by 8.8 points YoY to 79.4% from last year’s 88.2%.
| JPY, mn, % | Net sales | YoY % |
Oper. profit |
YoY % |
Ord. profit |
YoY % |
Profit ATOP |
YoY % |
EPS (¥) |
| 2017/12 | 259 | 3.0 | -887 | – | -883 | – | -882 | – | -33.48 |
| 2018/12 | 212 | -18.1 | -1,539 | – | -1,533 | – | -1,533 | – | -57.26 |
| 2019/12 | 447 | 110.3 | -1,401 | – | -1,410 | – | -1,403 | – | -44.61 |
| 2020/12 | 480 | 7.4 | -1,283 | – | -1,291 | – | -1,293 | – | -36.06 |
| 2021/12 | 712 | 48.3 | -1,334 | – | -1,329 | – | -1,479 | – | -36.74 |
| 2022/12 (CE) | – | – | – | – | – | – | – | – | – |
Drug discovery and development business – pipeline
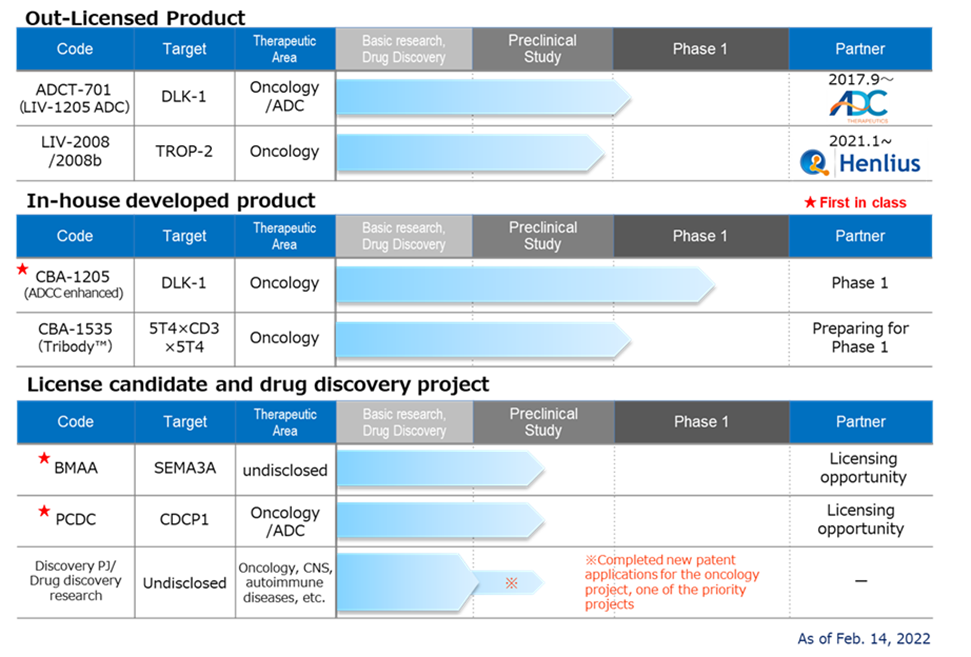
◇Pipeline progress
<Out-licensed products>
*LIV-1205; Out-licensed to ADC Therapeutics, Switzerland, for ADC use only. Preparations are underway for IND filing and clinical trials in 2022 as ADCT-701. Collaboration with the National Cancer Institute (NCI) in the US for neuroendocrine cancer is also planned.
*LIV-2008;In January 2021, the company signed a licence agreement with Shanghai Henlius Biotech, Inc. in China. It licensed the rights to develop, manufacture and market the product in China, Taiwan, Hong Kong and Macau. As mentioned above, an upfront payment (USD 1 million) received from the signing of this agreement has been registered as sales. Licensing activities are ongoing outside of Henlius.
<In-house developed product>
*CBA-1205;The company completed “the enrollment of patients in” the first half part of a phase 1 trial in patients with solid tumours conducted at the National Cancer Centre. The clinical trial process showed that the target and this antibody were safe, and higher than anticipated dose of safety data were obtained. The development schedule is progressing well. At the end of 2021, the decision has been made to move to the second part of the Phase I study in patients with hepatocellular carcinoma. The company envisages two scenarios for the timing of the out-licensing agreement, i.e., out-licensing based on data from the first part as early as 2023 or no later than 2025.
*CBA-1535; The company established the Tribody manufacturing process and completed the production of GMP API and investigational drug substance production. As previously reported, given the impact of the new coronavirus infection, the company decided to replace the initially planned clinical trial in the UK with an application for a clinical trial in Japan, where the impact on development would be less affected. The company submitted a clinical trial notification to the PMDA on 16 February 2022. The trial is the world’s first clinical trial to verify the mechanism of action of Tribody. If the concept is confirmed, it will expand the potential of Tribody’s application to many cancer antigens.
<Out-licensing candidates>
*BMAA;The company obtained in-house opportunities following the termination of the option agreement with SemaThera in May 2021. It finished joint research with overseas research institutes targeted at diseases involving semaphorin 3A. Going forward, business development activities will be linked to the semaphorin 3A data acquired to date and the data from exploratory studies on the semaphorin family.
*PCDC;The company conducted out-licensing activities and additional animal studies, mainly for ADC applications. In July 2021, the World Intellectual Property Organisation published information on the patent application. The target molecule is CDCP1, a first-in-class antibody targeting solid tumours such as lung, head and neck, oesophageal, colorectal and cervical cancer.
*Drug discovery research projects: Other than those listed above, the company will review the out-licensing and development plans for priority projects to enhance the pipeline. Existing projects will be revised or eliminated. Research activities will continue in two of the five priority drug discovery projects. In addition, the company will continue its efforts to create a new drug discovery pipeline in the future by conducting drug discovery research on around ten themes at any one time, including other drug discovery projects.
◇Progress in drug discovery support business: extension of contract research with Chugai Group
As a drug discovery venture, the drug discovery support business is a stable source of income. In October 2021, the company extended its contract research agreements with Chugai Pharmaceutical and Chugai Pharmabody Research, the two early customers. It extended the contract with Chugai Pharmaceutical for three years until 31 December 2024 and with Chugai Pharmabody Research for five years until 31 December 2026.
◇Use and improvement of the ADLib®︎ system
The company continues to utilise and improve its core technology, the ADLib®︎ system. In May 2021, it signed a collaboration agreement with Mologic in the UK to generate antibodies for diagnostic use in infectious diseases using the ADLib®︎ system. In addition, the company acquired a patent in Japan for the ADLib ®︎ system’s method of obtaining antibodies. Furthermore, Tokyo Medical and Dental University announced research results on the development of a treatment for Alzheimer’s disease using anti-HMGB1 obtained with the human ADLib ®︎ system. This should contribute to enhancing technologies related to the drug discovery support business and the strengthening of the in-house drug discovery pipeline.
◇ Fundraising through the issue of subscription rights
On 15 December 2021, the company raised approximately 1.7 billion yen through a private placement of its 18th warrant (with an exercise price amendment clause), with SMBC Nikko Securities as the allottee. The company plans to use the funds for two purposes. First, the development investment to maximise the value of the company’s pipeline. This includes API and investigational drug manufacturing costs for CAB-1205, development research and biomarker search costs to improve the value of CBA-1205, CBA-1535 Phase I late part clinical trials costs and concomitant investigational drug costs. Second, capital investment such as facility purchase, and expansion and replacement of research equipment to sustain growth of drug discovery support business. Securing research and development funds is one of the most critical tasks for drug discovery ventures. The company is on track to secure cash for the next two years or so.
◇FY12/2022 forecast: sales of 620 million yen planned in the drug discovery support business.
As is well known, short-term P/L forecasts for drug discovery ventures are not so meaningful. The company does not disclose its forecast for FY12/2022. Nevertheless, it does expect sales of the drug discovery support business, which generates recurring revenues, to be 620 million yen. Depending on the progress of drug discovery projects, the company may receive upfront payments and milestone revenues. On the other hand, as each pipeline progresses, clinical trial and investigational drug production costs will increase. R&D investment will likely remain in the region of JPY 1 billion yen.
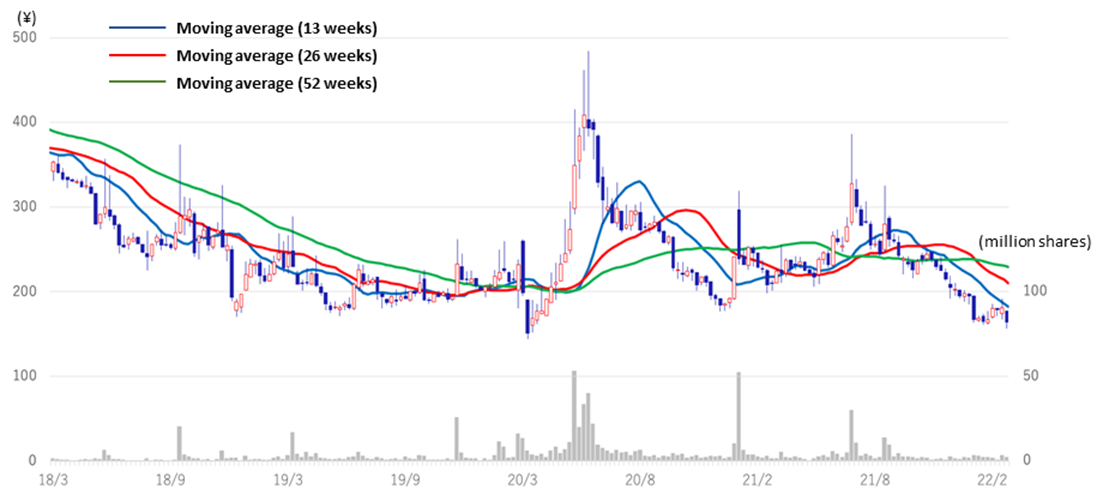
◇Share price trends: affected by biotech stock adjustment
In the aftermath of the global growth stock adjustment, the share prices of Japanese drug discovery ventures have continued a decline. The equity market appears to remain challenging in the rest of 2022 as geopolitical risk emerged on top of macroeconomic uncertainty.
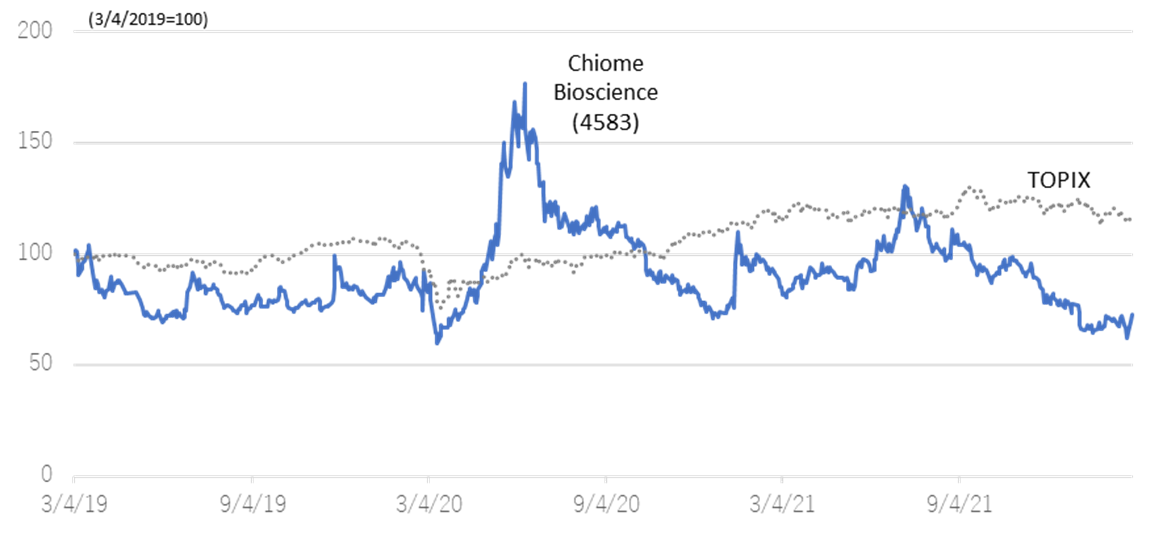
The company’s share price was sent higher on pandemic-related speculation in June 2020, followed by a period of adjustment. Since the beginning of 2021, the share price has been sliding down amidst the downward trend in biotech stocks after hitting a high (JPY 386) on 8 July. Meanwhile, the company’s drug discovery project is making steady progress. The share price should possibly react positively if events are announced in the future that point to earnings creation, such as licence agreements with partners or milestone revenues.
Stock price (5 years)
Relative chart; Chiome Bioscience (4583) and TOPIX (3 years)
Financial data
| FY (¥mn) | 2019/12 | 2020/12 | 2021/12 | |||||||||
| 1Q | 2Q | 3Q | 4Q | 1Q | 2Q | 3Q | 4Q | 1Q | 2Q | 3Q | 4Q | |
| [Statements of income] | ||||||||||||
| Net sales | 64 | 77 | 142 | 165 | 91 | 82 | 139 | 169 | 246 | 139 | 157 | 171 |
| Drug Discovery and Development Business | 0 | 1 | 1 | 28 | 1 | 1 | 0 | 1 | 103 | 0 | 0 | 0 |
| Drug Discovery Support Business | 63 | 76 | 142 | 137 | 90 | 82 | 138 | 168 | 143 | 138 | 157 | 171 |
| Cost of sales | 27 | 26 | 58 | 52 | 61 | 46 | 59 | 70 | 64 | 62 | 78 | 86 |
| Gross profit | 37 | 51 | 84 | 113 | 30 | 36 | 80 | 99 | 182 | 77 | 79 | 84 |
| SG&A expenses | 464 | 374 | 503 | 346 | 456 | 346 | 424 | 303 | 337 | 337 | 515 | 568 |
| R&D expenses | 363 | 273 | 407 | 256 | 343 | 266 | 342 | 206 | 216 | 243 | 401 | 451 |
| Operating loss | -426 | -324 | -419 | -233 | -426 | -310 | -344 | -204 | -155 | -260 | -436 | -483 |
| Non-operating income | 0 | 1 | 4 | 0 | 2 | 0 | 3 | 0 | 7 | 0 | 2 | 4 |
| Non-operating expenses | 6 | 4 | 4 | 0 | 0 | 2 | 10 | 1 | 1 | 0 | 1 | 6 |
| Ordinary loss | -432 | -327 | -418 | -233 | -425 | -311 | -351 | -205 | -150 | -259 | -434 | -486 |
| Extraordinary income | 2 | 1 | 6 | 0 | 0 | 0 | 0 | |||||
| Extraordinary expenses | ||||||||||||
| Loss before income taxes | -430 | -326 | -412 | -233 | -425 | -310 | -351 | -205 | -150 | -247 | -433 | -636 |
| Total income taxes | 1 | 0 | 1 | 0 | 1 | 0 | 1 | 1 | 11 | 1 | 1 | 0 |
| Net loss | -431 | -326 | -413 | -234 | -425 | -311 | -352 | -206 | -161 | -248 | -434 | -637 |
| [Balance Sheets] | ||||||||||||
| Current assets | 3,048 | 3,206 | 2,807 | 2,561 | 2,309 | 2,805 | 3,316 | 3,249 | 3,294 | 3,088 | 2,675 | 2,216 |
| Cash and deposits | 2,776 | 2,899 | 2,469 | 2,106 | 1,967 | 2,472 | 2,881 | 2,686 | 2,580 | 2,302 | 2,071 | 1,790 |
| Non-current assets | 219 | 217 | 242 | 247 | 247 | 249 | 249 | 246 | 244 | 241 | 274 | 122 |
| Tangible assets | 15 | 14 | 12 | 11 | 10 | 9 | 8 | 7 | 6 | 6 | 4 | 4 |
| Investments and other assets | 204 | 204 | 230 | 236 | 237 | 240 | 241 | 238 | 237 | 235 | 269 | 118 |
| Total assets | 3,267 | 3,423 | 3,049 | 2,808 | 2,556 | 3,054 | 3,566 | 3,495 | 3,537 | 3,329 | 2,950 | 2,339 |
| Current liabilities | 177 | 207 | 154 | 145 | 315 | 427 | 378 | 343 | 378 | 428 | 468 | 392 |
| Short-term borrowings | 142 | 199 | 199 | 180 | 180 | 190 | 199 | 183 | ||||
| Non-current liabilities | 41 | 41 | 41 | 41 | 42 | 42 | 42 | 42 | 42 | 42 | 53 | 53 |
| Total liabilities | 219 | 248 | 196 | 187 | 357 | 469 | 420 | 385 | 420 | 470 | 522 | 446 |
| Total net assets | 3,048 | 3,175 | 2,853 | 2,622 | 2,199 | 2,585 | 3,146 | 3,110 | 3,118 | 2,859 | 2,428 | 1,893 |
| Total shareholders’ equity | 3,048 | 3,175 | 2,853 | 2,622 | 2,199 | 2,585 | 3,146 | 3,110 | 3,118 | 2,859 | 2,428 | 1,857 |
| Capital stock | 5,856 | 6,084 | 6,132 | 6,132 | 6,133 | 846 | 1,303 | 1,388 | 1,471 | 1,471 | 1,472 | 1,515 |
| Legal capital reserve | 5,846 | 6,074 | 6,122 | 6,122 | 6,123 | 2,446 | 2,903 | 2,987 | 3,071 | 3,071 | 3,072 | 3,115 |
| Retained earnings | -8,682 | -9,008 | -9,421 | -9,655 | -10,080 | -736 | -1,088 | -1,294 | -1,455 | -1,703 | -2,136 | -2,773 |
| Subscription rights to shares | 28 | 26 | 20 | 22 | 24 | 30 | 28 | 29 | 30 | 19 | 19 | 35 |
| Total liabilities and net assets | 3,267 | 3,423 | 3,049 | 2,808 | 2,556 | 3,054 | 3,566 | 3,495 | 3,537 | 3,329 | 2,950 | 2,339 |
| [Statements of cash flows] | ||||||||||||
| Cash flow from operating activities | -677 | -1,537 | -528 | -1,361 | -560 | -1,139 | ||||||
| Loss before income taxes | -755 | -1,401 | -734 | -1,290 | -396 | -1,466 | ||||||
| Cash flow from investing activities | – | -26 | – | 3 | – | -35 | ||||||
| Purchase of investment securities | – | – | – | – | – | – | ||||||
| Cash flow from financing activities | 1,248 | 1,341 | 894 | 1,944 | 176 | 271 | ||||||
| Proceeds from issuance of common shares | 1,249 | 1,345 | 697 | 1,769 | 166 | 253 | ||||||
| Net increase in cash and cash equiv. | 570 | -222 | 366 | 580 | -384 | -895 | ||||||
| Cash and cash equiv. at beginning of period | 2,328 | 2,328 | 2,105 | 2,105 | 2,686 | 2,686 | ||||||
| Cash and cash equiv. at end of period | 2,899 | 2,105 | 2,472 | 2,686 | 2,301 | 1,790 |
Note) For the cash flow statement, Q2 is the cumulative of Q1 to Q2, and Q4 is the cumulative of Q1 to Q4. Therefore, the beginning balance will be the beginning balance of Q1 for both Q2 and Q4.
Source: Omega Investment from Company materials.