2026-07-27
Home
Japanese

Omega Investment Co., Ltd.
Sansei Landic (Company Note 4Q update)

| Share price (3/28) | ¥806 | Dividend Yield (22/12 CE) | 3.30 % |
| 52weeks high/low | ¥908/778 | ROE(TTM) | 5.98 % |
| Avg Vol (3 month) | 10.94 thou shrs | Operating margin (TTM) | 6.64 % |
| Market Cap | ¥6.74 bn | Beta (5Y Monthly) | 0.89 |
| Enterprise Value | ¥9.42 bn | Shares Outstanding | 8.474 mn shrs |
| PER (22/12 CE) | 8.81 X | Listed market | TSE 1st section |
| PBR (21/12 act) | 0.66 X |
| Click here for the PDF version of this page |
| PDF Version |
Unveiled new medium-term management plan.
The shares may well be revalued as the company returns to a growth trajectory.
◇The company revealed a new medium-term management plan (2022-2024)
Sansei Landic has published its postponed medium-term management plan in conjunction with the announcement of its financial results for FY12/2021. The company’s performance had been in a state of levelling off amid the spread of new coronavirus infections (‘infectious diseases’). The company has designated 2022-24 as a period of ‘qualitative reinforcement’, targeting an operating profit of 1.8 billion yen in 2024. Through further growth, the company aims to be listed on the prime market from 2025 onwards.
◇The share price may well be reassessed with the company returning to a growth trajectory
The company’s share price has continued to underperform due to poor performance as infections spread. The latest PBR is below the historical trend. If the company’s new medium-term management plan shows a return to its pre-infection growth trajectory, the share price may well be reassessed.
◇Results for 3Q FY12/2021: 5% YoY decline in revenue, 30% increase in operating profit.
The company’s 3Q FY12/2021 results showed sales of 16,836 million yen, a YoY decline of 5%. There were some delaying contract negotiations affected by the infectious diseases. Moreover, sales of a large project in the old unutilised properties business, which the company planned to register for the current period, were postponed to the next period. On the other hand, the earnings came in above the forecasts rising YoY due to conservative estimates at the beginning of the period. The company’s results used to be seasonal, with revenues rising sharply in 2Q and 4Q, but this has faded after the spread of infectious diseases.
By segment, the real estate sales business revenue decreased by 3.6% (15,529 million yen), while the segment profit increased by 20.6% (2,333 million yen). On the other hand, the construction business recorded a 21.4% decrease in sales (1,306 million yen) and a segment loss of 145 million yen (segment loss of 4 million yen in the previous year) (see next page for details).
Purchases and orders received were as follows: real estate sales business : 10,118 million yen (-23.9%); construction business (orders received): 1,379 million yen (+26.0%). Purchases in the real estate sales business were down YoY. Still, given the current level of inventories and the progress of the current order stream, there appears to be no problem in achieving the management’s estimates in FY12/2022.
In view of the increased earnings, the company will increase the dividend per share by 1 yen to 26.00 yen at the end of FY12/2021. This will be the eighth consecutive year of dividend increases, bringing the DOE to 2.1%.
◇Forecast for FY12/2022: 8% increase in revenue and 16% increase in operating profit.
As FY12/2022 forecasts, the company has announced sales of 18.2 billion yen (+8%) and operating profit of 1.3 billion yen (+16%). The segment breakdown is as follows: real estate sales business : 16.8 billion yen (+9%); construction business: 1.37 billion yen (+5%). Sales will recover to pre-infection levels, but profits will remain at 70% of pre-infection levels.
| JPY, mn | Net sales | YoY % |
Oper. profit |
YoY % |
Ord. profit |
YoY % |
Profit ATOP |
YoY % |
EPS (¥) |
DPS (¥) |
| 2018/12 | 16,833 | 28.5 | 1,765 | 0.2 | 1,642 | -1.5 | 1,006 | -9.4 | 119.62 | 21.00 |
| 2019/12 | 18,020 | 7.1 | 1,860 | 5.4 | 1,758 | 7.0 | 1,158 | 15.1 | 137.08 | 23.00 |
| 2020/12 | 17,774 | -1.4 | 847 | -54.5 | 709 | -59.7 | 357 | -69.1 | 42.34 | 25.00 |
| 2021/12 | 16,836 | -5.3 | 1,117 | 31.9 | 999 | 40.9 | 609 | 70.5 | 73.56 | 26.00 |
| 2022/12 (CE) | 18,235 | 8.3 | 1.301 | 16.4 | 1,142 | 14.3 | 754 | 23.8 | 91.52 | 27.00 |
| 2021/12 2Q | 9,109 | 9.0 | 689 | 74.3 | 631 | 116.4 | 402 | 120.8 | 48.37 | – |
| 2022/12 2Q (CE) | 7,052 | -22.6 | 395 | -47.2 | 317 | -49.7 | 201 | -49.4 | 24.49 | – |
Quarterly sales and operating profit
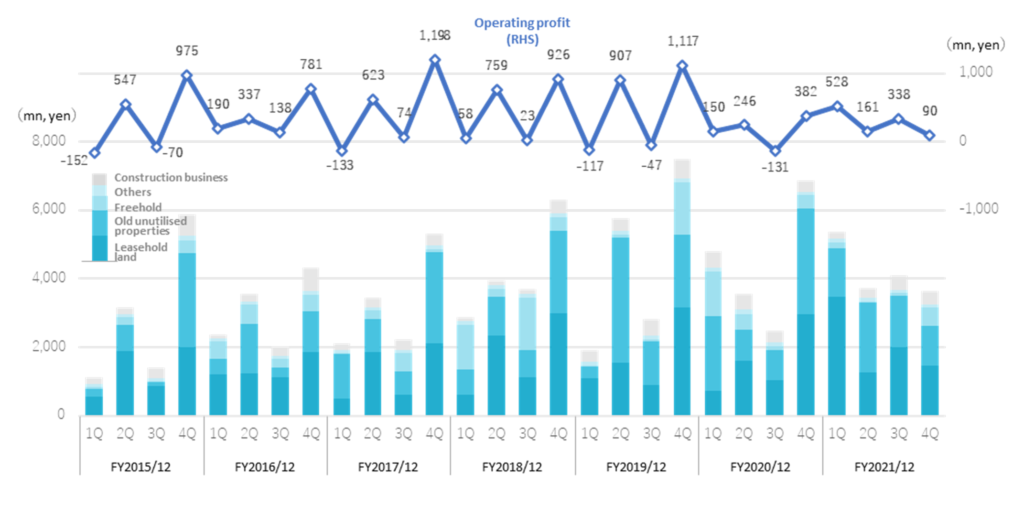
◇Segmental trends:
a) Real estate sales business – Sales 15,529 million yen, down 3.6% YoY and 6.9% below the company estimate. Segment profit 2,333 million yen (+20.6% YoY)
The recovery trend from 2Q and 3Q FY2020/12, which was significantly affected by infectious diseases, has continued, with growth doubling YoY on a cumulative basis up to 3Q. However, with the expansion of the fifth wave of infectious diseases and large projects in the old unutilised properties business carried over to the next period, the three-month 4Q revenue halved.
Leasehold land: Sales were 8,208 million yen (+29.8% YoY). Sales increased by about 30% for the entire year, partly due to the recording in 1Q of a mixed property with old unutilised properties scheduled for sale in 4Q of the previous year. Sales also exceeded the management’s estimate by 1.8%.
Old unutilised properties: Sales registered 6,083 million yen (-13.7%). The cumulative total up to 3Q was steady, up 24.9% YoY, but a large project to be booked in 4Q was carried over to the next fiscal year, resulting in a 13.7% YoY decrease of the full-year sales. This result was 17.3% short of the management’s estimate.
Freehold: Sales were 864 million yen (-61.9%). The previous year’s sales were larger than usual, so the comparison shows a significant decrease. The result came in 1.8% above the conservative estimate of the management.
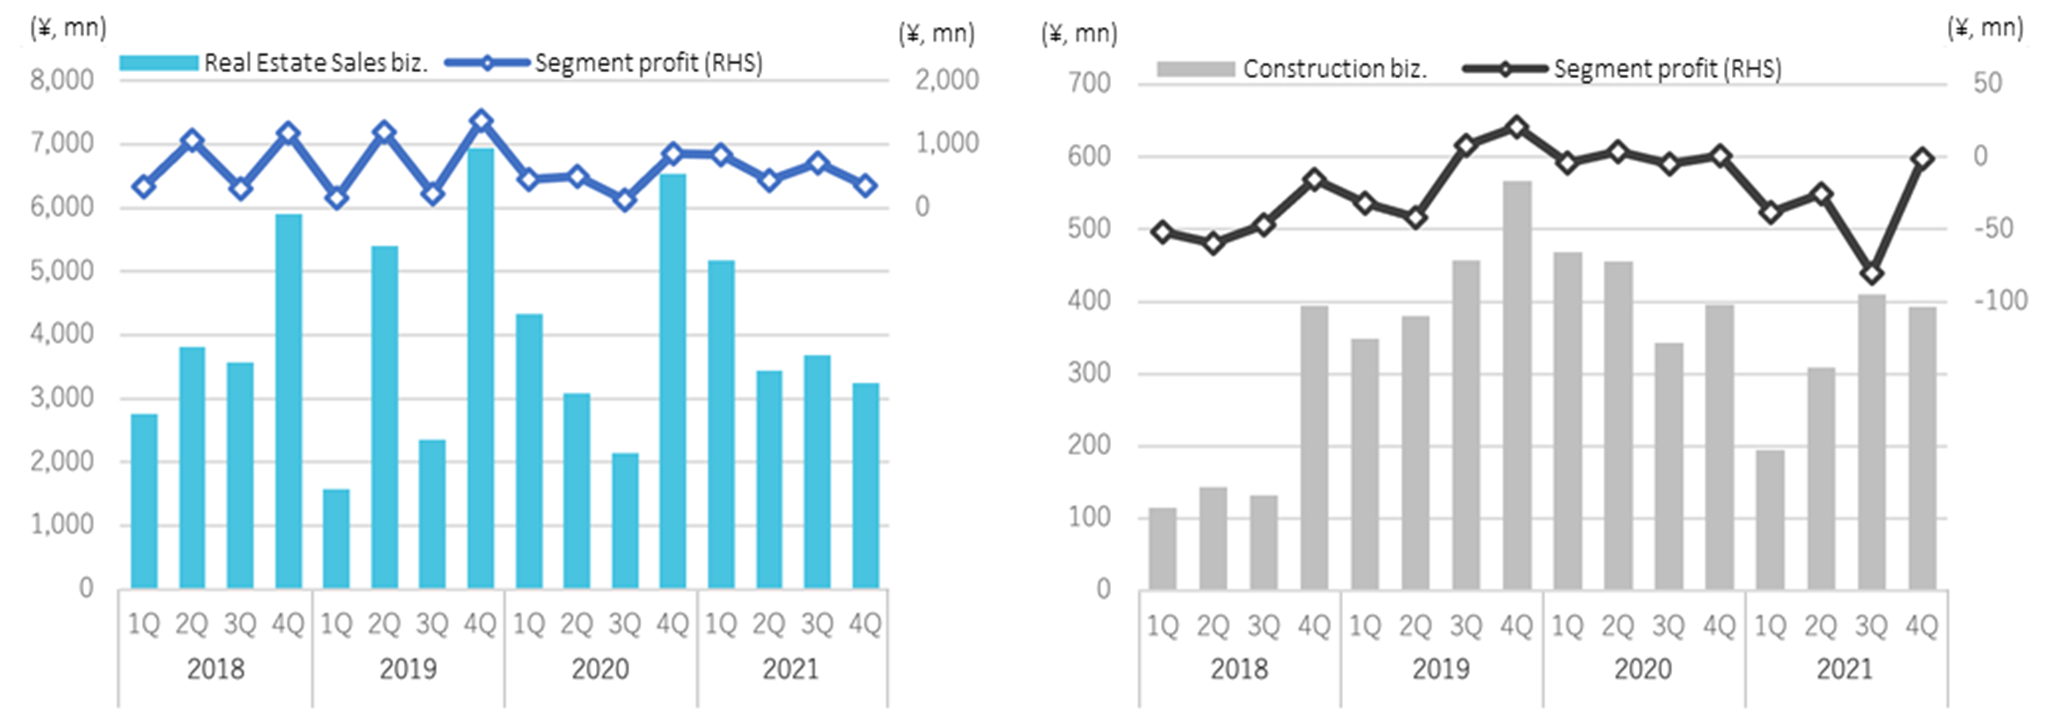
Sales and operating income by quarterly segment

Purchases in the real estate sales business were JPY 10,118m, a decrease of 23.9%. They appear low due to the high level of 2019 and 2020. But the number of plots were up 9.8%. Hence the company believe that there is no concern about the impact on performance in the current financial year and beyond.
b) Construction business – Sales were 1,306 million yen, down 21.4% YoY and 23.5% below the management’s forecast. Segment suffered loss of 145 million yen (a loss of 4 million yen in the same period of last year)
The number of negotiations and construction starts delayed due to the infectious disease, and sales went down YoY and came in lower than forecast. The number of unit sales fell 17.2% to 135. Profits were significantly affected by a provision for construction losses (approximately 88 million yen). The company’s core business is high value-added wooden construction, but this was due to a significant cost overrun in RC properties, which the company had started as a new initiative.
Orders in the construction business are recovering, despite infectious diseases and wood shock. Orders received amounted to 1,379 million yen (+26% YoY), and the order backlog was 529 million yen (+16.0%).
On the balance sheet, cash and deposits increased by 1,030 million yen(vs end-December 2020, same below) to 5,360 million yen due to active capitalisation of some properties held. Real estate for sale decreased by 1,123 million yen to 13,301 million yen. Interest-bearing debt also declined by 234 million yen to 8,107 million yen. Meanwhile, net assets increased by 235 million yen to 10,301 million yen. Retained earnings grew by 398 million yen.
◇ Forecast for FY12/2022: 8% increase in revenue (18.2 billion yen) and 16% rise in operating profit (1.3 billion yen).
The segment breakdown is as follows: Real estate sales business : 16.8 billion yen (+9%); construction business : 1.37 billion yen (+5%). The breakdown within the real estate sales business is as follows.
The company aims at delivering profit in the construction business in FY12/2022.
Real estate sales business : Sales forecasts by business
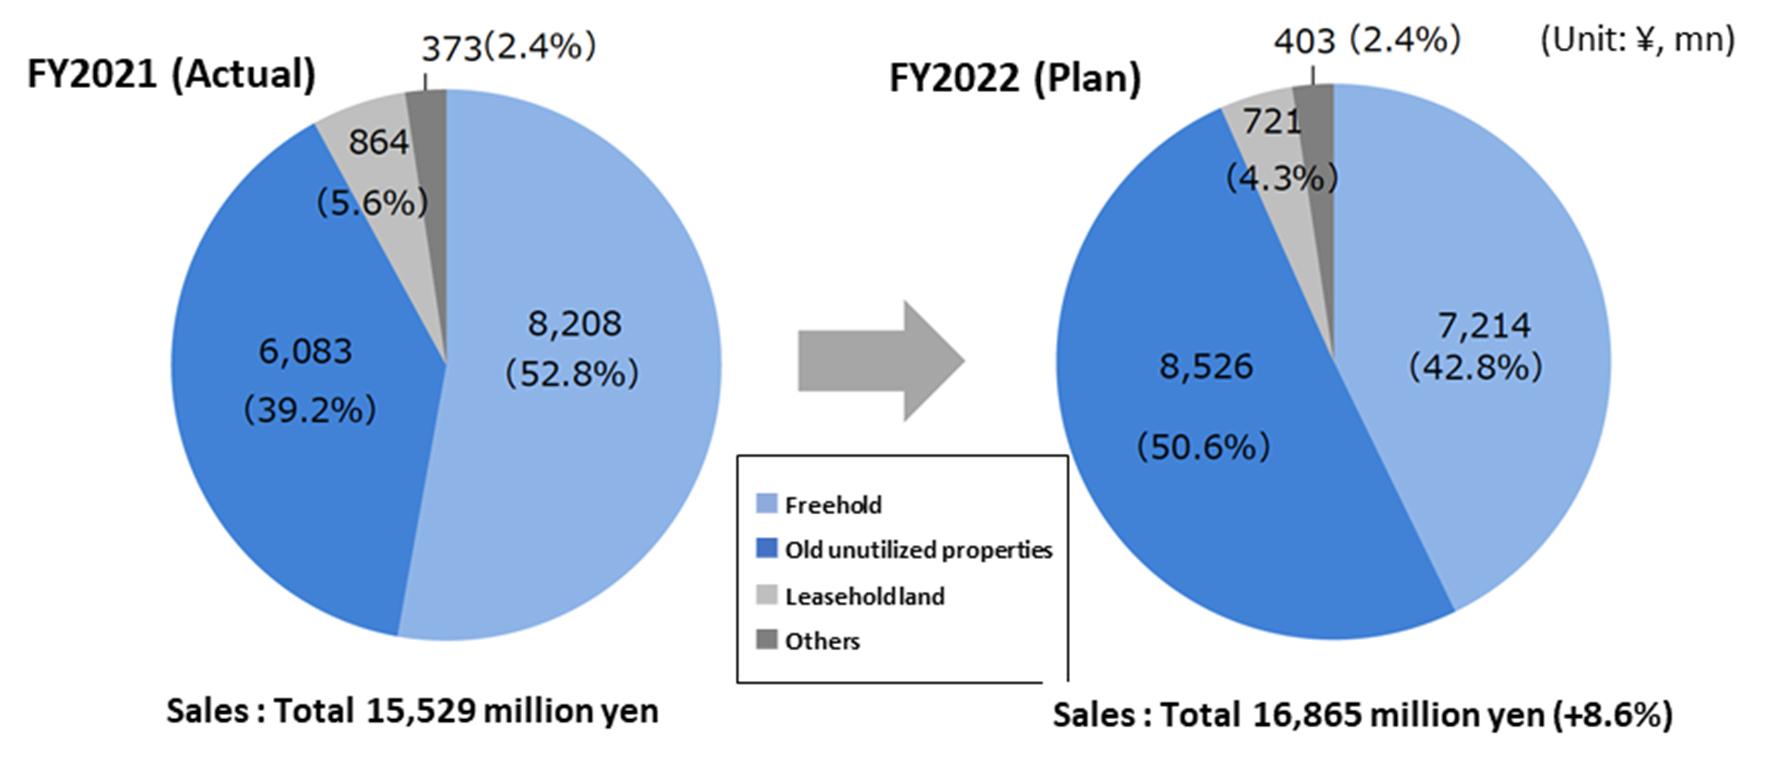
Sales in FY12/2022 should recover to pre-infection levels, but profits will remain at 70% of pre-infection levels.
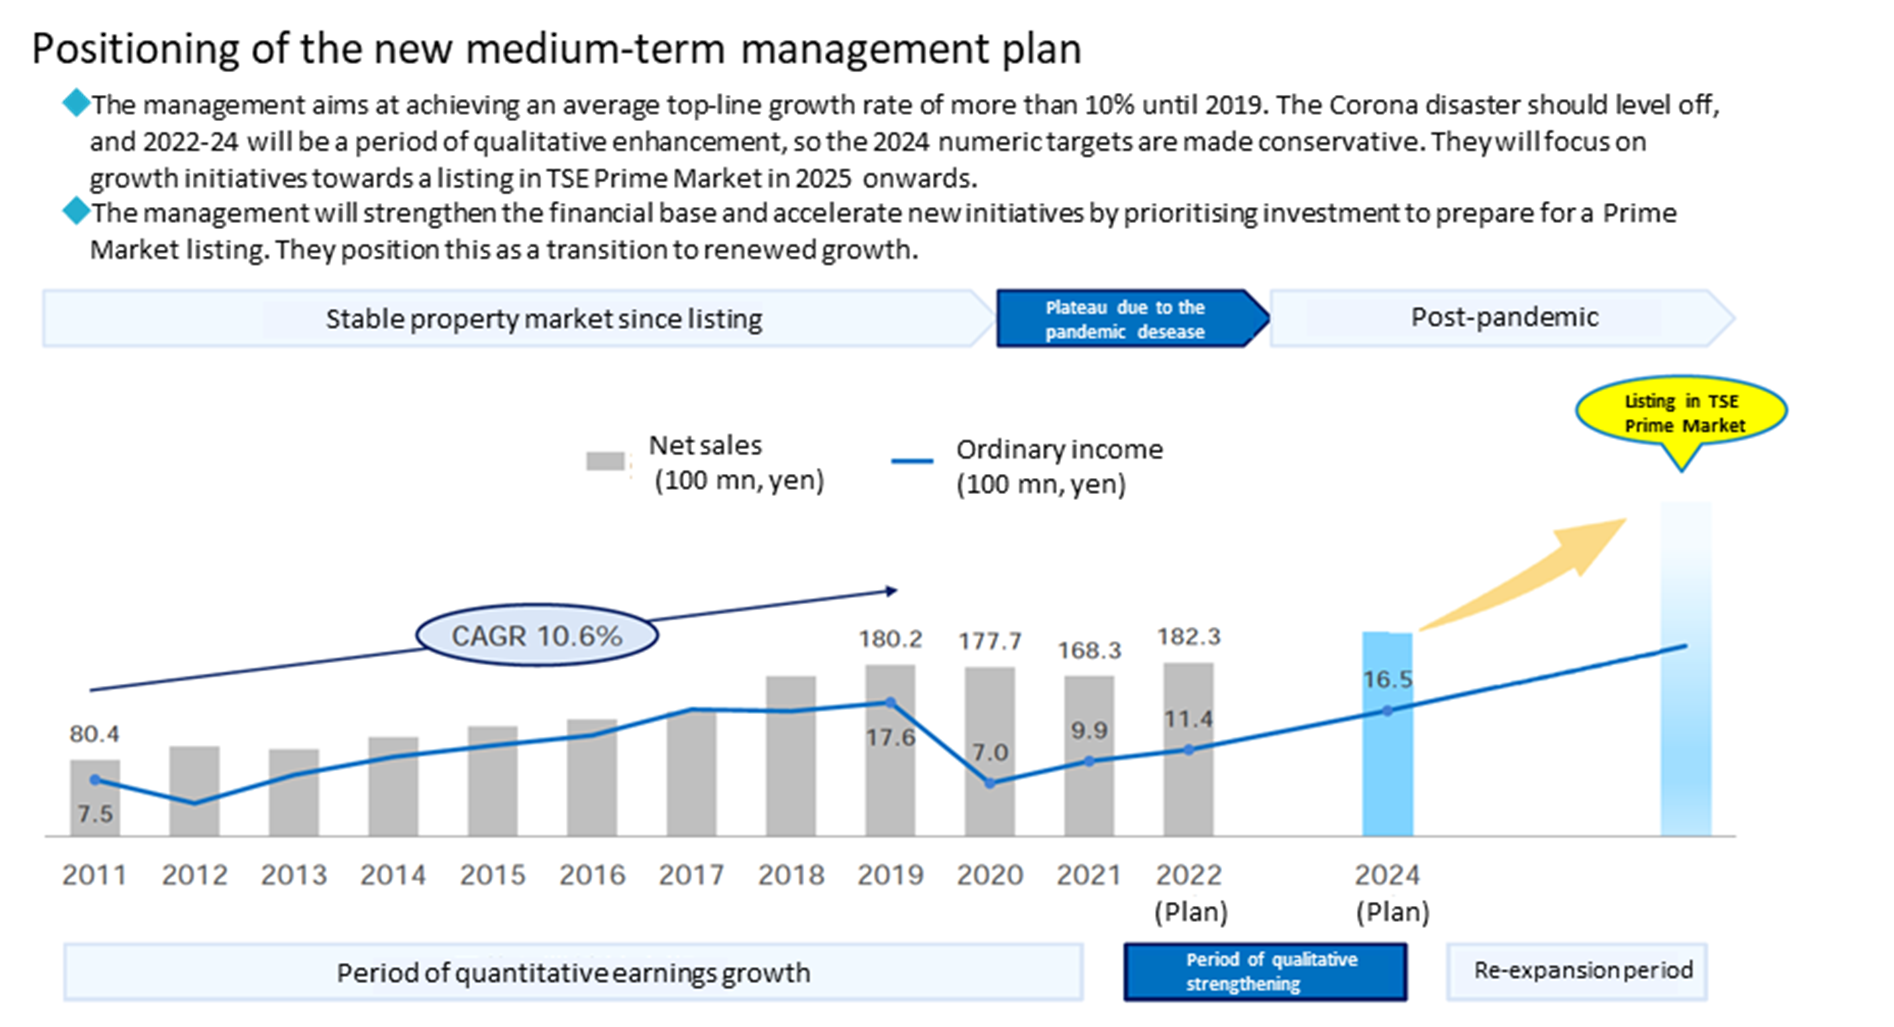
◇ New medium-term management plan (2022-2024): Transformation to 2024
The company revealed its postponed medium-term management plan at the time of the full-year result announcement. The previous plan (2018-2020) targeted an operating profit of 2 billion yen and ROA of 12.0% in FY12/2020. The company failed to meet these targets due to the spread of infectious diseases. So it had postponed the announcement of the new plan amid growing uncertainty caused by the fifth pandemic wave during 2021.
The new medium-term management plan clarifies the company’s direction by setting out its mission (‘Be a Trailblazer for connecting people and their future’), vision (‘Self-reliant and self-advancing’, ‘Professional awareness’, ‘Enjoy changes’) and policy (‘Moderation’, ‘Austerity’ and ‘Persistence’) as its values. Under these values, the company will build a solid business foundation that will enable it to achieve stable business growth even after the pandemic disease is over. Specifically, the company aims to attain sustainable growth by 1) expanding existing businesses, 2) expanding business domains, and 3) strengthening the management platform. To expand business domains, the company plans to invest 1 billion yen in new businesses by 2024 taking into consideration of the possibilities of M&A and alliances.
See the diagram below for the positioning of the plan. The company grew at a CAGR of 10.6% until 2019 but stagnated due to the spread of infectious diseases. With the new plan, the company has positioned the period 2022-2024 as a period of ‘qualitative reinforcement’ and aims to achieve an operating profit base of 1.8 billion yen in FY12/2024. After that, the company intends to continue striving for further growth and expansion to list on the TSE Prime Market.
The company has also adopted ROE as a management benchmark indicator, with a target of above 9.0%. The company will improve profitability and secure a high return on sales by strengthening existing businesses, improving efficiency and operations and developing businesses with high investment efficiency. In addition, the company will achieve a high asset turnover ratio by shortening project periods. At the same time, it will maintain financial leverage of over 2x.
The company’s shareholder return policy aims for a DOE level in the 2.0% range and to make use of share buybacks.
In addition, as a qualitative measure, the company intends to focus more than ever on various ESG initiatives.
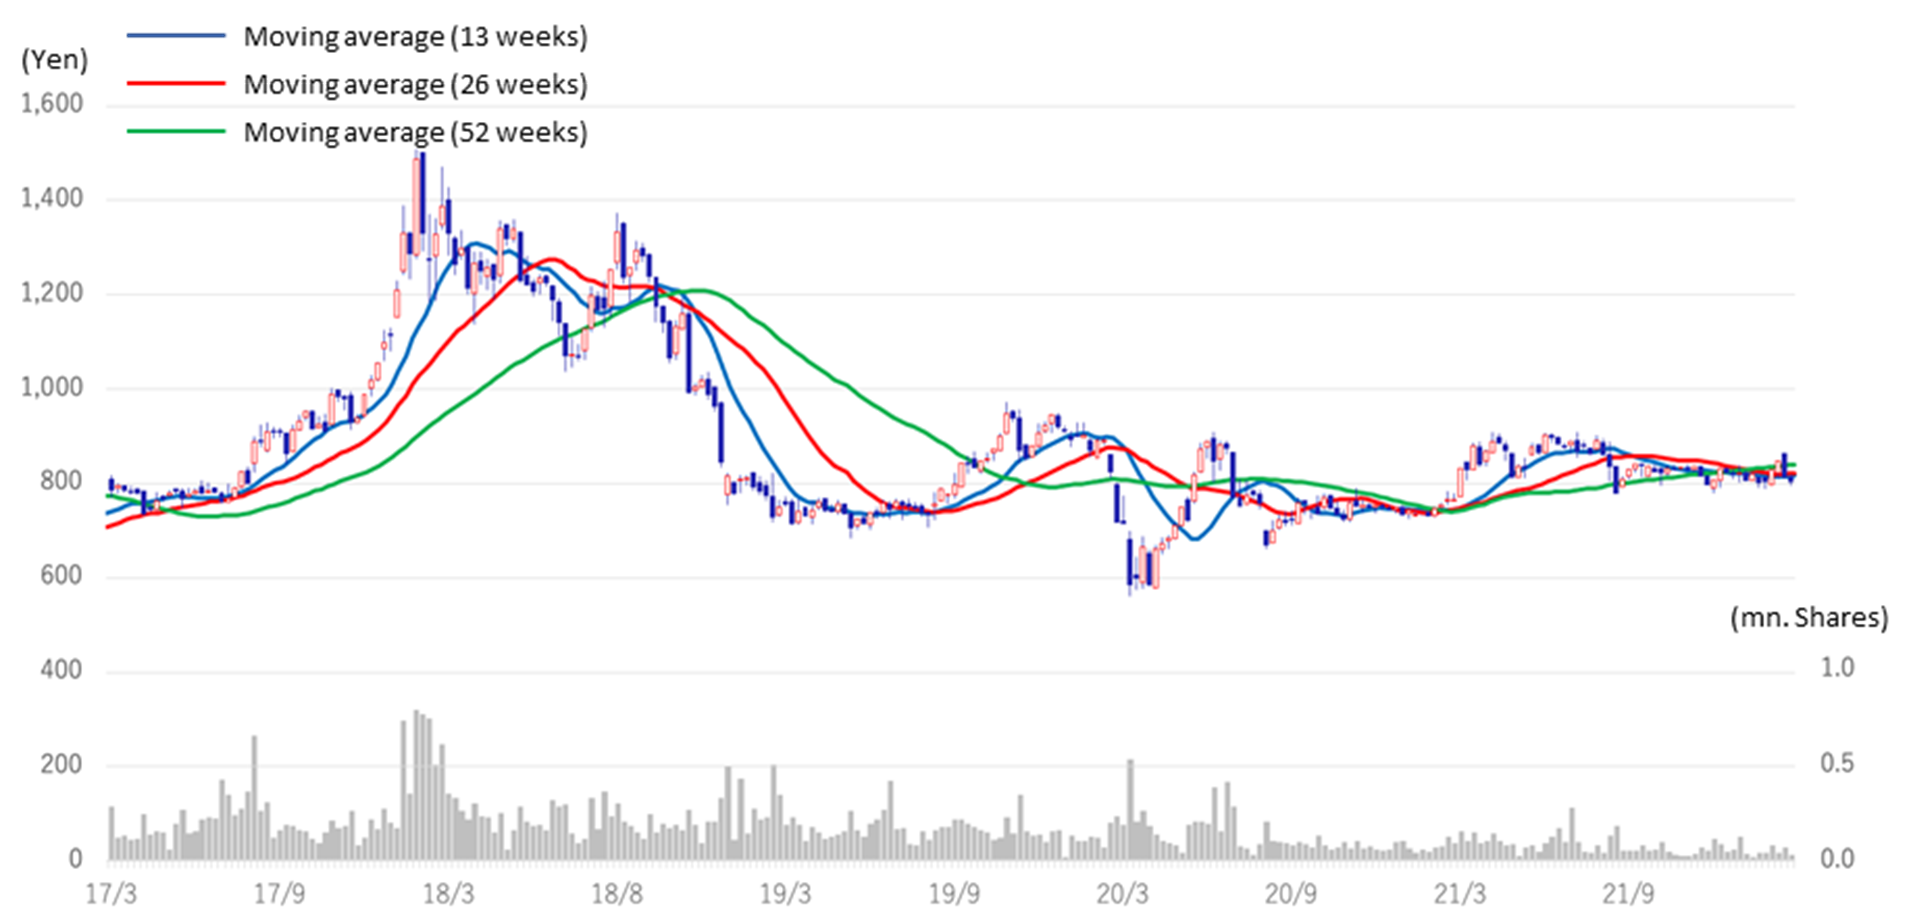
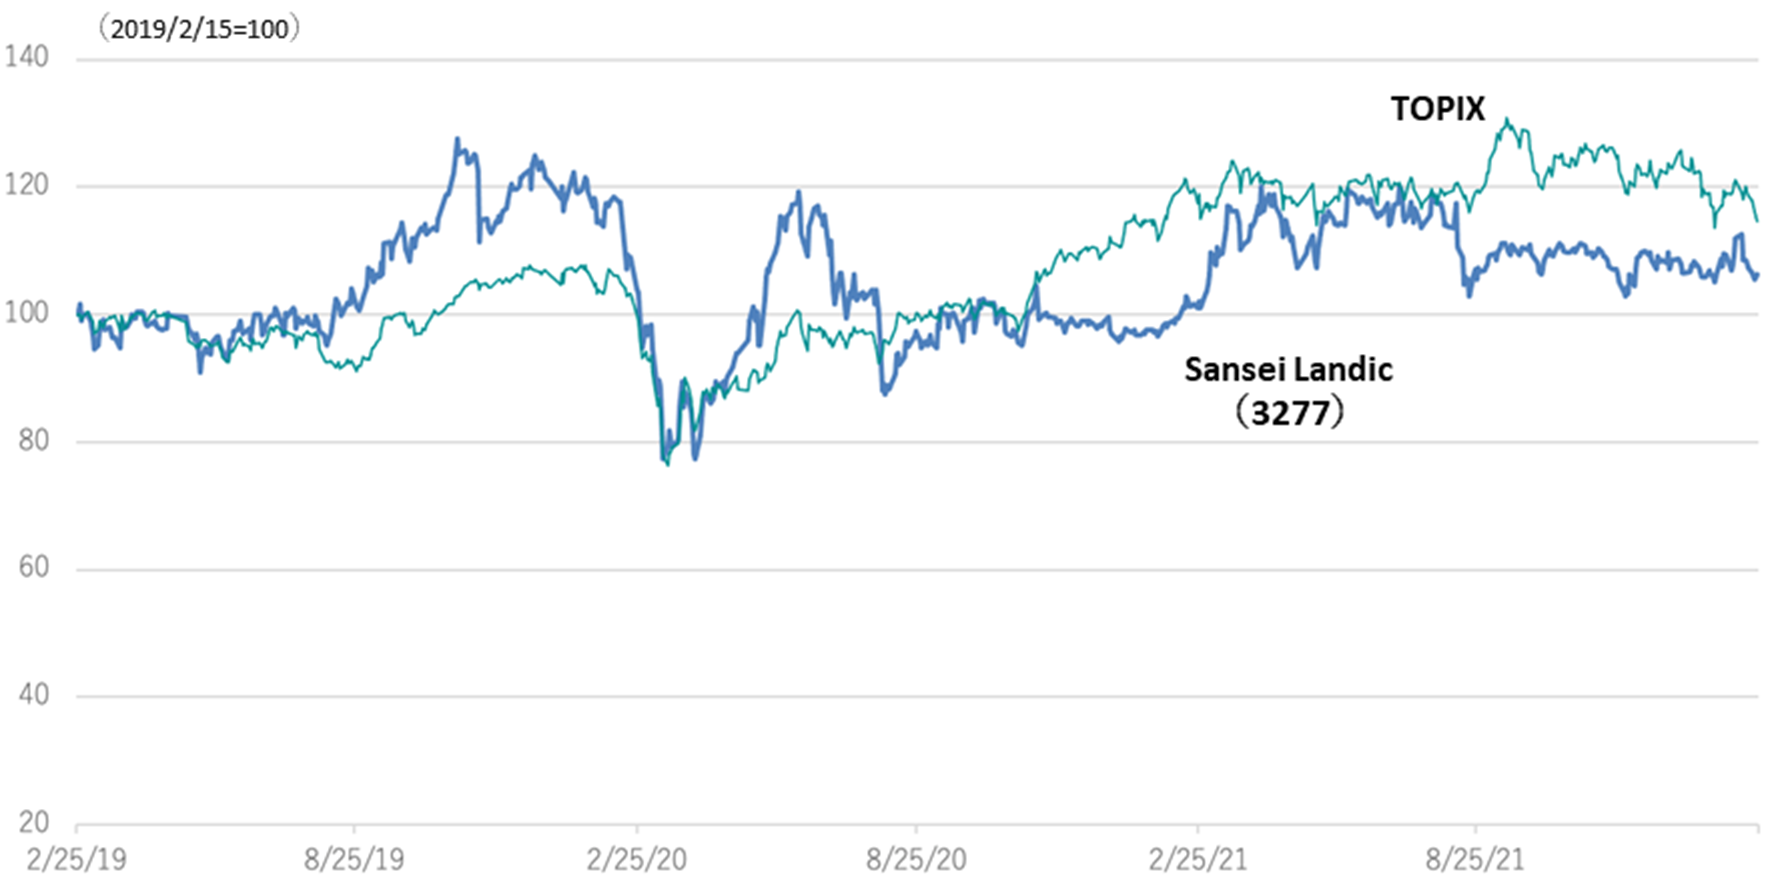
◇ Share price: Adjustment continues, but growth is expected as the pandemic settles down
The property sales industry, which runs on face-to-face sales, has been severely affected by the spread of infectious diseases. As a result, the company’s shares have been underperforming, despite some temporary rises after the 2Q results announcement. In the new medium-term business plan, the management sees 2020-2021 as a plateaued period affected by the pandemic. The management team will build a solid business foundation in the ‘qualitative strengthening period’ of 2022-24. If this plan progresses well, the earnings should recover above the pre-pandemic levels. The company’s shares trade on 0.65x book, well below the five-year trend of 0.89x. With investors increasingly focusing on value stocks, the company’s shares are worth a close watch.
5-year stock price move
Share price compared to TOPIX
Financial data
| FY (¥mn) | 2019/12 | 2020/12 | 2021/12 | |||||||||
| 1Q | 2Q | 3Q | 4Q | 1Q | 2Q | 3Q | 4Q | 1Q | 2Q | 3Q | 4Q | |
| [Sales by segment] | ||||||||||||
| Net sales | 1,925 | 5,775 | 2,811 | 7,507 | 4,807 | 3,546 | 2,481 | 6,938 | 5,365 | 3,744 | 4,089 | 3,637 |
| Year-on-year basis | -33.0% | 45.8% | -23.9% | 15.0% | 149.7% | -38.6% | -11.7% | -7.6% | 11.6% | 5.6% | 64.8% | -47.6% |
| Real estate sales business | 1,576 | 5,396 | 2,353 | 6,941 | 4,339 | 3,092 | 2,137 | 6,543 | 5,171 | 3,434 | 3,679 | 3,244 |
| Year-on-year basis | -42.8% | 41.3% | -33.9% | 17.5% | 175.3% | -42.7% | -9.2% | -5.7% | 19.2% | 11.1% | 72.1% | -50.4% |
| Sales composition ratio | 81.9% | 93.4% | 83.7% | 92.5% | 90.3% | 87.2% | 86.2% | 94.3% | 96.4% | 91.7% | 90.0% | 89.2% |
| Leasehold land | 1,086 | 1,546 | 889 | 3,176 | 719 | 1,613 | 1,044 | 2,950 | 3,464 | 1,267 | 2,003 | 1,474 |
| Year-on-year basis | 77.7% | -34.2% | -21.5% | 6.1% | -33.8% | 4.3% | 17.4% | -7.1% | 381.4% | -21.5% | 91.9% | -50.0% |
| Sales composition ratio | 56.4% | 26.8% | 31.6% | 42.3% | 15.0% | 45.5% | 42.1% | 42.5% | 64.6% | 33.8% | 49.0% | 40.5% |
| Old unutilised properties | 351 | 3,657 | 1,283 | 2,108 | 2,180 | 897 | 872 | 3,101 | 1,419 | 2,025 | 1,488 | 1,151 |
| Year-on-year basis | -51.6% | 225.4% | 62.0% | -12.9% | 520.6% | -75.5% | -32.0% | -47.1% | -34.9% | 125.8% | 70.6% | -62.9% |
| Sales composition ratio | 18.2% | 63.3% | 45.6% | 28.1% | 45.4% | 25.3% | 35.1% | 44.7% | 26.4% | 54.1% | 36.4% | 31.6% |
| Freehold | 28 | 88 | 55 | 1,532 | 1,305 | 465 | 106 | 395 | 191 | 46 | 101 | 526 |
| Year-on-year basis | -97.9% | -60.4% | -96.4% | 290.8% | 4560.7% | 428.4% | 92.7% | -74.2% | -85.3% | -90.1% | -4.7% | 33.2% |
| Sales composition ratio | 1.5% | 1.5% | 2.0% | 20.4% | 27.1% | 13.1% | 4.3% | 5.7% | 3.6% | 1.2% | 2.5% | 14.5% |
| Others | 110 | 104 | 126 | 126 | 133 | 117 | 116 | 97 | 96 | 95 | 88 | 94 |
| Year-on-year basis | 11.1% | -14.8% | 5.0% | 21.2% | 21.5% | 12.5% | -7.9% | -23.0% | -28.3% | -18.8% | -24.1% | -3.1% |
| Sales composition ratio | 5.7% | 1.8% | 4.5% | 1.7% | 2.8% | 3.3% | 4.7% | 1.4% | 1.8% | 2.5% | 2.2% | 2.6% |
| Construction business | 349 | 379 | 457 | 566 | 468 | 455 | 343 | 395 | 194 | 309 | 409 | 392 |
| Year-on-year basis | 202.6% | 166.5% | 246.1% | 44.0% | 34.1% | 19.8% | -24.9% | -30.1% | -58.4% | -32.1% | 19.3% | -0.8% |
| Sales composition ratio | 18.1% | 6.6% | 16.3% | 7.5% | 9.7% | 12.8% | 13.8% | 5.7% | 3.6% | 8.3% | 10.0% | 10.8% |
| [Statements of income] | ||||||||||||
| Net sales | 1,925 | 5,775 | 2,811 | 7,507 | 4,807 | 3,546 | 2,481 | 6,938 | 5,365 | 3,744 | 4,089 | 3,637 |
| Cost of sales | 1,346 | 4,014 | 2,076 | 5,466 | 3,865 | 2,557 | 1,934 | 5,431 | 4,020 | 2,756 | 2,945 | 2,745 |
| Gross profit | 579 | 1,762 | 736 | 2,042 | 942 | 989 | 548 | 1,507 | 1,344 | 986 | 1,143 | 892 |
| SG&A expenses | 696 | 855 | 783 | 924 | 792 | 744 | 678 | 925 | 816 | 826 | 805 | 802 |
| Operating income | -117 | 907 | -47 | 1,117 | 150 | 245 | -131 | 382 | 528 | 160 | 338 | 90 |
| Non-operating income | 4 | 28 | 5 | 5 | 9 | 5 | 51 | 5 | 12 | 8 | 8 | 6 |
| Non-operating expenses | 34 | 38 | 32 | 40 | 55 | 63 | 60 | 10 | 37 | 40 | 34 | 39 |
| Ordinary income | -147 | 898 | -75 | 1,083 | 103 | 188 | -140 | 298 | 502 | 128 | 311 | 56 |
| Extraordinary income | 0 | 0 | 0 | 0 | 0 | 0 | 0 | 3 | 0 | 0 | 0 | |
| Extraordinary expenses | 0 | 0 | 0 | 0 | 0 | 0 | 0 | 0 | 0 | |||
| Loss before income taxes | -147 | 898 | -75 | 1,083 | 103 | 188 | -140 | 298 | 506 | 128 | 311 | 56 |
| Total income taxes | -35 | 312 | -26 | 349 | 36 | 72 | -49 | 295 | 183 | 48 | 166 | -4 |
| Net income | -112 | 585 | -48 | 734 | 67 | 114 | -90 | 176 | 323 | 79 | 145 | 61 |
| [Balance Sheets] | ||||||||||||
| Current assets | 16,007 | 15,596 | 17,458 | 18,095 | 18,816 | 20,798 | 20,577 | 19,040 | 17,554 | 17,371 | 18,769 | 18,968 |
| Property for sale | 13,129 | 12,290 | 14,890 | 13,493 | 14,655 | 16,923 | 17,312 | 14,424 | 13,493 | 12,586 | 13,134 | 13,301 |
| Non-current assets | 1,230 | 1,206 | 1,229 | 1,199 | 1,188 | 1,164 | 1,197 | 1,030 | 951 | 1,054 | 1,081 | 1,082 |
| Tangible assets | 469 | 471 | 462 | 456 | 451 | 449 | 443 | 306 | 291 | 290 | 293 | 301 |
| Investments and other assets | 694 | 666 | 689 | 669 | 668 | 653 | 691 | 655 | 595 | 703 | 732 | 731 |
| Total assets | 17,236 | 16,802 | 18,686 | 19,294 | 20,004 | 21,962 | 21,774 | 20,071 | 18,505 | 18,425 | 19,849 | 20,051 |
| Current liabilities | 6,904 | 6,996 | 9,135 | 9,047 | 9,883 | 7,767 | 7,699 | 5,772 | 5,517 | 7,540 | 8,633 | 8,732 |
| Short-term borrowings | 5,645 | 5,360 | 7,702 | 7,203 | 7,729 | 6,352 | 6,676 | 4,463 | 4,272 | 6,105 | 7,171 | 7,368 |
| Non-current liabilities | 1,714 | 602 | 389 | 351 | 345 | 4,303 | 4,274 | 4,232 | 2,919 | 792 | 976 | 1,017 |
| Long-Term Borrowings | 1,347 | 222 | 3,958 | 3,929 | 3,879 | 2,570 | 483 | 683 | 740 | |||
| Total liabilities | 8,618 | 7,598 | 9,524 | 9,399 | 10,228 | 12,071 | 11,973 | 10,004 | 8,436 | 8,332 | 9,609 | 9,749 |
| Total net assets | 8,618 | 9,204 | 9,162 | 9,895 | 9,776 | 9,891 | 9,801 | 10,067 | 10,070 | 10,093 | 10,240 | 10.302 |
| Total shareholders’ equity | 8,618 | 9,204 | 9,162 | 9,895 | 9,776 | 9,891 | 9,801 | 10,067 | 10,070 | 10,093 | 10,240 | 10,302 |
| Capital stock | 811 | 811 | 814 | 814 | 818 | 818 | 818 | 818 | 818 | 820 | 821 | 821 |
| Legal capital reserve | 772 | 772 | 775 | 775 | 779 | 779 | 779 | 779 | 779 | 781 | 782 | 782 |
| Retained earnings | 7,031 | 7,616 | 7,568 | 8,302 | 8,174 | 8,289 | 8,200 | 8,465 | 8,577 | 8,656 | 8,802 | 8,863 |
| Stock acquisition right | 4 | 4 | 4 | 4 | 4 | 4 | 4 | 4 | 4 | 4 | 4 | 4 |
| Total liabilities and net assets | 17,236 | 16,802 | 18,686 | 19,294 | 20,004 | 21,962 | 21,774 | 20,071 | 18,505 | 18,425 | 19,849 | 20,051 |
| [Statements of cash flows] | ||||||||||||
| Cash flow from operating activities | -286 | -419 | -3,683 | -916 | 2,110 | 1,704 | ||||||
| Loss before income taxes | 750 | 1,758 | 291 | 712 | 635 | 1,003 | ||||||
| Cash flow from investing activities | -27 | -70 | -9 | -287 | -26 | -51 | ||||||
| Cash flow from financing activities | -446 | 984 | 3,021 | 952 | -2,129 | -608 | ||||||
| Net increase in cash and cash equiv. | -760 | 493 | -671 | -251 | -46 | 1,045 | ||||||
| Cash and cash equiv. at beginning of period | 3,465 | 3,465 | 3,958 | 3,958 | 3,707 | 3,707 | ||||||
| Cash and cash equiv. at end of period | 2,704 | 3,958 | 3,287 | 3,707 | 3,661 | 4,752 |
Source: Omega Investment from Company materials.