2026-07-27
Home
Japanese

Omega Investment Co., Ltd.
Digital Hearts Holdings (Company Note Q4 update)

| Share price (6/2) | ¥1,832 | Dividend Yield (22/3 CE) | 0.81 % |
| 52weeks high/low | ¥2,700 / 1,405 | ROE(TTM) | 28.89 % |
| Avg Vol (3 month) | 114.2 thou shrs | Operating margin (TTM) | 9.26 % |
| Market Cap | ¥43.7 bn | Beta (5Y Monthly) | 1.13 |
| Enterprise Value | ¥40.5 bn | Shares Outstanding | 23.890 mn shrs |
| PER (22/3 CE) | 17.6 X | Listed market | TSE Prime section |
| PBR (21/3 act) | 5.66 X |
| Click here for the PDF version of this page |
| PDF Version |
Record highs in both sales and profits.
AGEST, a next-generation QA business company, started in April.
◇Perfect results in the very first year of the new management team.
Both sales and operating profit in the Enterprise and Entertainment businesses achieved record highs, in part aided by M&A. Operating profit came in 30% above the company’s initial guidance. AGEST, Inc., the core company of the Enterprise business, started in April as a result of the group reorganisation. The company plans a 20% yoy increase in sales and a 20% growth in operating profit for FY2023/3. It announced a forecast for a large increase in dividends, and we believe the shares are worth a continued watch.
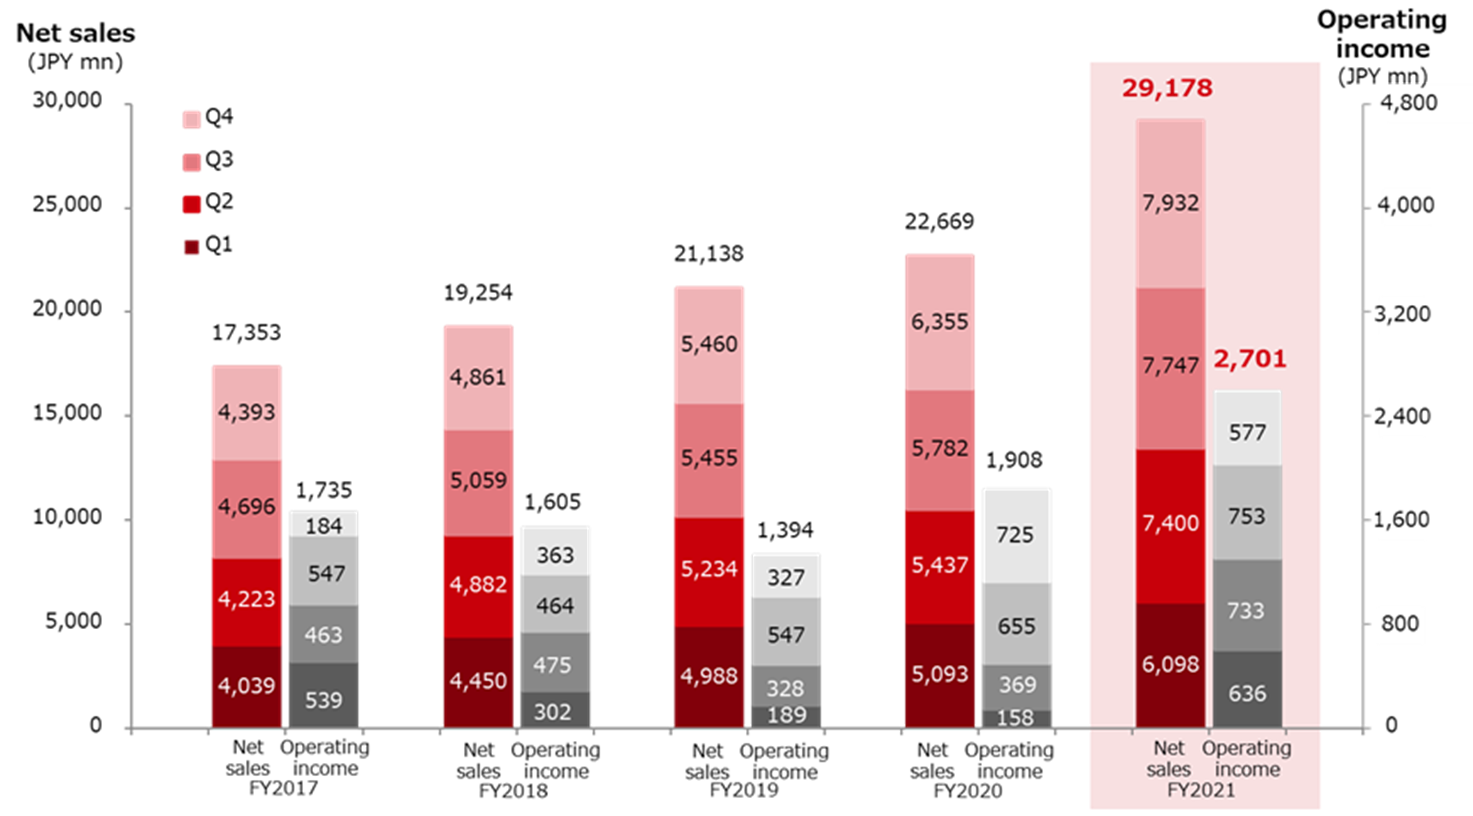
◇Full-year results for FY2022/3: Both sales and profits hit a record high.
The company’s full-year results for FY2022/3 show that both the Enterprise and Entertainment businesses performed well. Sales and profits grew significantly, thanks to the robust growth in existing businesses and the M&As. Sales registered a record high of 29.1 billion yen (+29% yoy), and operating profit stood at 2.7 billion yen (+42% yoy). Operating profit came in above the management’s initial guidance by approximately 30%.
The Enterprise business, where aggressive upfront investment is being promoted, has grown into a scale enough to generate stable profits from Q3 FY2021/3. This segment delivered a profit of 650 million yen, up 3.5 times yoy. The Entertainment business, a cash cow, posted a high operating margin of 20%, with a segment income of 3.67 billion yen (+19% yoy).
In line with the growth of the Enterprise business, AGEST, Inc., the core company responsible for the Enterprise business, was launched on 1 April due to the group reorganisation, as previously announced. In the Enterprise business, the aim is to achieve growth by providing QA solutions at a higher quality level through measures such as collaboration with authorities in the field. Meanwhile, the Entertainment business will continue to be done at the operating subsidiary DIGITAL HEARTS Co., Ltd.
◇Outlook for FY2023/3: The management anticipates high growth to continue. The dividend will likely increase substantially.
The management forecasts a 20% yoy rise in FY2023/3 sales, with the Enterprise business driving the growth. They plan to increase the overall operating profit by 20% while accelerating investment for a growth strategy. In the Enterprise business, organic growth driven by robust DX and businesses acquired through M&A during FY2022/3 will contribute for 12 months. Consequently, sales are expected to grow by 34% yoy (15.3 billion yen). In the meantime, the company expects revenue of the Entertainment business to rise 14% yoy (20.1 billion yen) thanks to the expansion of new services that adapt to changing market environment and the strengthening of the global businesses.
The good performance will be reflected in shareholder returns – the management plans to raise the dividend by 6.0 yen a share, which is the largest increase ever.
◇Share price: The shares shot up on strong results and a significant dividend hike forecast.
The company’s share price rose sharply on 13 May following the announcement of good results on 12 May. Although the global adjustment in tech stocks remains a concern of investors, the company’s business performance is solid, and its enterprise-focused growth strategy is steadily achieving results. Given the high growth outlook, the company’s share price is worth a close watch.
| JPY, mn, % | Net sales | YoY % |
Oper. profit |
YoY % |
Ord. profit |
YoY % |
Profit ATOP |
YoY % |
EPS (¥) |
DPS (¥) |
| 2018/3 | 17,353 | 12.4 | 1,735 | -9.0 | 1,782 | -10.8 | 1,200 | 50.9 | 55.14 | 11.50 |
| 2019/3 | 19,254 | 11.0 | 1,605 | -7.5 | 1,651 | -7.4 | 1,575 | 31.3 | 72.13 | 13.00 |
| 2020/3 | 21,138 | 9.8 | 1,394 | -13.2 | 1,372 | -16.9 | 792 | -49.7 | 36.31 | 14.00 |
| 2021/3 | 22,669 | 7.2 | 1,908 | 36.9 | 1,975 | 43.9 | 974 | 23.0 | 45.15 | 14.00 |
| 2022/3 (Act) | 29,178 | 28.7 | 2,701 | 41.5 | 2,778 | 40.7 | 1,780 | 82.7 | 82.35 | 15.00 |
| 2023/3 (CE) | 35,500 | 21.7 | 3,290 | 21.8 | 3,290 | 18.4 | 2,250 | 26.4 | 104.04 | 21.00 |
Full year consolidated sales / operating profit trend
◇Trends by segment:
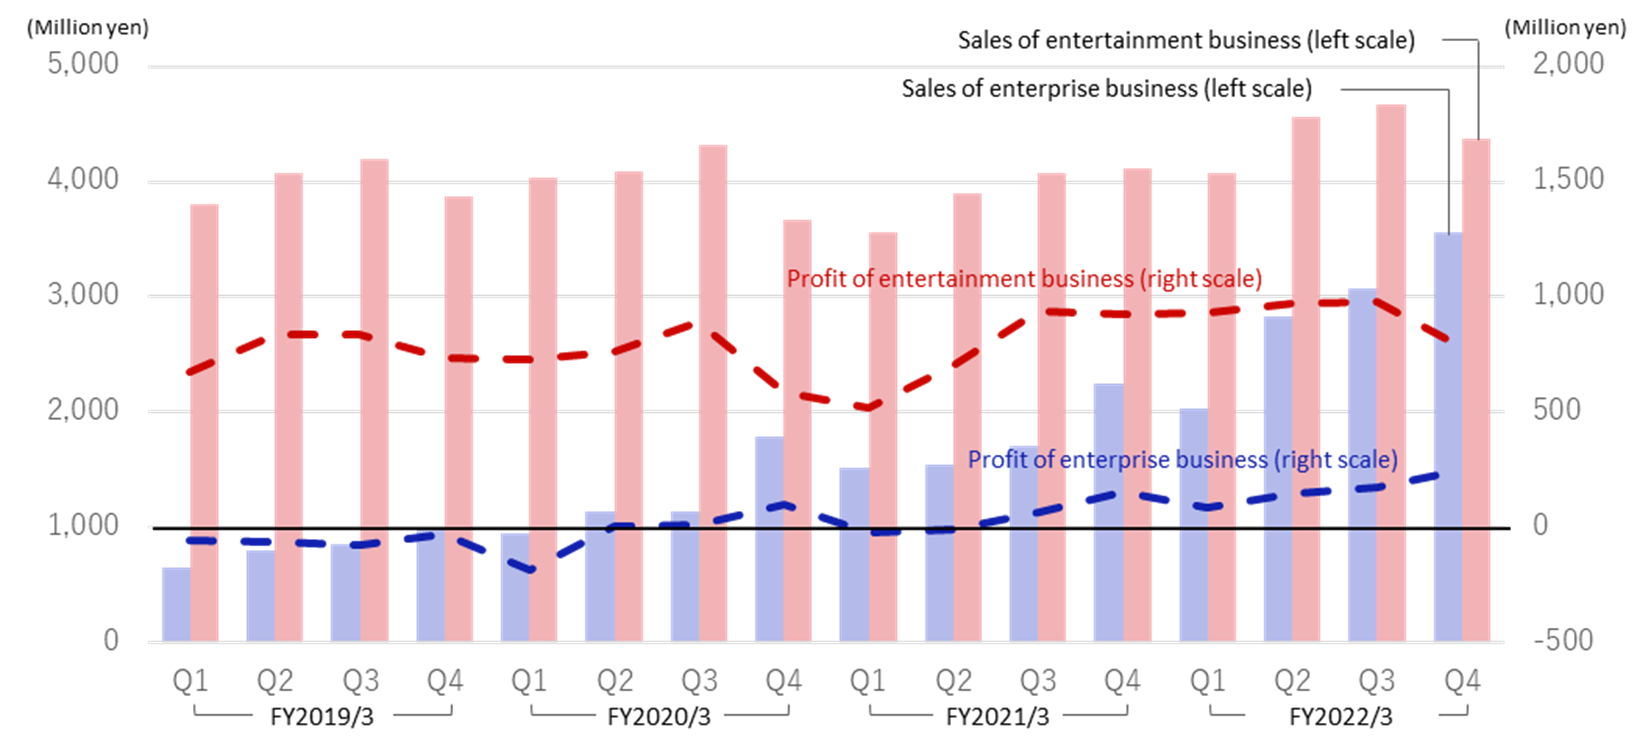
1) Enterprise business: sales grew by 60% yoy (11,491 million yen), and the profit margin registered 5.7%.
The Enterprise business saw sales grow 60% yoy thanks to the M&As in recent years as well as the benefits of accelerating DX. Segment income was also firmly in the black and amounted to 649 million yen, 3.5 times higher than in the previous year. Overriding the amortisation of goodwill on M&A, the company posted a profit margin of 5.7% for the full year, delivering 6.9% in Q4 alone, in this segment.
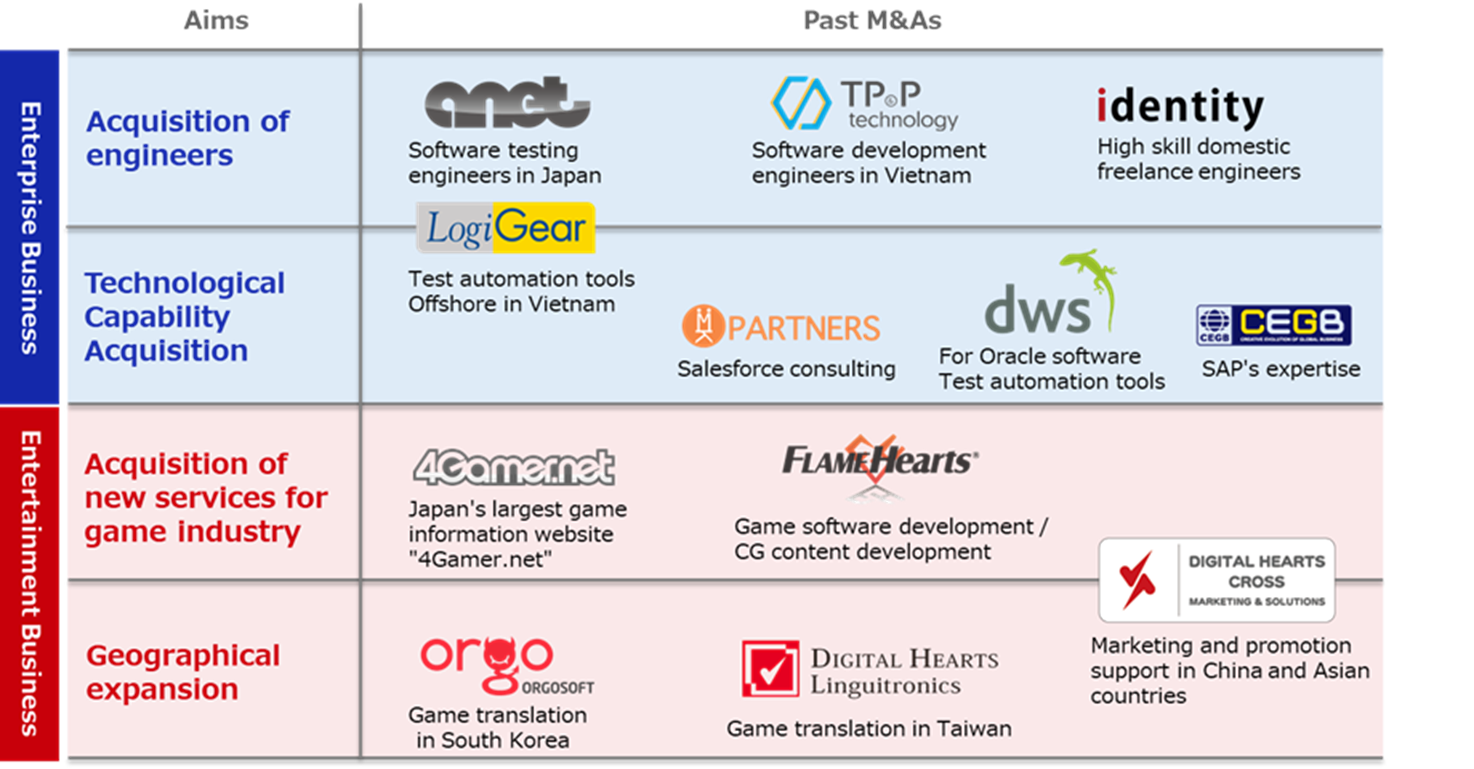
System testing: sales were 4,954 million yen (+38.3% yoy). While continuing to reinforce engineers and marketing strength, the company grew the number of new customers and improved the annual average sales per existing customer by measures such as aggressive proposals for total solutions that improve quality. The company has been pursuing mergers and acquisitions. (the graph in the next page) Acquisition of MK Partners and TPP SOFT kicked in the consolidated accounts from Q2, while DEVELOPING WORLD SYSTEMS was included from Q4. Also, sales of the existing businesses went up 20% yoy. Despite ongoing investment in business expansion, the company has maintained high profitability of 35.2% on a gross margin basis. It aims to differentiate itself from the competition through unique features such as the utilisation of its game testers’ talents, its test automation services, and others.
Sales/Profit by Segment
Past M&As
IT services and security: revenue rose 90.1% yoy (6,537 million yen). Against the backdrop of the acceleration of DX and the penetration of remote working, all services, including contract development/SES, maintenance/operation and security, recorded top-line growth of more than 20% yoy. The performance of identity Inc. acquired in June 2021 kicked in the results from Q2. Investment in human resources, the key to growth, remains active, with the number of in-house security personnel rising by 1.4 times over the previous year.
2) Entertainment business: 13.0% yoy sales increase (17,687 million yen), segment income rose 19.2% yoy.
The console games market remained buoyant. Against the backdrop of accelerating overseas marketing of game contents, the company could capture the increasing demand. As a result, Domestic debugging, Global and others are all performing well. Sales of Global and others increased by 35.3%, in part aided by M&A. The operating profit increased by 19.2% to 3,668 million yen as revenue rose, and gross margins increased. Entertainment business is the company’s cash cow, generating high levels of profit consistently. The segment’s operating profit margin was also high at 20.7%.
Domestic debugging: sales increased by 5.1% yoy (12,123 million yen). In FY2022/3, there was a rebound from the clients’ delayed development, which happened due to the coronavirus infection in the first half of the previous fiscal year. In addition to these revenue growth factors, the development of new titles for major domestic console games was brisk, resulting in a strong performance. The gross margin improved by 2.5% to register a high 31.1% for the full fiscal year as a result of increased revenues and the active promotion of operational reforms and other measures.
Global and others: sales rose 35.3% yoy (5,563 million yen). The company won cross-border/global projects backed by the robust game market. It delivered double-digit revenue growth in all Global, Creative, and Media and others. The consolidation of the DIGITAL HEARTS CROSS Group (DHX, formerly Metaps Entertainment Limited, acquired in March 2021) from Q2 of the current fiscal year was also significant to results.
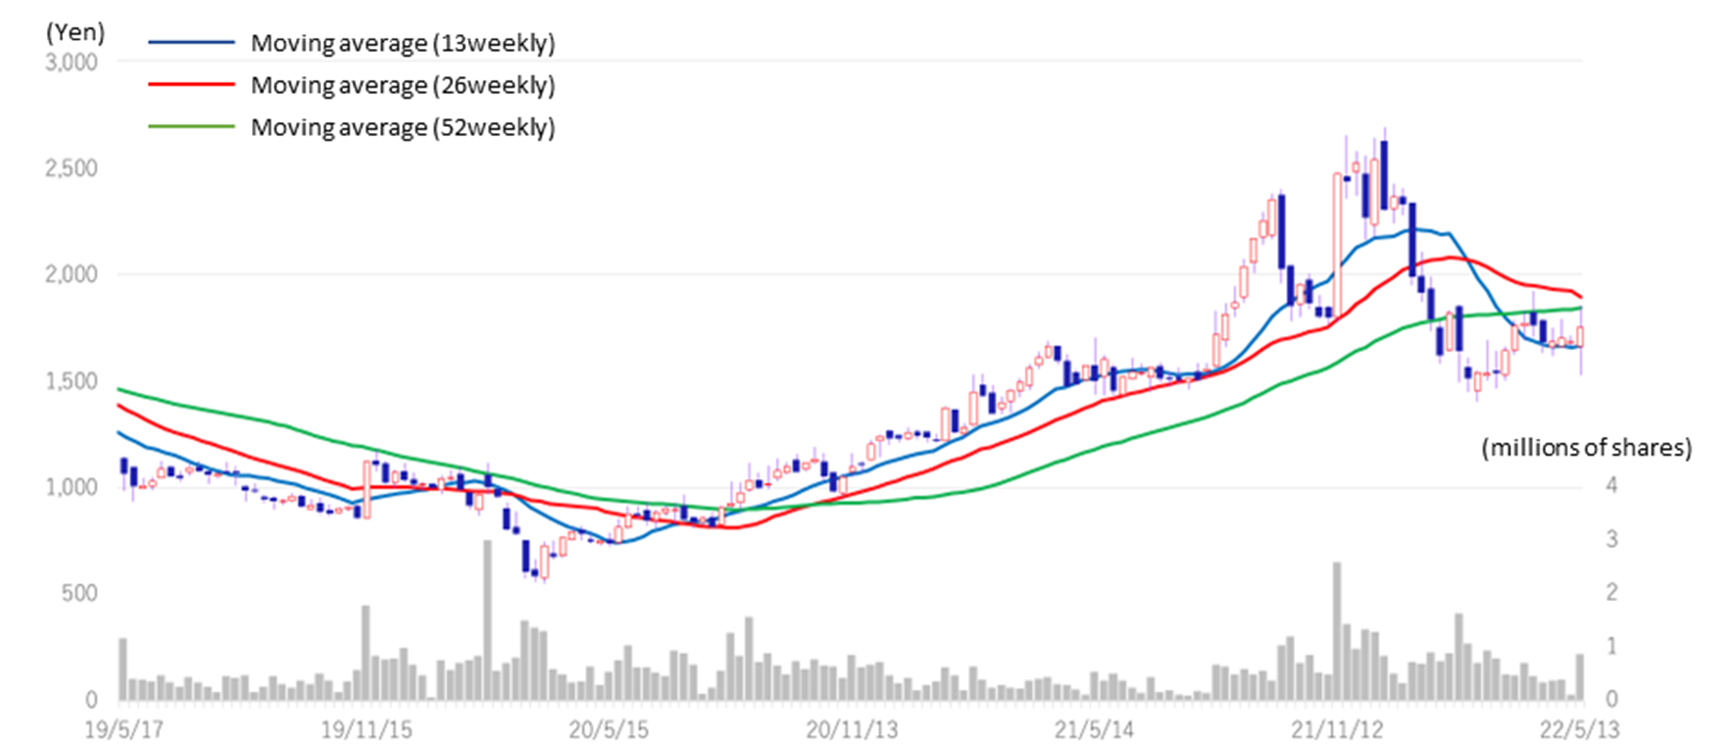
◇Share price: Went up sharply on good results and a large dividend increase. The shares are worth a watch.
The company’s share price rose significantly on 13 May following the announcement of good results on 12 May. The announcement of a large dividend increase forecast also seems to have been well rated by investors. The company’s share price, which hit a record high at 2,700 yen on 13 December 2021, has fallen amidst the global growth stock sell-off. While the concern about tech stocks lingers, the company’s business performance is solid, and its enterprise-focused growth strategy is achieving visible results. In addition, it is actively introducing various measures to differentiate itself in the enterprise business, where it focuses on high value-added businesses. The company should be able to achieve high growth and high profitability, so the shares are worth a close look.
Digital Hearts Holdings (3676) Share Price Trend (3Year-to-date)
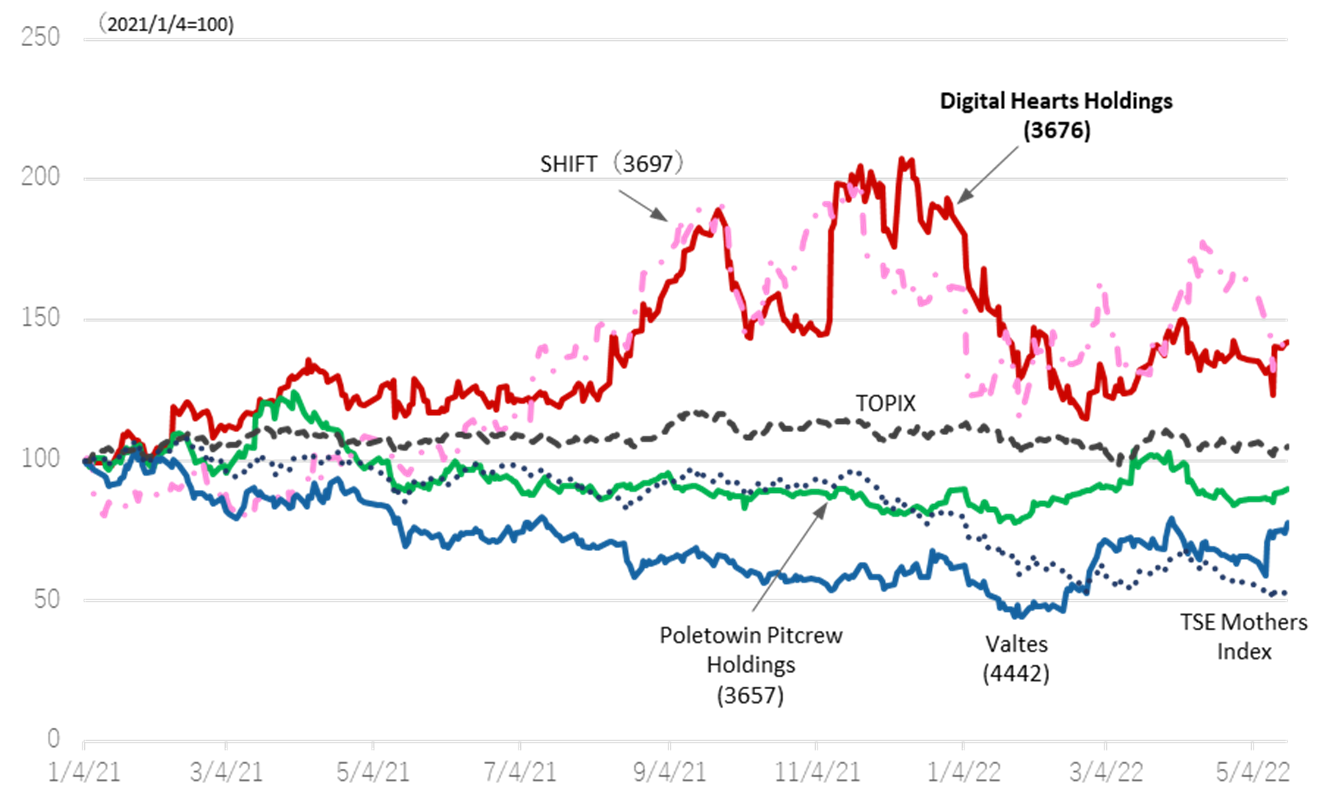
The chart below compares the share price performance of four software testing companies. Their shares have been down since last autumn following the global growth stock adjustment but are still trading at high levels. The shares of Digital Hearts Holdings and SHIFT (TSE: 3697) have been highly rated by the market, unlike the shares of the other two companies and the TSE Mothers Index, which have been down year-to-date. However, of notice is the high PER of the shares of SHIFT. (see table on next page). SHIFT‘s sales composition is over 90% enterprise, and its shares trade on high PE multiples reflecting rapid growth through M&A. Digital Hearts Holding raised its sales proportion on enterprise business to approximately 40% while making steady progress in M&A. Meanwhile, in testing services, the company aims to distinguish itself with high-quality services such as advanced testing and next-generation QA. It has been selecting target companies from this perspective in M&A. The strategy is to achieve greater quality advantage and differentiation. As such, we are interested to see whether the company’s shares will be reassessed in terms of PER as well as other valuations.
Share price performance (four software testing companies, TOPIX, TSE Mothers Index)
Software Testing four Companies Comparison
| Code | 3676 | 3657 | 3697 | 4442 | |
| Company name | Digital Hearts Holdings |
Poletowin Pitcrew Holdings |
SHIFT | Valtes | |
| Financial year | March, 2022 | January, 2022 | August, 2021 | March, 2022 | |
| Share price (5/18) | 1,771 | 1,044 | 20,060 | 1,709 | |
| Market cap. (millions of yen) | 42,311 | 39,835 | 356,649 | 12,219 | |
| PER (X) | 17.0 | 16.2 | 78.3 | 24.0 | |
| PBR (X) | 5.47 | 2.23 | 15.35 | 6.76 | |
| Financial indicators | |||||
| ROE | 28.03% | 13.46% | 20.24% | 25.78% | |
| ROA | 11.16% | 10.50% | 12.75% | 15.13% | |
| ROIC | 16.14% | 13.67% | 14.57% | 22.17% | |
| DPS (plan, yen) | 15.00 | 14.00 | 0.00 | 0.00 | |
| Financial data (TTM basis) | |||||
| Net sales | 29,179 | 34,252 | 55,575 | 6,707 | |
| Three years growth rate | 14.9% | 13.0% | 32.1% | 26.9% | |
| Operating profit | 2,701 | 3,305 | 6,332 | 570 | |
| Three years growth rate | 18.9% | 1.5% | 40.2% | 44.5% | |
| Operating profit margin | 9.3% | 9.6% | 11.4% | 8.5% | |
Source: Each company data
Financial data I
| 2020/3 | 2021/3 | 2022/3 | ||||||||||
| Q1 | Q2 | Q3 | Q4 | Q1 | Q2 | Q3 | Q4 | Q1 | Q2 | Q3 | Q4 | |
| [Sales by segment] | ||||||||||||
| Net sales | 4,988 | 5,234 | 5,455 | 5,460 | 5,093 | 5,437 | 5,782 | 6,355 | 6,098 | 7,400 | 7,747 | 7,932 |
| YoY | 12.1% | 7.2% | 7.8% | 15.0% | 2.1% | 3.9% | 6.0% | 16.4% | 19.7% | 36.1% | 34.0% | 24.8% |
| Enterprise business | 954 | 1,140 | 1,133 | 1,794 | 1,523 | 1,540 | 1,710 | 2,246 | 2,029 | 2,833 | 3,074 | 3,553 |
| YoY | 46.3% | 41.5% | 32.0% | 82.5% | 59.6% | 35.1% | 50.9% | 25.2% | 33.2% | 83.9% | 79.7% | 58.2% |
| Composition of sales | 19.1% | 21.8% | 20.8% | 32.9% | 29.9% | 28.3% | 29.6% | 35.3% | 33.3% | 38.3% | 39.7% | 44.8% |
| System testing | 430 | 570 | 488 | 924 | 788 | 777 | 937 | 1,078 | 1,018 | 1,144 | 1,233 | 1,558 |
| YoY | 65.8% | 99.5% | 33.5% | 91.4% | 83.1% | 36.2% | 92.0% | 16.7% | 29.2% | 47.2% | 31.5% | 44.5% |
| Composition of sales | 8.6% | 10.9% | 8.9% | 16.9% | 15.5% | 14.3% | 16.2% | 17.0% | 16.7% | 15.5% | 15.9% | 19.6% |
| IT services / Security | 523 | 569 | 645 | 869 | 735 | 763 | 772 | 1,167 | 1,011 | 1,688 | 1,841 | 1,995 |
| YoY | 33.4% | 9.5% | 30.9% | 73.9% | 40.4% | 34.1% | 19.8% | 34.3% | 37.5% | 121.2% | 138.2% | 70.9% |
| Composition of sales | 10.5% | 10.9% | 11.8% | 15.9% | 14.4% | 14.0% | 13.4% | 18.4% | 16.6% | 22.8% | 23.8% | 25.2% |
| Entertainment business | 4,033 | 4,093 | 4,321 | 3,666 | 3,566 | 3,900 | 4,072 | 4,109 | 4,069 | 4,566 | 4,672 | 4,378 |
| YoY | 6.2% | 0.5% | 2.9% | -5.4% | -11.6% | -4.7% | -5.8% | 12.1% | 14.0% | 17.1% | 14.7% | 6.6% |
| Composition of sales | 80.9% | 78.2% | 79.2% | 67.1% | 70.0% | 71.7% | 70.4% | 64.7% | 66.7% | 61.7% | 60.3% | 55.2% |
| New sub-segments | ||||||||||||
| Domestic debugging | 2,681 | 2,846 | 2,953 | 3,054 | 2,931 | 3,030 | 3,149 | 3,011 | ||||
| YoY | – | – | – | – | 9.3% | 6.4% | 6.7% | -1.4% | ||||
| Composition of sales | 52.7% | 52.4% | 51.1% | 48.1% | 48.1% | 41.0% | 40.7% | 38.0% | ||||
| Global and other | 887 | 1,049 | 1,118 | 1,054 | 1,137 | 1,536 | 1,522 | 1,366 | ||||
| YoY | – | – | – | – | 28.2% | 46.3% | 36.1% | 29.6% | ||||
| Composition of sales | 17.4% | 19.3% | 19.3% | 16.6% | 18.7% | 20.8% | 19.7% | 17.2% | ||||
| Old sub-segments | ||||||||||||
| Debugging | 3,444 | 3,480 | 3,730 | 3,167 | 3,023 | 3,235 | 3,375 | 3,424 | – | – | – | – |
| YoY | 10.8% | 6.0% | 6.8% | -1.5% | -12.2% | -7.0% | -9.5% | 8.1% | – | – | – | – |
| Composition of sales | 69.1% | 66.5% | 68.4% | 58.0% | 59.4% | 59.5% | 58.4% | 53.9% | – | – | – | – |
| Game Consoles | 1,186 | 1,056 | 1,341 | 1,126 | 1,023 | 1,147 | 1,258 | 1,402 | – | – | – | – |
| YoY | 21.1% | 5.4% | 15.9% | 10.7% | -13.7% | 8.6% | -6.2% | 24.5% | – | – | – | – |
| Composition of sales | 23.8% | 20.2% | 24.6% | 20.6% | 20.1% | 21.1% | 21.8% | 22.1% | – | – | – | – |
| Mobile solutions | 2,013 | 2,171 | 2,141 | 1,848 | 1,819 | 1,959 | 2,005 | 1,870 | – | – | – | – |
| YoY | 1.0% | 1.7% | 2.0% | -4.9% | -9.6% | -9.8% | -6.4% | 1.2% | – | – | – | – |
| Composition of sales | 40.4% | 41.5% | 39.2% | 33.8% | 35.7% | 36.0% | 34.7% | 29.4% | – | – | – | – |
| Amusement | 245 | 253 | 248 | 193 | 179 | 130 | 111 | 153 | – | – | – | – |
| YoY | 77.5% | 75.7% | 4.6% | -24.3% | -26.9% | -48.6% | -55.2% | -20.7% | – | – | – | – |
| Composition of sales | 4.9% | 4.8% | 4.5% | 3.5% | 3.5% | 2.4% | 1.9% | 2.4% | – | – | – | – |
| Creative | 350 | 307 | 282 | 285 | 311 | 367 | 372 | 398 | – | – | – | – |
| YoY | -31.4% | -45.2% | -33.1% | -27.6% | -11.2% | 19.6% | 32.0% | 39.2% | – | – | – | – |
| Composition of sales | 7.0% | 5.9% | 5.2% | 5.2% | 6.1% | 6.8% | 6.4% | 6.3% | – | – | – | – |
| Media and others | 238 | 306 | 308 | 212 | 234 | 294 | 324 | 286 | – | – | – | – |
| YoY | 35.5% | 32.6% | 8.7% | -19.4% | -1.5% | -3.9% | 5.0% | 34.5% | – | – | – | – |
| Composition of sales | 4.8% | 5.9% | 5.7% | 3.9% | 4.6% | 5.4% | 5.6% | 4.5% | – | – | – | – |
| Operating profit | 189 | 328 | 547 | 327 | 158 | 369 | 655 | 725 | 636 | 733 | 753 | 577 |
| YoY | -37.2% | -30.9% | 18.0% | -9.9% | -16.4% | 12.4% | 19.7% | 121.3% | 301.3% | 98.5% | 14.9% | -20.4% |
| Operating profit margin | 3.8% | 6.3% | 10.0% | 6.0% | 3.1% | 6.8% | 11.3% | 11.4% | 10.4% | 9.9% | 9.7% | 7.3% |
| Enterprise business | -184 | 2 | 14 | 100 | -21 | -7 | 64 | 152 | 87 | 144 | 171 | 246 |
| YoY | – | – | – | – | – | – | 363.5% | 52.4% | – | – | 163.8% | 61.9% |
| Segment profit margin | -19.4% | 0.3% | 1.2% | 5.6% | -1.4% | -0.5% | 3.8% | 6.8% | 4.3% | 5.1% | 5.6% | 6.9% |
| Entertainment business | 727 | 760 | 891 | 585 | 517 | 700 | 936 | 923 | 930 | 975 | 978 | 783 |
| YoY | 7.3% | -8.8% | 6.1% | -20.3% | -28.9% | -8.0% | 5.0% | 57.9% | 79.9% | 39.3% | 4.5% | -15.2% |
| Segment profit margin | 18.0% | 18.6% | 20.6% | 16.0% | 14.5% | 18.0% | 23.0% | 22.5% | 22.9% | 21.4% | 20.9% | 17.9% |
Source: Omega Investment, based on company data
Financial data II
| 2020/3 | 2021/3 | 2022/3 | ||||||||||
| Q1 | Q2 | Q3 | Q4 | Q1 | Q2 | Q3 | Q4 | Q1 | Q2 | Q3 | Q4 | |
| [Statements of income] | ||||||||||||
| Net sales | 4,988 | 5,234 | 5,455 | 5,460 | 5,093 | 5,437 | 5,782 | 6,355 | 6,098 | 7,400 | 7,747 | 7,932 |
| Cost of sales | 3,772 | 3,830 | 3,949 | 3,953 | 3,819 | 4,002 | 4,001 | 4,700 | 4,271 | 5,290 | 5,579 | 5,645 |
| Gross profit | 1,216 | 1,403 | 1,506 | 1,507 | 1,273 | 1,437 | 1,781 | 1,655 | 1,827 | 2,109 | 2,167 | 2,287 |
| SG&A expenses | 1.026 | 1,074 | 958 | 959 | 1,115 | 1,067 | 1,126 | 1,150 | 1,191 | 1,375 | 1,414 | 1,709 |
| Operating profit | 189 | 328 | 547 | 327 | 158 | 369 | 655 | 725 | 636 | 733 | 753 | 577 |
| Non-operating income | 3 | 2 | 1 | 1 | 38 | 10 | 24 | 5 | 38 | 31 | 12 | 30 |
| Non-operating expenses | 3 | 7 | 7 | 7 | 2 | 3 | 4 | 10 | 4 | 4 | 5 | 21 |
| Ordinary profit | 189 | 323 | 542 | 542 | 194 | 376 | 675 | 720 | 670 | 760 | 759 | 587 |
| Extraordinary income | 0 | 0 | 0 | 19 | 32 | 13 | 66 | 1 | 1 | |||
| Extraordinary expenses | 0 | 0 | 75 | 82 | 13 | 16 | 415 | 2 | 42 | 32 | 35 | |
| Net profit before income taxes | 189 | 323 | 542 | 240 | 113 | 381 | 691 | 318 | 681 | 785 | 730 | 552 |
| Total income taxes | 77 | 159 | 162 | 99 | 38 | 122 | 224 | 145 | 189 | 281 | 233 | 38 |
| Net profit attributable to owners of the parent |
112 | 165 | 375 | 139 | 99 | 256 | 438 | 180 | 487 | 429 | 445 | 417 |
| [Balance Sheets] | ||||||||||||
| Current assets | 6,717 | 7,574 | 7,710 | 7,453 | 6,648 | 7,291 | 8,017 | 9,744 | 9,604 | 9,848 | 10,658 | 10,392 |
| Cash and deposits | 3,650 | 3,849 | 3,882 | 3,739 | 3,027 | 3,482 | 4,085 | 5,076 | 4,911 | 5,435 | 5,746 | 5,208 |
| Notes and accounts receivable | 2,677 | 3,017 | 3,013 | 2,985 | 2,889 | 3,099 | 3,201 | 4,097 | ||||
| Notes, accounts receivable and contract assets |
4,161 | 3,872 | 4,372 | 4,411 | ||||||||
| Non-current assets | 2,481 | 3,252 | 3,227 | 3,184 | 3,205 | 3,167 | 3,160 | 4,593 | 6,321 | 6,178 | 6,342 | 7,172 |
| Tangible fixed assets | 545 | 646 | 627 | 579 | 560 | 549 | 565 | 598 | 602 | 623 | 621 | 693 |
| Intangible fixed assets | 793 | 1,404 | 1,390 | 1,379 | 1,445 | 1,424 | 1,433 | 2,670 | 4,389 | 4,244 | 4,225 | 5,094 |
| Goodwill | 491 | 1,066 | 1,033 | 1,027 | 1,032 | 991 | 950 | 2,467 | 4,175 | 4,042 | 3,945 | 4,763 |
| Investments and other assets | 1,142 | 1,202 | 1,209 | 1,225 | 1,199 | 1,193 | 1,161 | 1,324 | 1,330 | 1,309 | 1,495 | 1,384 |
| Total assets | 9,199 | 10,827 | 10,938 | 10,637 | 9,854 | 10,459 | 11,177 | 14,338 | 15,925 | 16,026 | 17,001 | 17,565 |
| Current liabilities | 3,621 | 4,679 | 4,863 | 5,135 | 4,450 | 4,655 | 5,061 | 7,904 | 8,954 | 8,775 | 9,354 | 9,679 |
| Short-term borrowings | 1,704 | 2,504 | 2,506 | 2,546 | 2,546 | 2,551 | 2,552 | 4,728 | 5,534 | 5,406 | 5,406 | 5,421 |
| Non-current liabilities | 622 | 624 | 629 | 63 | 62 | 132 | 135 | 119 | 294 | 55 | 58 | 309 |
| Long-term debt | 48 | 46 | 48 | – | – | 66 | 65 | 63 | 236 | – | – | 169 |
| Total liabilities | 4,243 | 5,304 | 5,493 | 5,198 | 4,513 | 4,788 | 5,196 | 8,024 | 9,249 | 8,830 | 9,413 | 9,989 |
| Total net assets | 4,955 | 5,523 | 5,445 | 5,438 | 5,340 | 5,670 | 5,980 | 6,314 | 6,677 | 7,196 | 7,588 | 7,576 |
| Shareholders’ equity | 4,734 | 5,039 | 4,919 | 4,898 | 4,841 | 5,172 | 5,460 | 5,642 | 5,983 | 6,436 | 6,719 | 6,776 |
| Capital | 300 | 300 | 300 | 300 | 300 | 300 | 300 | 300 | 300 | 300 | 300 | 300 |
| Legal capital reserve | 366 | 357 | 357 | 355 | 355 | 331 | 331 | 331 | 331 | 338 | 338 | – |
| Retained earnings | 6,378 | 6,543 | 6,765 | 6,904 | 6,848 | 7,105 | 7,393 | 7,575 | 7,916 | 8,342 | 8,626 | 9,021 |
| Treasury shares | -2,311 | -2,162 | -2,503 | -2,662 | -2,662 | -2,565 | -2,565 | -2,565 | -2,565 | -2,545 | -2,546 | -2,545 |
| Stock acquisition right | 13 | 13 | 13 | 13 | 13 | 13 | 13 | 13 | – | – | – | – |
| Total liabilities and net assets | 9,199 | 10,827 | 10,938 | 10,637 | 9,854 | 10,459 | 11,177 | 14,338 | 15,925 | 16,026 | 17,001 | 17,565 |
| [Statements of cash flows] | ||||||||||||
| Cash flow from operating activities | -5 | 1,086 | 101 | 1,416 | 1,703 | 3,077 | ||||||
| Net profit before tax and other adjustments |
513 | 1,296 | 494 | 1,504 | 1,466 | 2,749 | ||||||
| Cash flow from investing activities | -963 | 1,018 | -261 | -1,813 | -1,682 | -2,537 | ||||||
| Cash flow from financing activities | 637 | -515 | -90 | 1,730 | 316 | -546 | ||||||
| Free cash flow | 958 | 68 | 362 | 3,229 | 3,385 | 5,614 | ||||||
| Cash and cash equivalents at end of period |
-347 | -458 | -252 | 1,341 | 359 | 132 | ||||||
| Cash and cash equivalents at beginning of period |
4,162 | 4,162 | 3,704 | 3,704 | 5,041 | 5.041 | ||||||
| Cash and cash equivalents at end of period |
3,814 | 3,704 | 3,447 | 5,041 | 5,400 | 5,173 |
Source: Omega Investment, based on company data