2026-07-27
Home
Japanese

Omega Investment Co., Ltd.
Chiome Bioscience (Company Note 1Q upadate)

| Share price (5/26) | ¥168 | Dividend Yield (22/12 CE) | – % |
| 52weeks high/low | ¥386/156 | ROE(TTM) | -59.16 % |
| Avg Vol (3 month) | 351.7 thou shrs | Operating margin (TTM) | -207.58 % |
| Market Cap | ¥7.1 bn | Beta (5Y Monthly) | 1.13 |
| Enterprise Value | ¥5.4 bn | Shares Outstanding | 42.497 mn shrs |
| PER (22/12 CE) | – X | Listed market | TSE Growth |
| PBR (21/12 act) | 3.74 X |
| Click here for the PDF version of this page |
| PDF Version |
Progressing towards domestic clinical trials of CBA-1535.
Two new drug discovery projects have also entered the patent application stage.
◇Two in-house developed products enter the clinical stage. Pipeline research and development are progressing steadily.
In the drug discovery and development business, each pipeline is progressing well; CBA-1535 has been submitted for clinical trials in Japan and is being coordinated for administration to patients from the middle of this year. Various procedures are underway for the second half of the Phase I trial for CBA-1205. A new drug discovery project also entered the patent application stage. The results for 1Q FY2022/12 were in line with expectations, with no surprises. The drug discovery support business recorded sales of 128 million yen, while the operating loss increased to 486 million yen.
The shares of bioscience companies had been sliding down but appear to have stopped falling since the beginning of this year. The company’s share price has also remained in the range of 150 yen to a little more than 200 yen a share. The company is expected to announce events that eventually generate earnings, such as licence agreements with partners and milestone revenues. We believe the shares are worth continuing a close monitor.
◇Results for 1Q FY2022/12
Chiome Bioscience’s 1Q results for FY2022/12 were sales of 128 million yen (-47.8% yoy) and an operating loss of 486 million yen (vs an operating loss of 155 million yen in the same quarter of last year). These reflect the absence of the upfront payment of 103 million yen recorded in the drug discovery business last year.
In the drug discovery and development business, R&D costs were 446 million yen, an increase of 229 million yen yoy, and the segment posted an operating loss of 446 million yen, compared with the loss of 113 million yen a year earlier. R&D expenses rose due to the costs related to the completion of manufacturing of the investigational drug for CBA-1535.
The drug discovery support business continued to enjoy stable business with existing customers, mainly domestic pharmaceutical companies, posting sales of 128 million yen (-10.1% yoy) and a segment profit of 70 million yen (-10.7% yoy). Sales dropped mainly because of the absence of a large spot project in the same period of the previous year. Looking at Q1 alone, the new Accounting Standard for Revenue Recognition, introduced this year, also slightly impacted. The segment’s profit margin was 55.1%, meeting the management’s target of 50%.
As per BS, cash and deposits at the end of March 2022 were 1,744 million yen, a decrease of 46 million yen from the end of December 2021. In addition, current assets decreased by 211 million yen, partly due to the withdrawal of advance payment and recording it as an expense in the current period, following the completion of the production of the investigational medicinal product for CBA-1535. Total net assets amounted to 1,653 million yen (1,893 million yen at the end of the previous fiscal year), as a combined result of a 126 million yen increase in capital stock and capital reserve due to the exercise of subscription rights and a 488 million yen decrease in retained earnings due to the net loss for the year. Total liabilities and net assets registered 2,126 million yen (vs 2,339 million yen at the end of the last year). The equity ratio was 76.3%, dropping by 3.1 points from 79.4% at the end of December 2021.
| JPY, mn, % | Net sales | YoY % |
Oper. profit |
YoY % |
Ord. profit |
YoY % |
Profit ATOP |
YoY % |
EPS (¥) |
| 2018/12 | 212 | -18.1 | -1,539 | – | -1,533 | – | -1,533 | – | -57.26 |
| 2019/12 | 447 | 110.3 | -1,401 | – | -1,410 | – | -1,403 | – | -44.61 |
| 2020/12 | 480 | 7.4 | -1,283 | – | -1,291 | – | -1,293 | – | -36.06 |
| 2021/12 | 712 | 48.3 | -1,334 | – | -1,329 | – | -1,479 | – | -36.74 |
| 2022/12 (CE) | – | – | – | – | – | – | – | – | – |
| 2021/12 1Q | 246 | 171.1 | -155 | – | -149 | – | -160 | – | -4.00 |
| 2022/12 1Q | 128 | -47.8 | -486 | – | -491 | – | -492 | – | -11.66 |
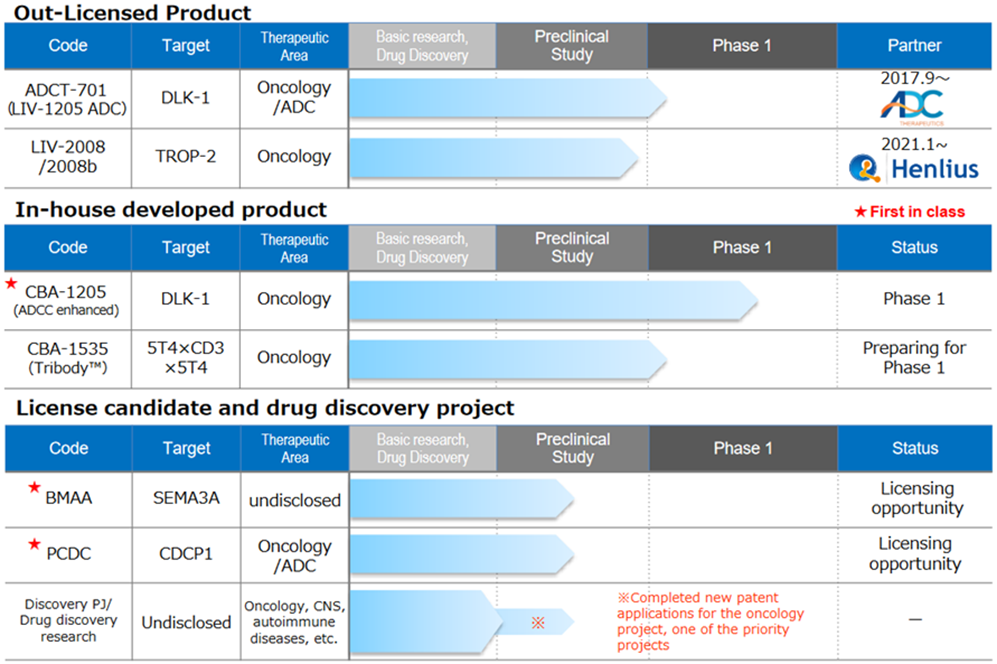
Drug discovery and development business – pipeline
Source: Company materials
◇Pipeline growth
<Out-licensed products>
*LIV-1205; Out-licensed to ADC Therapeutics, Switzerland, for ADC use only. ADCT is preparing a clinical trial in neuroendocrine cancer, collaborating with the National Cancer Institute (NCI), USA.
*LIV-2008; In January 2021, a licence agreement was signed with Shanghai Henlius Biotech, Inc. in China. The licence grants development, manufacturing and marketing rights in China, Taiwan, Hong Kong and Macau; Henlius is discussing several development plans for future IND filings. Furthermore, licensing activities to other pharmaceutical companies are ongoing.
<In-house developed products>
*CBA-1205; The first half of the Phase I trial in patients with solid tumours conducted at the National Cancer Centre showed high safety and tolerability. Several cases of patients refractory to standard treatment, which continued treatment for more than six months, were confirmed. The development schedule is progressing well. Enrolment of patients for the second part of the Phase 1 study in patients with hepatocellular carcinoma (HCC) and procedures at the investigational sites are currently underway. The company aims to out-licence the drug sometime during 2023-2025, depending on the progress of the second part of the Phase I trial. The company could mark a surplus profit year if it receives an upfront payment for out-licensing.
*CBA-1535; Tribody manufacturing process was established, and GMP API and investigational drug production were completed. A clinical trial notification was submitted to PMDA on 16 February. This is the world’s first clinical trial for Tribody. If this concept is confirmed, the potential for application of Tribody to many cancer antigens will be expanded.
<Out-licensing candidates>
*BMAA; Along with the research data obtained to date, activities continue to search for and license out new diseases involving semaphorin 3A.
*PCDC; Promoting licensing activities focusing on ADC applications and accumulating animal study data. Patent information on the application was published by the World Intellectual Property Organisation in July 2021. The target molecule is CDCP1, a first-in-class antibody targeting solid tumours (lung, head and neck, oesophageal, colorectal, cervical, etc.). Licensing activities are ongoing.
*Drug discovery research projects; The company is constantly conducting drug discovery research on around 10 themes and is continuing its efforts to create a new drug discovery pipeline for the future. Specific target molecules are undisclosed until patent publication, but target areas include oncology, central nervous system and autoimmune diseases.
Of these, the company is particularly focused on two key projects. In January 2022, a new patent application was completed for an oncology project. Research is progressing on a new drug discovery project related to Tribody, with patent applications expected during 2022.
◇Progress in drug discovery support business: extension of contract research with the Chugai Group.
The drug discovery support business is important to the company as a stable source of revenue, as the drug discovery and development business requires significant R&D investment. Businesses with existing customers, mainly domestic pharmaceutical companies, are progressing steadily.
◇Core technology: evolving and deepening the use and improvement of the ADLib®︎ system/Tribody.
The company is continuing to utilise and improve its core technology, the ADLib ®︎ system, including participation in a project funded by the Japan Agency for Medical Research and Development (AMED). The company received patent applications for the ADLib ®︎ system in Japan and Europe. In addition, research results on cancer immunotherapy using TribodyTM technology were published in academic journals. The system is expected to contribute to the enhancement of technologies related to the drug discovery support business, as well as to the strengthening of the in-house drug discovery pipeline.
◇Finance: Fine with funding for the research and development for the current fiscal year
On 15 December 2021, the company issued the 18th warrant (with an exercise price amendment clause) through a third-party allotment and agreed to raise approximately 1.7 billion yen. The company is on track to secure R&D investment during the current financial year (approximately 26% exercised at the end of April). It plans to continue to invest in research and development without a slowdown. Depending on future trends in income and expenditure in the drug discovery support business and milestone income, the company will take a flexible approach to finance from the next financial year onwards.
◇Forecast for FY2022/12: The drug discovery support business (12 months sales estimate: 620 million yen) is progressing on target.
Concerning the outlook for FY2022/12, the company is going for sales of 620 million yen from its drug discovery support business, which should continue to generate profit. Depending on the progress of drug discovery projects, upfront payments and milestone revenues may be received. On the other hand, R&D investment will likely remain around 1 billion yen a year, due to the high costs of clinical trials and manufacturing of investigational drugs as each pipeline progresses.
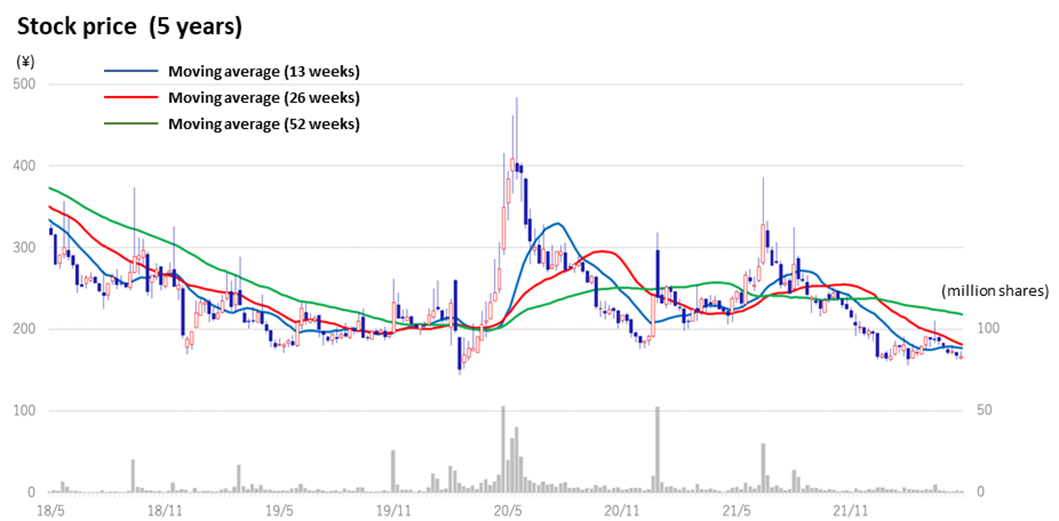
◇Stock price: appears to be bottoming out, albeit affected by the sell-off of bioscience stocks
In the aftermath of the global adjustment of growth stocks since late 2021, the share prices of domestic drug discovery ventures were sold off. However, since the beginning of May, they appear to be bottoming out.
The company’s share price went down amidst declining bioscience stocks since hitting a high of 386 yen on 8 July 2021. In the meantime, the company’s drug discovery projects have been progressing steadily, and positive news on clinical trial applications and patent filings were revealed consistently. The shares may well react to the announcement of events that points to earnings generation, such as licence agreements with partners and milestone revenues.
Stock price (5 years)
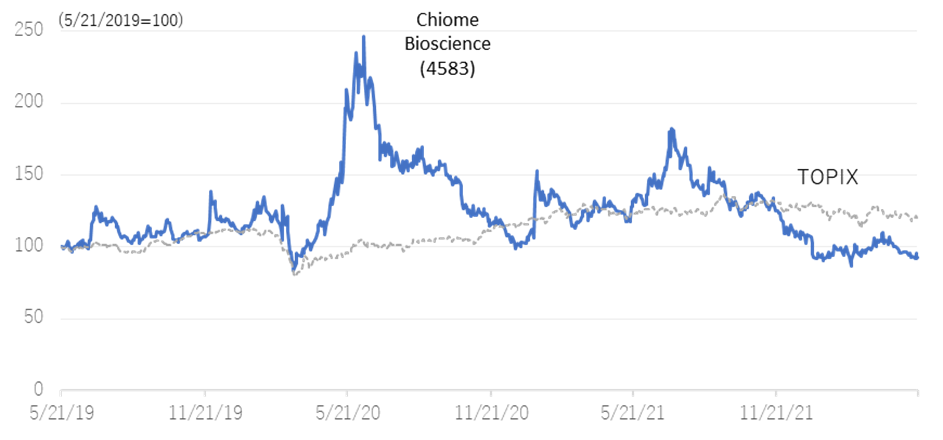
Relative chart; Chiome Bioscience (4583) and TOPIX (3 years)
Financial data
| FY (¥mn) | 2019/12 | 2020/12 | 2021/12 | 2022/12 | |||||||||
| 1Q | 2Q | 3Q | 4Q | 1Q | 2Q | 3Q | 4Q | 1Q | 2Q | 3Q | 4Q | 1Q | |
| [Statements of income] | |||||||||||||
| Net sales | 64 | 77 | 142 | 165 | 91 | 82 | 139 | 169 | 246 | 139 | 157 | 171 | 128 |
| Drug Discovery and Development Business | 0 | 1 | 1 | 28 | 1 | 1 | 0 | 1 | 103 | 0 | 0 | 0 | 0 |
| Drug Discovery Support Business | 63 | 76 | 142 | 137 | 90 | 82 | 138 | 168 | 143 | 138 | 157 | 171 | 128 |
| Cost of sales | 27 | 26 | 58 | 52 | 61 | 46 | 59 | 70 | 64 | 62 | 78 | 86 | 57 |
| Gross profit | 37 | 51 | 84 | 113 | 30 | 36 | 80 | 99 | 182 | 77 | 79 | 84 | 70 |
| SG&A expenses | 464 | 374 | 503 | 346 | 456 | 346 | 424 | 303 | 337 | 337 | 515 | 568 | 557 |
| R&D expenses | 363 | 273 | 407 | 256 | 343 | 266 | 342 | 206 | 216 | 243 | 401 | 451 | 446 |
| Operating loss | -426 | -324 | -419 | -233 | -426 | -310 | -344 | -204 | -155 | -260 | -436 | -483 | -486 |
| Non-operating income | 0 | 1 | 4 | 0 | 2 | 0 | 3 | 0 | 7 | 0 | 2 | 4 | 0 |
| Non-operating expenses | 6 | 4 | 4 | 0 | 0 | 2 | 10 | 1 | 1 | 0 | 1 | 6 | 4 |
| Ordinary loss | -432 | -327 | -418 | -233 | -425 | -311 | -351 | -205 | -150 | -259 | -434 | -486 | -491 |
| Extraordinary income | 2 | 1 | 6 | 0 | 0 | 0 | 0 | ||||||
| Extraordinary expenses | |||||||||||||
| Loss before income taxes | -430 | -326 | -412 | -233 | -425 | -310 | -351 | -205 | -149 | -247 | -433 | -636 | -491 |
| Total income taxes | 1 | 0 | 1 | 0 | 1 | 0 | 1 | 1 | 11 | 1 | 1 | 0 | 1 |
| Net loss | -431 | -326 | -413 | -234 | -425 | -311 | -352 | -206 | -161 | -248 | -434 | -637 | -492 |
| [Balance Sheets] | |||||||||||||
| Current assets | 3,048 | 3,206 | 2,807 | 2,561 | 2,309 | 2,805 | 3,316 | 3,249 | 3,294 | 3,088 | 2,675 | 2,216 | 2,005 |
| Cash and deposits | 2,776 | 2,899 | 2,469 | 2,106 | 1,967 | 2,472 | 2,881 | 2,686 | 2,580 | 2,302 | 2,071 | 1,790 | 1,744 |
| Non-current assets | 219 | 217 | 242 | 247 | 247 | 249 | 249 | 246 | 244 | 241 | 274 | 122 | 121 |
| Tangible assets | 15 | 14 | 12 | 11 | 10 | 9 | 8 | 7 | 6 | 6 | 4 | 4 | 3 |
| Investments and other assets | 204 | 204 | 230 | 236 | 237 | 240 | 241 | 238 | 237 | 235 | 269 | 118 | 117 |
| Total assets | 3,267 | 3,423 | 3,049 | 2,808 | 2,556 | 3,054 | 3,566 | 3,495 | 3,537 | 3,329 | 2,950 | 2,339 | 2,126 |
| Current liabilities | 177 | 207 | 154 | 145 | 315 | 427 | 378 | 343 | 378 | 428 | 468 | 392 | 419 |
| Short-term borrowings | 142 | 199 | 199 | 180 | 180 | 190 | 199 | 183 | 183 | ||||
| Non-current liabilities | 41 | 41 | 41 | 41 | 42 | 42 | 42 | 42 | 42 | 42 | 53 | 53 | 53 |
| Total liabilities | 219 | 248 | 196 | 187 | 357 | 469 | 420 | 385 | 420 | 470 | 522 | 446 | 473 |
| Total net assets | 3,048 | 3,175 | 2,853 | 2,622 | 2,199 | 2,585 | 3,146 | 3,110 | 3,118 | 2,859 | 2,428 | 1,893 | 1,653 |
| Total shareholders’ equity | 3,048 | 3,175 | 2,853 | 2,622 | 2,199 | 2,585 | 3,146 | 3,110 | 3,118 | 2,859 | 2,428 | 1,857 | 1,621 |
| Capital stock | 5,856 | 6,084 | 6,132 | 6,132 | 6,133 | 846 | 1,303 | 1,388 | 1,471 | 1,471 | 1,472 | 1,515 | 1,642 |
| Legal capital reserve | 5,846 | 6,074 | 6,122 | 6,122 | 6,123 | 2,446 | 2,903 | 2,987 | 3,071 | 3,071 | 3,072 | 3,115 | 3,242 |
| Retained earnings | -8,682 | -9,008 | -9,421 | -9,655 | -10,080 | -736 | -1,088 | -1,294 | -1,455 | -1,703 | -2,136 | -2,773 | 3,262 |
| Subscription rights to shares | 28 | 26 | 20 | 22 | 24 | 30 | 28 | 29 | 30 | 19 | 19 | 35 | 31 |
| Total liabilities and net assets | 3,267 | 3,423 | 3,049 | 2,808 | 2,556 | 3,054 | 3,566 | 3,495 | 3,537 | 3,329 | 2,950 | 2,339 | 2,126 |
| [Statements of cash flows] | |||||||||||||
| Cash flow from operating activities | -677 | -1,537 | -528 | -1,361 | -560 | -1,139 | |||||||
| Loss before income taxes | -755 | -1,401 | -734 | -1,290 | -396 | -1,466 | |||||||
| Cash flow from investing activities | – | -26 | – | 3 | – | -35 | |||||||
| Purchase of investment securities | – | – | – | – | – | – | |||||||
| Cash flow from financing activities | 1,248 | 1,341 | 894 | 1,944 | 176 | 271 | |||||||
| Proceeds from issuance of common shares | 1,249 | 1,345 | 697 | 1,769 | 166 | 253 | |||||||
| Net increase in cash and cash equiv. | 570 | -222 | 366 | 580 | -384 | -895 | |||||||
| Cash and cash equiv. at beginning of period | 2,328 | 2,328 | 2,105 | 2,105 | 2,686 | 2,686 | |||||||
| Cash and cash equiv. at end of period | 2,899 | 2,105 | 2,472 | 2,686 | 2,301 | 1,790 |
Note) For the cash flow statement, Q2 is the cumulative of Q1 to Q2, and Q4 is the cumulative of Q1 to Q4. Therefore, the beginning balance will be the beginning balance of Q1 for both Q2 and Q4.
Source: Omega Investment from Company materials.