2026-07-15
Home
Japanese

Omega Investment Co., Ltd.
Kidswell Bio (Company Note 4Q update)

| Share price (5/19) | ¥272 | Dividend Yield (23/3 CE) | – % |
| 52weeks high/low | ¥864 / 254 | ROE(TTM) | -32.14 % |
| Avg Vol (3 month) | 188.2 thou shrs | Operating margin (TTM) | -58.57 % |
| Market Cap | ¥8.5 bn | Beta (5Y Monthly) | 1.24 |
| Enterprise Value | ¥8.0 bn | Shares Outstanding | 31.437 mn shrs |
| PER (23/3 CE) | – X | Listed market | TSE Growth |
| PBR (22/3 act) | 5.57 X |
| Click here for the PDF version of this page |
| PDF Version |
The company updated its medium-term strategic plan.
The cell therapy business (regenerative medicine) will be further strengthened.
◇Summary of full-year results for FY2022/3
Kidswell Bio’s full-year results for FY2022/3 showed a 57.5% increase in sales and an operating loss of 910 million yen, almost unchanged from the previous year. Compared to the initial guidance, sales fell short of the target by 330 million yen, and the operating loss contracted, mainly due to a shift in the timing of the booking of some revenues. Meanwhile, the company revised its medium-term strategic plan and announced that it would focus mainly on the cell therapy business (regenerative medicine) of SHED (Stem cells from Human Exfoliated Deciduous teeth). As a result, the company postponed the planned achievement of an operating surplus in FY2023/3.
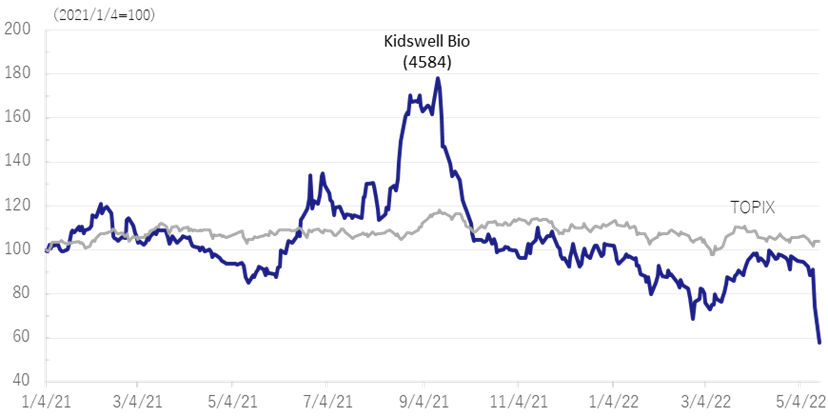
◇Stock price reaction
Following the result announcement on 12 May, the company’s shares hit a limit low on 13 May, closing at 358 yen, a significant drop from the previous day. While many biotech ventures are uncertain about the prospects of returning to profitability, the company had indicated earlier that it would return to profitability in FY2023/3 thanks to the progress of the biosimilar (BS) business. Hence, the announcement of the postponement of profitability is thought to have disappointed investors considerably. The operating environment of biosimilars had changed rapidly compared to a few years ago when the company entered the market. Meanwhile, the company’s cell therapy business (regenerative medicine) has been progressing well, and its focus on SHED looks timely. We would await further details on the execution of the new medium-term strategic plan, including the financing required to achieve it.
◇FY2022/3 results
The company’s full-year results for FY2022/3 showed a 57.5% increase in sales (1,569 million yen), an operating loss of 910 million yen (loss of 960 million yen in the previous year) and a net loss attributable to the parent company of 530 million yen (loss of 1.0 billion yen in the previous year).
Sales of biosimilars (BS) GBS-001 and GBS-011 exceeded the plan. The third BS, GBS-007, was launched in December 2021 and contributed to sales. Some sales of active pharmaceutical ingredients (API) related to the API manufacturing process for the fourth BS product were also booked. On the other hand, the SHED Master Cell Bank (MCB) sales, which were initially expected to be booked, were carried forward to the next financial year. As a result, the company underachieved its full-year sales forecast of 1.9 billion yen.
As per profit, the gross profit exceeded the company forecast thanks to steady revenue from BS. In addition, R&D costs (1.15 billion yen) were significantly lower than the initial forecast of 1.8 billion yen due to the readjustment of development costs, as the research and development related to JRM-001 were reviewed following the transfer of subsidiary JRM. As a result, the operating loss was 910 million yen, coming in lower than the company estimate of 1.72 billion yen. As reported in the 3Q results, the company booked an investment securities sales gain of 410 million yen, so the net loss attributable to the owner of the parent contracted by 460 million yen over the previous year.
| JPY, mn, % | Net sales | YoY % |
Oper. profit |
YoY % |
Ord. profit |
YoY % |
Profit ATOP |
YoY % |
EPS (¥) |
| 2018/3 | 1,059 | -2.7 | -913 | – | -903 | – | -904 | – | -47.27 |
| 2019/3 | 1,021 | -3.6 | -805 | – | -816 | – | -856 | – | -43.84 |
| 2020/3 | 1,077 | – | -1,161 | – | -1,187 | – | -7,316 | – | -264.65 |
| 2021/3 | 996 | -7.5 | -969 | – | -991 | – | -1,001 | – | -34.79 |
| 2022/3 | 1,569 | 57.7 | -919 | – | -952 | – | -535 | – | -17.35 |
| 2023/3 (CE) * | 2,900 | – | -980 | – | -999 | – | -1,000 | – | -31.82 |
* Forecasts are based to non-consolidation, due to the transition to unconsolidated accounts from FY2023/3.
Progress in the biosimilars business pipeline
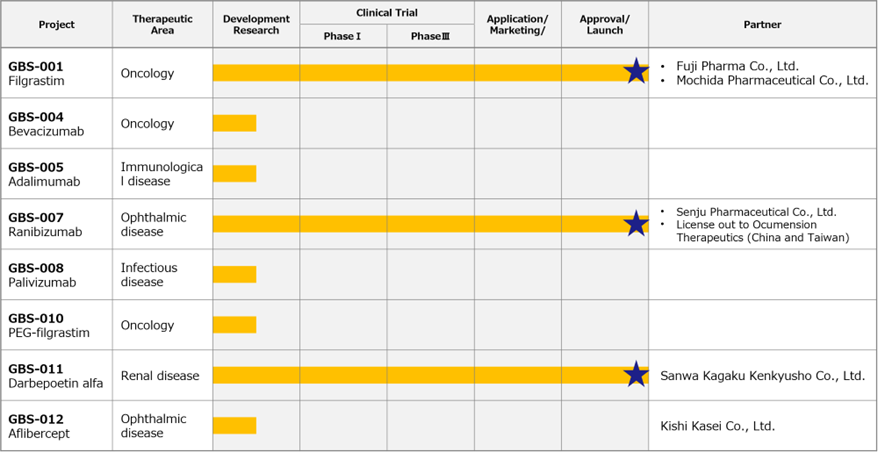
◇ Biosimilars business: GBS-007 is now manufactured and marketed.
*Ranibizumab (GBS-007): the third product in the BS business, ranibizumab BS, an anti-VEGF antibody drug for treating age-related macular degeneration, was launched on 9 December 2022 by development partner Senju Pharmaceutical Co., Ltd. The anti-VEGF antibody drug market in Japan alone is expected to be worth just under 100 billion yen in FY2020. Lucentis (Novartis Pharma K.K.), the direct competitor alone, is expected to be worth approximately 27 billion yen. As it is the first BS in the ophthalmology field, it attracts much attention. Before sales, the API was sold to Senju Pharmaceutical, which contributed to the earnings from 3Q.
*Filgrastim (GBS-001) and darbepoetin alfa (GBS-011): revenue from bulk drug sales and royalties on biosimilar GBS-001 and GBS-011, which the partners have already launched, is growing faster than planned. Ongoing cost reduction measures are also being taken to improve profitability.
*Fourth BS: in addition to the above three products, the company is currently developing a fourth BS to bring into the market by FY2025, having booked API sales in FY2022/3 related to API manufacturing process development.
◇ Cell therapy business (regenerative medicine): progress seen in each project.
In the regenerative medicine business, which is the company’s future focus, progress was made in the following areas.
*Establishment of the Master Cell Bank (MCB): MCB manufacturing in compliance with GMP, which is necessary for establishing the MCB, started in October 2021. Installing a stable supply system for the raw materials required for research and development is vital to advancing the SHED business. The company is working with ChiVo Net to recruit donors for the production of the raw material, has formed alliances with university hospitals, and is building an MCB supply structure with Nikon CeLL innovation Co., Ltd. and others. By completing GMP production, the company has made further progress towards the completion of MCB.
*Designer cells: in December 2021, the company signed a development agreement with BioMimetics Sympathies Inc (BMS) for the development of ‘designer cells’; BMS possesses culture medium development technology, which, when combined with the company’s SHED, will be used to obtain cells that are more suitable for bone and nerve diseases, while retaining strong SHED cell characteristics. The company aims to get cells with enhanced disease site-directedness while maintaining the vital attributes of SHED cells, which are suitable for bone and nerve diseases. The company announced in September 2021 that it had signed a joint research agreement with NanoCarrier Co., Ltd. and will focus on developing ‘designer cells’ as part of its initiatives on modality diversification, leveraging its alliances with other companies.
*The company sold the shares of JRM to Metcela: In April 2022, the company decided to sell the shares of its subsidiary Japan Regenerative Medicine (JRM) to Metcela Inc. The company had started a business alliance with Metcela in January 2022. Still, it concluded that it would be best for Metcela to take the lead in the development of regenerative medicine and other products utilising JRM’s intracardiac stem cells. The company will continue to support JRM’s development. In conjunction with JRM sales, the company will waive its claim (570 million yen) against JRM while acquiring shares in Metcela.
◇Forecast for FY2023/3
The company’s guidance for FY2023/3 includes sales of 2.9 billion yen, an operating loss of 980 million yen and a net loss of 1 billion yen. After selling the subsidiary, there are no longer any consolidated subsidiaries, so the forecasts are on a non-consolidated basis. Some sales planned for FY2022/3 are expected to be booked in FY2023/3, so sales will grow significantly. On the other hand, as per research and development costs, while development costs related to JRM-001 will be non-existent, investment in SHED and other growth areas will be expanded in line with the revised medium-term strategic plan described below. As a result, the management postponed the return to profitability, which they expected to achieve in FY2023/3 ahead of schedule.
◇Review of the medium-term strategic plan: KWB 2.0
The company published an update to its medium-term strategic plan and the financial results. The revision (KWB 2.0) aims to realise the company’s vision, “KIDS WELL, ALL WELL”, which is what children can be helped and what children can help while building on the company’s strengths.
The company cited changes in the external environment of the BS market as the primary reason for the revision. The company has built up a track record as a leading BS company but has seen the profitability of the BS business declining faster than expected, partly due to the emergence of biosames in the market. This leads to the forecast that the number of BS projects with satisfactory profitability could decrease. The company decided to shift itself away from a profit structure that relies solely on the BS business earlier than anticipated.
On the other hand, the company has achieved good progress in developing its cell therapy business (regenerative medicine), which it has been focusing on in recent years. The management appears to have decided that becoming a one-of-a-kind company that creates cell therapy and gene therapy products based on the unique SHED will help them realise the company vision quickly and increase the corporate value.
By reviewing the share price performance over the past decade, the management thinks that the stock market did not appreciate the business contribution by BS launches, which included three biosimilar launches.
KWB 2.0 – Expanding upfront investment for breakthroughs in SHED (cell therapy) –
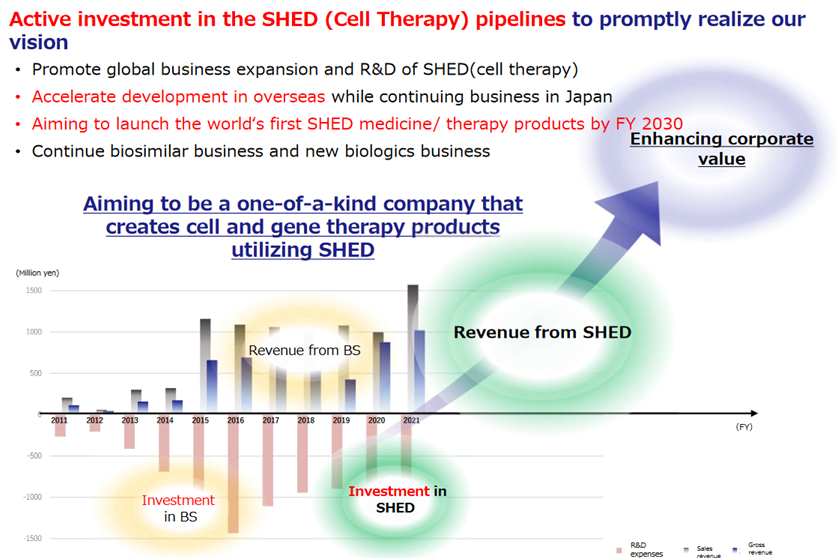
To strengthen the SHED business, the company has set out the following measures: 1) to establish a stable supply system ASAP to commercialise the first-generation SHED as early as possible, 2) to create next-generation technologies to commercialise second-generation SHED, 3) to strengthen the development system to acquire human resources and overseas bases, and 4) to raise funds to implement the strategy, including equity finance from overseas markets.
The company has announced new measures, such as establishing overseas bases for clinical development and fostering networks with overseas medical institutions and academia. It states that more than 5 billion yen will be needed for these overseas business development activities. With investment and development costs in Japan put together, the company thinks it will need more than 10 billion yen. Hence, it is considering fundraising in overseas markets. The company already hires many people with good overseas experience, but this initiative will be a more extensive investment and challenge.
The revised management plan led to the postponement of a return to profitability in the near term. However, the management has become increasingly confident in the market potential of the cell therapy business (regenerative medicine) and the competitiveness in this field. The details of KWB 2.0 will be announced at the time of the 2Q result announcement, which is scheduled for November 2022. We will continue to keep track of the company under the new management plan.
Relative share price (4584, TOPIX)
Financial data
| FY (¥mn) | 2020/3 | 2021/3 | 2022/3 | |||||||||
| 1Q | 2Q | 3Q | 4Q | 1Q | 2Q | 3Q | 4Q | 1Q | 2Q | 3Q | 4Q | |
| [Statements of income] | ||||||||||||
| Net sales | 284 | 30 | 419 | 345 | 121 | 53 | 547 | 276 | 303 | 438 | 642 | 186 |
| Cost of sales | 77 | 8 | 359 | 209 | 5 | 35 | 46 | 34 | 122 | 154 | 183 | 91 |
| Gross profit | 207 | 22 | 60 | 136 | 116 | 19 | 500 | 242 | 182 | 283 | 460 | 94 |
| SG&A expenses | 417 | 423 | 381 | 365 | 354 | 463 | 465 | 565 | 491 | 425 | 442 | 580 |
| R&D expenses | 235 | 249 | 201 | 213 | 138 | 265 | 198 | 363 | 297 | 236 | 237 | 380 |
| Operating profit (loss) | -210 | -401 | -321 | -229 | -238 | -445 | 36 | -323 | -309 | -142 | 18 | -486 |
| Non-operating income | 0 | 0 | 1 | 0 | 0 | 1 | 1 | 1 | 2 | 0 | 0 | 1 |
| Non-operating expenses | 2 | 1 | 20 | 4 | 7 | 5 | 4 | 8 | 6 | 8 | 15 | 7 |
| Ordinary profit (loss) | -212 | -402 | -340 | -233 | -244 | -450 | 33 | -330 | -314 | -150 | 4 | -493 |
| Extraordinary income | 4 | 0 | 0 | 2 | 418 | 0 | ||||||
| Extraordinary expenses | 5,939 | 0 | 0 | 194 | 0 | 1 | 8 | 0 | ||||
| Profit (loss) before income taxes | -6,147 | -402 | -340 | -425 | -244 | -451 | 26 | -331 | -314 | -148 | 421 | -493 |
| Total income taxes | 1 | 0 | 3 | -2 | 1 | 0 | 0 | 1 | 0 | 1 | 52 | -51 |
| Net profit (loss) | -6,147 | -403 | -342 | -424 | -245 | -451 | 25 | -330 | -314 | -149 | 369 | -441 |
| [Balance Sheets] | ||||||||||||
| Current assets | 2,761 | 2,390 | 3,238 | 3,322 | 3,573 | 3,218 | 3,329 | 3,346 | 2,794 | 3,203 | 3,722 | 3,326 |
| Cash equivalents and short-term securities |
1,654 | 1,602 | 2,482 | 2,033 | 2,658 | 2,502 | 1,830 | 1,461 | 874 | 974 | 1,253 | 1,187 |
| Non-current assets | 330 | 427 | 418 | 270 | 379 | 393 | 340 | 588 | 728 | 656 | 178 | 177 |
| Tangible assets | 2 | 2 | 2 | 2 | 2 | 2 | 2 | 3 | 3 | 2 | 2 | 2 |
| Investments and other assets | 328 | 425 | 416 | 268 | 374 | 389 | 336 | 582 | 722 | 651 | 173 | 173 |
| Total assets | 3,091 | 2,817 | 3,656 | 3,592 | 3,952 | 3,611 | 3,670 | 3,934 | 3,522 | 3,859 | 3,901 | 3,503 |
| Current liabilities | 421 | 550 | 529 | 881 | 772 | 858 | 925 | 1,114 | 823 | 1,034 | 1,045 | 1,129 |
| Short-term borrowings | 25 | 25 | 25 | 25 | 25 | |||||||
| Non-current liabilities | 25 | 24 | 1,224 | 1,224 | 1,384 | 1,287 | 1,231 | 1,209 | 1,051 | 826 | 718 | 656 |
| Long-term debt | 1,200 | 1,200 | 1,340 | 1,240 | 1,200 | 1,100 | 900 | 700 | 700 | 625 | ||
| Long-term borrowing | 600 | 600 | 600 | 600 | 600 | 600 | 600 | 600 | 600 | 525 | ||
| Convertible bonds | 600 | 600 | 740 | 640 | 600 | 500 | 300 | 100 | 100 | 100 | ||
| Total liabilities | 446 | 573 | 1,752 | 2,105 | 2,156 | 2,145 | 2,156 | 2,324 | 1,873 | 1,860 | 1,763 | 1,785 |
| Total net assets | 2,644 | 2,244 | 1,904 | 1,487 | 1,796 | 1,466 | 1,514 | 1,610 | 1,648 | 1,999 | 2,138 | 1,719 |
| Total shareholders’ equity | 2,644 | 2,244 | 1,904 | 1,487 | 1,796 | 1,466 | 1,514 | 1,610 | 1,648 | 1,999 | 2,138 | 1,719 |
| Capital | 612 | 612 | 612 | 612 | 842 | 892 | 912 | 1,032 | 1,150 | 1,420 | 1,420 | 1,421 |
| Legal capital reserve | 9,917 | 9,917 | 9,917 | 9,917 | 10,147 | 10,197 | 10,217 | 10,338 | 10,456 | 10,725 | 10,726 | 10,727 |
| Retained earnings | -7,908 | -8,311 | -8,653 | -9,077 | -9,322 | -9,773 | -9,748 | -10,079 | -10,393 | -10,542 | -10,173 | -10,614 |
| Stock acquisition right | 38 | 43 | 51 | 57 | 70 | 82 | 101 | 116 | 134 | 145 | 165 | 185 |
| Total liabilities and net assets | 3,091 | 2,817 | 3,656 | 3,592 | 3,952 | 3,611 | 3,670 | 3,934 | 3,522 | 3,859 | 3,901 | 3,503 |
| [Statements of cash flows] | ||||||||||||
| Cash flow from operating activities | -604 | -1,325 | -104 | -1,267 | -857 | -1,169 | ||||||
| Loss before income taxes | -6,548 | -7,314 | -695 | -999 | -462 | -533 | ||||||
| Cash flow from investing activities | -106 | -137 | -5 | -22 | – | 526 | ||||||
| Expenditure on acquisition of intangiblefixed assets |
– | – | -3 | -3 | – | -1 | ||||||
| Purchase of investment securities | -100 | -100 | – | – | – | – | ||||||
| Sales of investment securities | – | – | – | – | – | 526 | ||||||
| Cash flow from financing activities | 40 | 1,221 | 579 | 718 | 370 | 369 | ||||||
| Income from the issuance of convertible bond-type bonds with stock acquisition rights |
– | 599 | 599 | 599 | – | – | ||||||
| Income from issuance of shares by exercising stock acquisition rights |
40 | 40 | – | 138 | 370 | 369 | ||||||
| Income from issuance of stock acquisition rights |
– | 3 | 4 | 4 | – | – | ||||||
| Net increase in cash and cash equiv. | -670 | -240 | 468 | -571 | -486 | -273 | ||||||
| Cash and cash equiv. at beginning of period | 2,009 | 2,009 | 2,032 | 2,032 | 1,461 | 1,462 | ||||||
| Cash and cash equiv. at end of period | 1,602 | 2,032 | 2,501 | 1,461 | 974 | 1,187 |
Note: For the statement of cash flows, the figures for 2Q are the cumulative figures for the period from 1Q to 2Q, and the figures for 4Q are the cumulative figures for the period from 1Q to 4Q. Therefore, the opening balance is also the balance at the beginning of each quarter.
Source: Omega Investment from company materials