2026-07-15
Home
Japanese

Omega Investment Co., Ltd.
Chiome Bioscience (Company Note 2Q upadate)

| Share price (8/31) | ¥167 | Dividend Yield (22/12 CE) | – % |
| 52weeks high/low | ¥276/156 | ROE(TTM) | -84.99 % |
| Avg Vol (3 month) | 373.0 thou shrs | Operating margin (TTM) | -280.13 % |
| Market Cap | ¥7.4 bn | Beta (5Y Monthly) | 1.05 |
| Enterprise Value | ¥6.1 bn | Shares Outstanding | 44.023 mn shrs |
| PER (22/12 CE) | – X | Listed market | TSE Growth |
| PBR (21/12 act) | 5.01 X |
| Click here for the PDF version of this page |
| PDF Version |
CBA-1535 enters first clinical trial with TribodyTM
Other pipelines are also progressing well
◇CBA-1535 has entered Phase I clinical trials
In the drug discovery and development business, each pipeline is progressing well. In June, the first Phase I clinical trial for CBA-1535, the first in the company’s recent focus on TribodyTM, began, and CBA-1205 is now being administered to hepatocellular carcinoma patients in the second half of the Phase I trial. In new drug discovery projects, research on the TribodyTM drug discovery project progressed and a new patent application was completed in June. The research and development of each pipeline is going without delay.
The company’s share price has reacted to the announcements of alliances with various companies but has generally remained in the 150-200+ yen box range. The company will likely announce events leading to earnings generation, such as licence agreements with partners and milestone revenues. We would expect a positive share price reaction.
◇ Financial results for 2Q FY2022/12
Chiome Bioscience posted sales of 278 million yen (-27.7% yoy) and an operating loss of 779 million yen (vs an operating loss of 415 million yen in the same period of the previous fiscal year) in 2Q FY2022/12. In 1Q FY2021/12, an upfront payment of 103 million yen was recorded for the out-licensing of the drug discovery and development business to Henlius in 1Q, whereas this year, only sales from the drug discovery support business were recorded.
In the drug discovery and development business, R&D costs were 906 million yen, an increase of 231 million yen yoy, due to progress in clinical development, resulting in a segment loss of 690 million yen (loss of 356 million yen in 2Q FY2021/12).
The drug discovery support business continued to enjoy stable business with existing customers, mainly domestic pharmaceutical companies. Sales amounted to 278 million yen (down 3 million yen yoy), with a segment profit of 151 million yen (down 4 million yen). The main reason for the decline in sales was the absence of the large spot project booked in 1Q of the previous year. The segment profit margin was 54.3%, meeting the company target of 50%.
As per BS, total assets at end-June 2022 amounted to 1,920 million yen. This is a decrease of 419 million yen from end-December 2021. Cash and deposits decreased by 319 million yen to 1,471 million yen. Current assets also decreased by 105 million yen, partly due to the reversal of advance payment and recording it as an expense in the current period, following the completion of the manufacturing of the CBA-1535 investigational medicinal product. Total net assets amounted to 1,476 million yen (previous year-end: 1,893 million yen). Capital and capital reserves increased by 180 million yen each due to the exercise of subscription rights, while retained earnings decreased by 770 million yen due to the net loss for the year.
| JPY, mn, % | Net sales | YoY % |
Oper. profit |
YoY % |
Ord. profit |
YoY % |
Profit ATOP |
YoY % |
EPS (¥) |
| 2018/12 | 212 | -18.1 | -1,539 | – | -1,533 | – | -1,533 | – | -57.26 |
| 2019/12 | 447 | 110.3 | -1,401 | – | -1,410 | – | -1,403 | – | -44.61 |
| 2020/12 | 480 | 7.4 | -1,283 | – | -1,291 | – | -1,293 | – | -36.06 |
| 2021/12 | 712 | 48.3 | -1,334 | – | -1,329 | – | -1,479 | – | -36.74 |
| 2022/12 (CE) | – | – | – | – | – | – | – | – | – |
| 2021/12 2Q | 384 | 122.1 | -415 | – | -409 | – | -408 | – | -10.16 |
| 2022/12 2Q | 278 | -27.7 | -779 | – | -768 | – | -771 | – | -18.17 |
Drug discovery and development business – pipeline
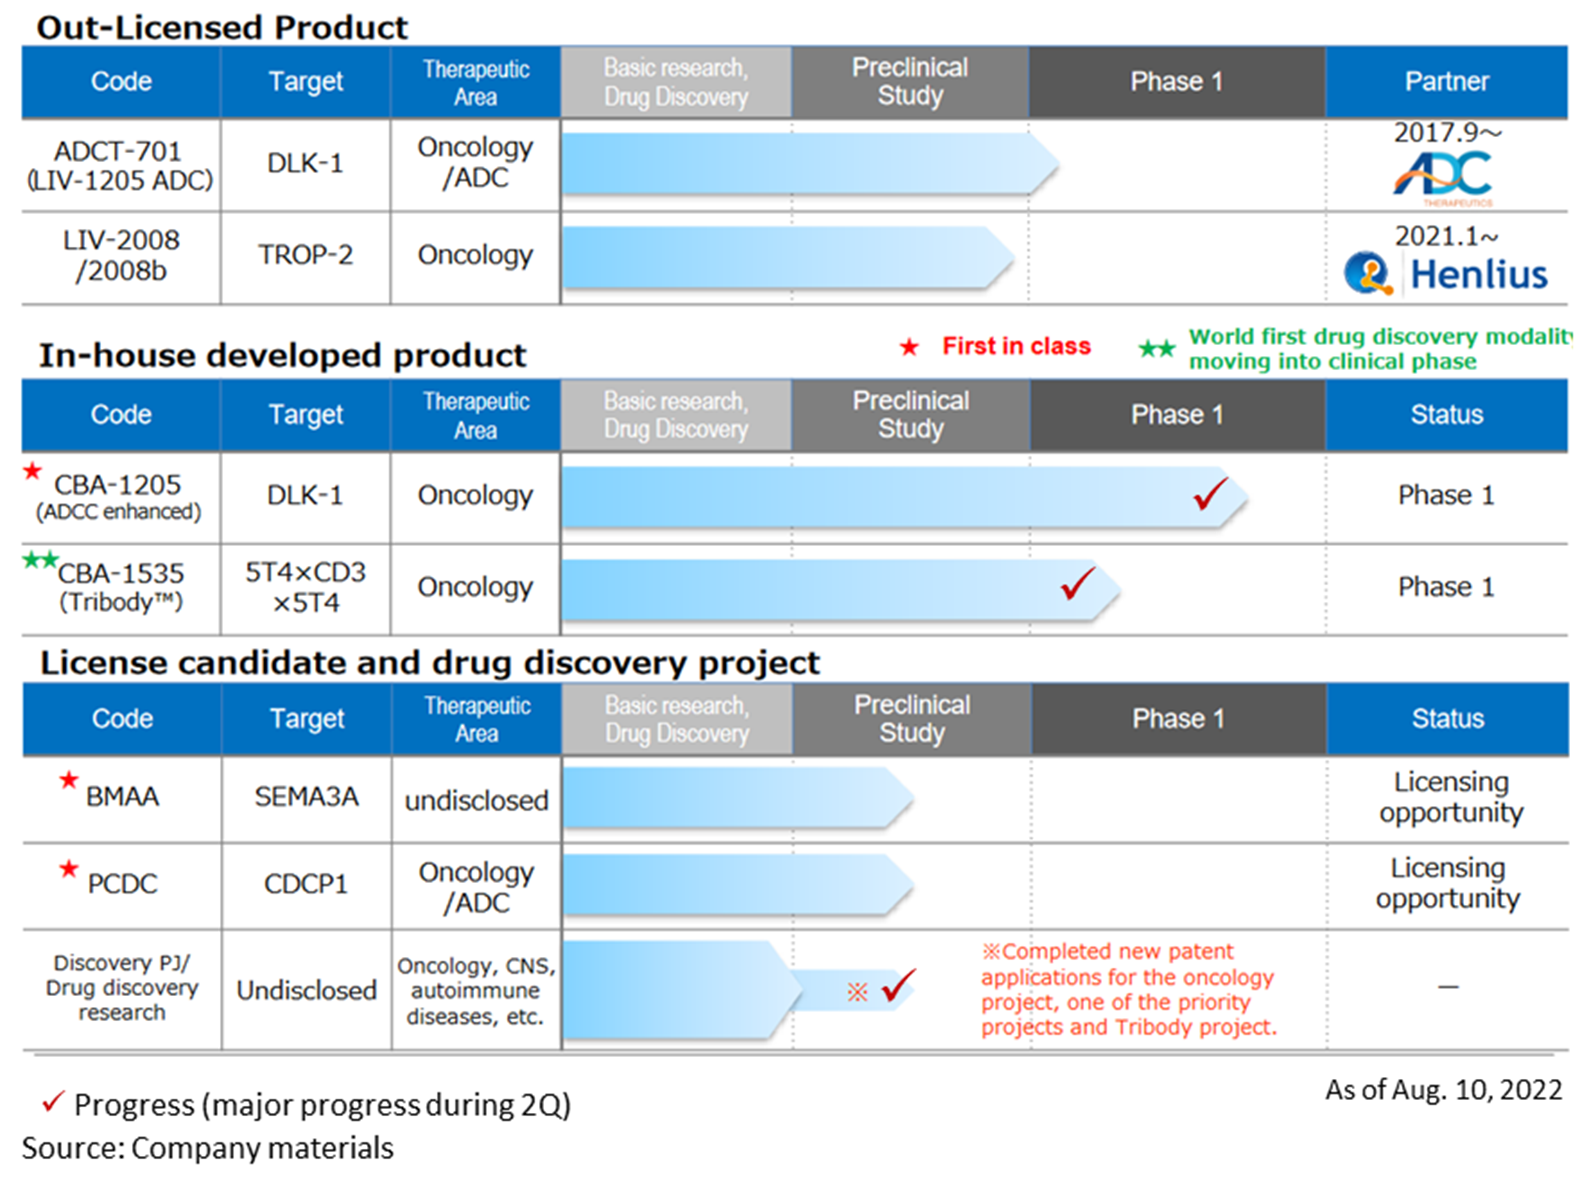
◇Progress in the pipeline:
<In-house developed products>
*CBA-1205; The first half of the Phase I clinical trial for patients with solid tumours conducted at the National Cancer Center showed high safety and tolerability. Although the complete analysis will take a little more time, the mid-stage of the study has identified several patients refractory to standard treatment who have continued to receive the drug for more than four months with an SD (stable) evaluation. The second part of the Phase 1 study has moved into the second half of the research, and dosing has started in patients with hepatocellular carcinoma.
Based on the progress of the second part of the Phase 1 study, CBA-1205 is expected to be licensed out sometime during CY2023-2025. The timing of out-licensing and the upfront payment for out-licensing differ between companies that want to expand their development pipeline as soon as possible and those that emphasise business feasibility and probability of success. The company is considering multiple potential out-licensing partners. It hopes to achieve a profit in a single year by 2023 at the earliest and by 2025 at the latest by receiving an upfront payment.
*CBA-1535: The company submitted a clinical trial plan notification to the PMDA in February 2022 and started Phase I clinical trials at the National Cancer Center Hospital and Shizuoka Cancer Center at the end of June. In the first part of the Phase I clinical trial, safety and efficacy signals were evaluated in patients with solid tumours. The second part will evaluate the drug’s efficacy in combination with cancer immunotherapy. The first part is scheduled to continue until the first half of 2024, while the second part is planned to be conducted in parallel from mid-2023, with the aim of confirming safety and efficacy as quickly as possible.
CBA-1535 is the first TribodyTM clinical trial in the world. If this concept is confirmed, it will expand the applicability of TribodyTM for many cancer antigens.
<Licensed Candidates>
*BMAA: In addition to the research data obtained to date, the search for new diseases involving semaphorin 3A and licensing activities are ongoing.
*PCDC: The company is promoting out-licensing activities focusing on ADC applications and the accumulation of animal test data. Licensing activities target pharmaceutical companies that want to expand their pipelines as ADCs and those that want antibodies for ADCs with their ADC technology.
In July, the company signed an option agreement with Heidelberg Pharma to in-licence its ADC technology and added Heidelberg Pharma’s animal model pharmacology data using amanitin to its out-licensing data package, further intensifying out-licensing activities.
*Drug discovery research project: in the field of TribodyTM, following CBA-1535, a new patent application was completed in June 2022 for a combination of new molecules to form a highly active TribodyTM antibody, including this molecule. This was the second patent application following the filing of a new patent application for an oncology project in January 2022.
Including the above, the company is constantly conducting drug discovery research on around ten themes. It continues to work towards the creation of a new drug discovery pipeline in the future.
<Out-licensed product>
*LIV-1205: out-licensed to ADC Therapeutics of Switzerland for ADC use only; ADCT is preparing for a clinical trial for neuroendocrine cancer in collaboration with the National Cancer Institute (NCI) in the US.
*LIV-2008: in January 2021, the company signed a licence agreement with Shanghai Henlius Biotech, Inc. in China. The licence grants development, manufacturing and marketing rights in China, Taiwan, Hong Kong and Macau. Henlius is considering several development plans for future IND filings. In addition, Henlius is continuing its out-licensing activities to other pharmaceutical companies.
◇ Progress in drug discovery support business: contract agreement concluded with Rohto Pharmaceutical Co.
On 11 July 2022, the company signed a new outsourcing agreement with Rohto Pharmaceutical to create therapeutic antibodies with option rights. The company will receive compensation for using its ADLib®︎ system to acquire antibodies to therapeutic target antigens for Rohth and for conducting affinity testing of the acquired antibodies. If the antibodies create the move to the commercialisation and development stage, option rights are exercised, and a licensing agreement is concluded with Rohth. (the option right is exercised for five years after the work related to the said delegation agreement).
In addition, a diagnostic kit to be developed using ADLib®︎ antibodies has been launched by Fujirebio.
Business with existing customers, mainly domestic pharmaceutical companies, is continuing steadily.
◇Core technology: evolving and deepening the use and improvement of the ADLib®︎ system/TribodyTM
The company continues to utilise and improve its core technology, the ADLib®︎ system, through participation in projects funded by the Japan Agency for Medical Research and Development (AMED). The company received patent applications for the ADLib®︎ system in Japan and Europe. In addition, research results on cancer immunotherapy using the TribodyTM technology were published in academic journals. It is expected to contribute to the enhancement of technologies related to the drug discovery support business as well as to the strengthening of the in-house drug discovery pipeline.
◇Financing trends: research and development funding secured for the current financial year
On 15 December 2021, the company issued its 18th warrant (with an exercise price amendment clause) through a third-party allotment and concluded an agreement to raise approximately 1.7 billion yen. The number of unexercised warrants remaining at the end of July 2022 was 43,999, and 45% had been exercised.
◇Outlook for FY2022/12: Drug discovery support business (annual sales of 620 million yen) is progressing as planned
The company has announced its FY2022/12 forecast for the drug discovery support business, which should generate ongoing revenues, at 620 million yen. Currently, this appears to be progressing in line with expectations. The company expects R&D investment to continue to be in the region of 1 billion yen per year due to the high costs of clinical trials and manufacturing of investigational drugs as each pipeline progresses.
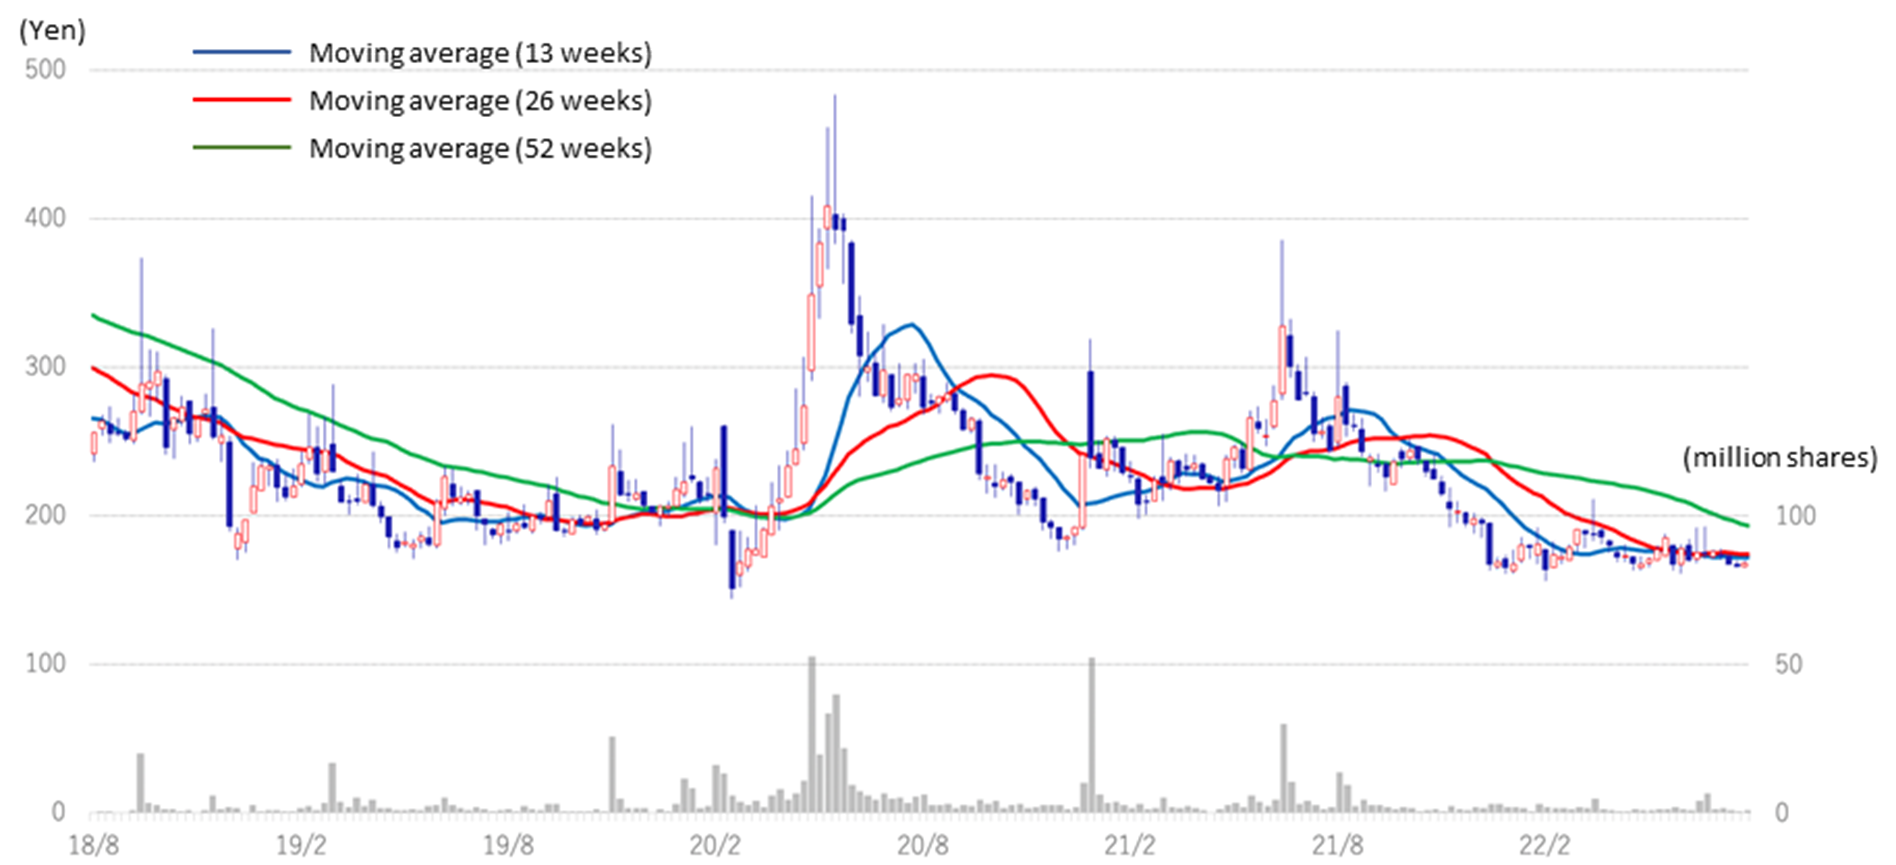
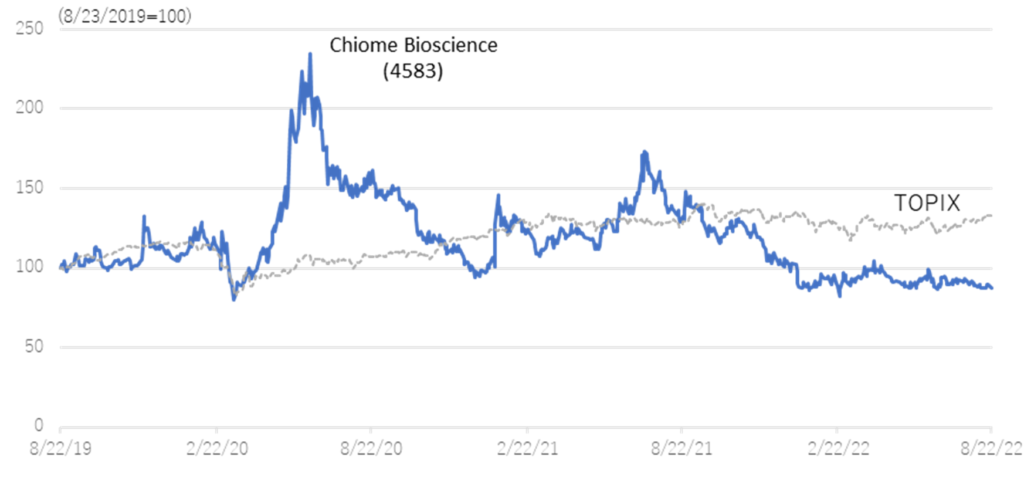
◇Share price: affected by biotech stock price adjustment but appears to be hitting bottom (see chart on next page)
In the aftermath of the global adjustment of growth technology stocks since the second half of 2021, the share prices of domestic drug discovery ventures also declined. However, share prices appears to cease falling since the outset of 2022.
Generally, research and development of biotech drug discovery takes a long time, and the development risk is high. There is a possibility of upfront and milestone income from out-licensing, but the timing and amount are uncertain. On the other hand, the company continues to disseminate positive news, such as clinical trial applications and patent applications. Its pipeline has several drug discovery projects, and clinical trials for CBA-1205 and CBA-1535 are progressing steadily. It has fulfilled its commitments to investors ahead of schedule. Given these, the current share price level should be attractive for investors who can take risks from a medium- to long-term perspective.
Stock price (3 years)
Relative chart; Chiome Bioscience (4583) and TOPIX (3 years)
Financial data
| FY (¥mn) | 2019/12 | 2020/12 | 2021/12 | 2022/12 | ||||||||||
| 1Q | 2Q | 3Q | 4Q | 1Q | 2Q | 3Q | 4Q | 1Q | 2Q | 3Q | 4Q | 1Q | 2Q | |
| [Statements of income] | ||||||||||||||
| Net sales | 64 | 77 | 142 | 165 | 91 | 82 | 139 | 169 | 246 | 139 | 157 | 171 | 128 | 149 |
| Drug Discovery and Development Business |
0 | 1 | 1 | 28 | 1 | 1 | 0 | 1 | 103 | 0 | 0 | 0 | 0 | 0 |
| Drug Discovery Support Business |
63 | 76 | 142 | 137 | 90 | 82 | 138 | 168 | 143 | 138 | 157 | 171 | 128 | 149 |
| Cost of sales | 27 | 26 | 58 | 52 | 61 | 46 | 59 | 70 | 64 | 62 | 78 | 86 | 57 | 69 |
| Gross profit | 37 | 51 | 84 | 113 | 30 | 36 | 80 | 99 | 182 | 77 | 79 | 84 | 70 | 80 |
| SG&A expenses | 464 | 374 | 503 | 346 | 456 | 346 | 424 | 303 | 337 | 337 | 515 | 568 | 557 | 373 |
| R&D expenses | 363 | 273 | 407 | 256 | 343 | 266 | 342 | 206 | 216 | 243 | 401 | 451 | 446 | 245 |
| Operating profit | -426 | -324 | -419 | -233 | -426 | -310 | -344 | -204 | -155 | -260 | -436 | -483 | -486 | -292 |
| Non-operating income | 0 | 1 | 4 | 0 | 2 | 0 | 3 | 0 | 7 | 0 | 2 | 4 | 0 | 16 |
| Non-operating expenses | 6 | 4 | 4 | 0 | 0 | 2 | 10 | 1 | 1 | 0 | 1 | 6 | 4 | 1 |
| Ordinary profit | -432 | -327 | -418 | -233 | -425 | -311 | -351 | -205 | -150 | -259 | -434 | -486 | -491 | -278 |
| Extraordinary income | 2 | 1 | 6 | 0 | 0 | 0 | 0 | |||||||
| Extraordinary expenses | ||||||||||||||
| Loss before income taxes | -430 | -326 | -412 | -233 | -425 | -310 | -351 | -205 | -149 | -247 | -433 | -636 | -491 | -278 |
| Total income taxes | 1 | 0 | 1 | 0 | 1 | 0 | 1 | 1 | 11 | 1 | 1 | 0 | 1 | 2 |
| Net income | -431 | -326 | -413 | -234 | -425 | -311 | -352 | -206 | -161 | -248 | -434 | -637 | -492 | -279 |
| [Balance Sheets] | ||||||||||||||
| Current assets | 3,048 | 3,206 | 2,807 | 2,561 | 2,309 | 2,805 | 3,316 | 3,249 | 3,294 | 3,088 | 2,675 | 2,216 | 2,005 | 1,792 |
| Cash and deposits | 2,776 | 2,899 | 2,469 | 2,106 | 1,967 | 2,472 | 2,881 | 2,686 | 2,580 | 2,302 | 2,071 | 1,790 | 1,744 | 1,471 |
| Non-current assets | 219 | 217 | 242 | 247 | 247 | 249 | 249 | 246 | 244 | 241 | 274 | 122 | 121 | 128 |
| Tangible assets | 15 | 14 | 12 | 11 | 10 | 9 | 8 | 7 | 6 | 6 | 4 | 4 | 3 | 3 |
| Investments and other assets | 204 | 204 | 230 | 236 | 237 | 240 | 241 | 238 | 237 | 235 | 269 | 118 | 117 | 124 |
| Total assets | 3,267 | 3,423 | 3,049 | 2,808 | 2,556 | 3,054 | 3,566 | 3,495 | 3,537 | 3,329 | 2,950 | 2,339 | 2,126 | 1,920 |
| Current liabilities | 177 | 207 | 154 | 145 | 315 | 427 | 378 | 343 | 378 | 428 | 468 | 392 | 419 | 390 |
| Short-term borrowings | 142 | 199 | 199 | 180 | 180 | 190 | 199 | 183 | 183 | 188 | ||||
| Non-current liabilities | 41 | 41 | 41 | 41 | 42 | 42 | 42 | 42 | 42 | 42 | 53 | 53 | 53 | 54 |
| Total liabilities | 219 | 248 | 196 | 187 | 357 | 469 | 420 | 385 | 420 | 470 | 522 | 446 | 473 | 444 |
| Total net assets | 3,048 | 3,175 | 2,853 | 2,622 | 2,199 | 2,585 | 3,146 | 3,110 | 3,118 | 2,859 | 2,428 | 1,893 | 1,653 | 1,476 |
| Total shareholders’ equity | 3,048 | 3,175 | 2,853 | 2,622 | 2,199 | 2,585 | 3,146 | 3,110 | 3,118 | 2,859 | 2,428 | 1,857 | 1,621 | 1,445 |
| Capital stock | 5,856 | 6,084 | 6,132 | 6,132 | 6,133 | 846 | 1,303 | 1,388 | 1,471 | 1,471 | 1,472 | 1,515 | 1,642 | 1,695 |
| Legal capital reserve | 5,846 | 6,074 | 6,122 | 6,122 | 6,123 | 2,446 | 2,903 | 2,987 | 3,071 | 3,071 | 3,072 | 3,115 | 3,242 | 3,295 |
| Retained earnings | -8,682 | -9,008 | -9,421 | -9,655 | -10,080 | -736 | -1,088 | -1,294 | -1,455 | -1,703 | -2,136 | -2,773 | -3,262 | -3,544 |
| Subscription rights to shares | 28 | 26 | 20 | 22 | 24 | 30 | 28 | 29 | 30 | 19 | 19 | 35 | 31 | 30 |
| Total liabilities and net assets | 3,267 | 3,423 | 3,049 | 2,808 | 2,556 | 3,054 | 3,566 | 3,495 | 3,537 | 3,329 | 2,950 | 2,339 | 2,126 | 1,920 |
| [Statements of cash flows] | ||||||||||||||
| Cash flow from operating activities | -677 | -1,537 | -528 | -1,361 | -560 | -1,139 | -660 | |||||||
| Loss before income taxes | -755 | -1,401 | -734 | -1,290 | -396 | -1,466 | -768 | |||||||
| Cash flow from investing activities | – | -26 | – | 3 | – | -35 | – | |||||||
| Purchase of investment securities | – | – | – | – | – | – | – | |||||||
| Cash flow from financing activities | 1,248 | 1,341 | 894 | 1,944 | 176 | 271 | 341 | |||||||
| Proceeds from issuance of common shares |
1,249 | 1,345 | 697 | 1,769 | 166 | 253 | 336 | |||||||
| Net increase in cash and cash equiv. | 570 | -222 | 366 | 580 | -384 | -895 | -319 | |||||||
| Cash and cash equiv. at beginning of period |
2,328 | 2,328 | 2,105 | 2,105 | 2,686 | 2,686 | 1,790 | |||||||
| Cash and cash equiv. at end of period | 2,899 | 2,105 | 2,472 | 2,686 | 2,301 | 1,790 | 1,471 | |||||||
Note) For the cash flow statement, Q2 is the cumulative of Q1 to Q2, and Q4 is the cumulative of Q1 to Q4. Therefore, the beginning balance will be the beginning balance of Q1 for both Q2 and Q4.
Source: Omega Investment from Company materials.