2026-07-15
Home
Japanese

Omega Investment Co., Ltd.
Digital Hearts Holdings (Company Note Q1 update)

| Share price (9/2) | ¥1,818 | Dividend Yield (22/3 CE) | 1.15 % |
| 52weeks high/low | ¥2,700 / 1,405 | ROE(TTM) | 26.38 % |
| Avg Vol (3 month) | 91.8 thou shrs | Operating margin (TTM) | 8.60 % |
| Market Cap | ¥43.4 bn | Beta (5Y Monthly) | 1.14 |
| Enterprise Value | ¥41.1 bn | Shares Outstanding | 23.890 mn shrs |
| PER (23/3 CE) | 17.5 X | Listed market | TSE Prime section |
| PBR (22/3 act) | 5.23 X |
| Click here for the PDF version of this page |
| PDF Version |
Enterprise Business continues to drive growth
Record high Q1 sales and operating profit
◊Good earnings results and sustained growth investment
Enterprise Business continues to drive high sales growth (+77% yoy) backed by the growing existing businesses and the benefits of M&A. Entertainment Business also achieved double-digit sales growth (+18%) against the backdrop of a strong games market. All in all, the company achieved its highest ever Q1 sales and operating profit. EBITDA grew by 20%. Meanwhile, it continues to invest in the growth of Enterprise Business, with three M&As and other deals being executed from the end of FY2022/3 onwards. With the company further bolstering its new management structure, various measures for growth are underway, including a resolution for equity finance.
◊Share price: recovering and further scope for upside
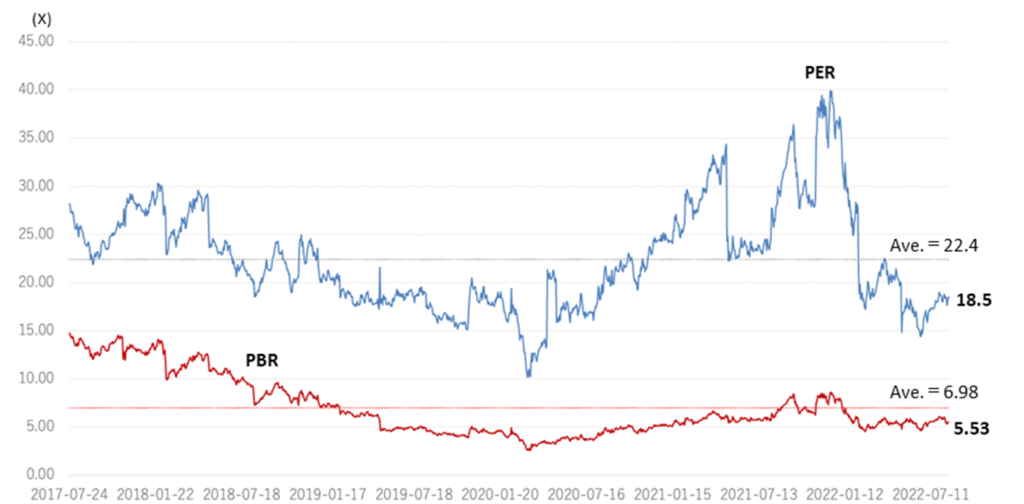
The company’s share price rose sharply on the back of strong results in the previous year and the management’s forecast for a large dividend increase in FY2023/3. There was a swing back for some time afterwards, but the share price has returned to an uptrend. Considering the current good business performance and future growth expectations, the share price looks undervalued in terms of PER and PBR.
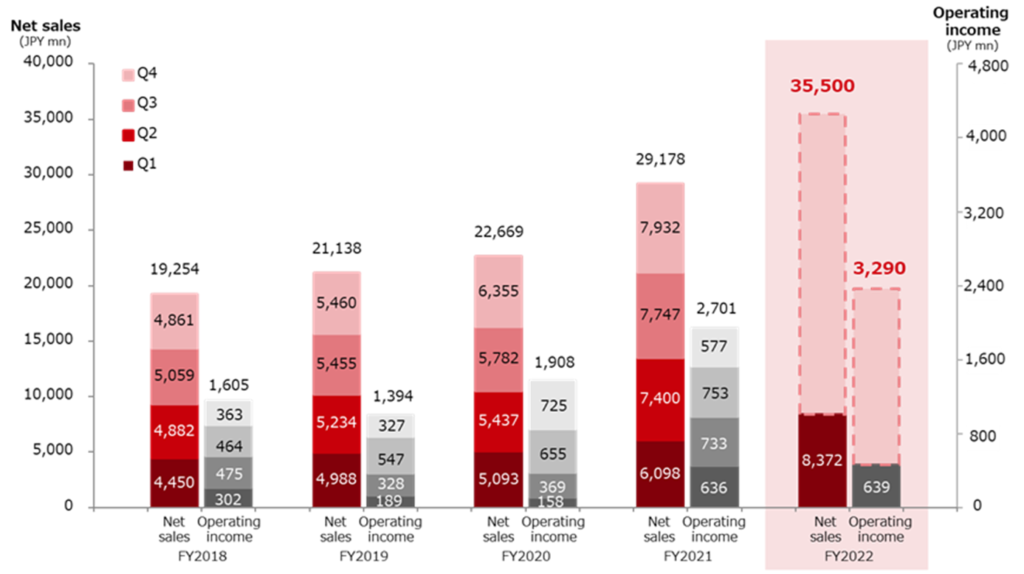
◊Financial results for Q1 FY2023/3: Record high sales and operating profit for Q1
DIGITAL HEARTS HOLDINGS achieved a significant increase in sales and operating profit in Q1 FY2023/3, thanks to the growth in existing businesses and the effect of M&A. The company’s sales and operating profit recorded a historic high 8,372 million yen (up 37.3% yoy) and 639 million yen (up 0.5% yoy), respectively, despite the amortisation of goodwill on M&As and the growth investment in Enterprise Business. EBITDA grew significantly to 893 million yen, up 21.9%.
Enterprise Business saw sales increase by 77% yoy due to the effects of M&As in the previous year, in addition to continued double-digit top-line sales growth in existing businesses. EBITDA grew by 25.8%, despite the continued investment in growth. Meanwhile, in Entertainment Business, Domestic debugging for console games performed well. Also, Global and others registered a 30% increase in sales. Consequently, the quarterly segment profit exceeded 1 billion yen for the first time.
◊Full-year progress in FY2023/3: On target to achieve record high sales and operating profit
As of Q1, progress rations vis-a-vis the company’s full-year forecasts are 24% for sales, 19% for operating profit and 21% for EBITDA. These targets look achievable, with the earnings of the acquired companies into the group through M&As expected to kick in from Q2.
◊Steady implementation of various measures for growth
The company clarified the roles of Enterprise and Entertainment operating companies with the launch of AGEST, Inc. in April 2022. The structure of the holding company overseeing the operating companies has been strengthened and DIGITAL HEARTS HOLDINGS is now ready to drive medium-term growth from a organisational perspective. In June, the company announced a resolution for equity financing (stock subscription rights) for an expected 4.2 billion yen to secure funds for M&As.
| JPY, mn, % | Net sales |
YoY % |
Oper. profit |
YoY % |
Ord. profit |
YoY % |
Profit ATOP |
YoY % |
EPS (¥) |
DPS (¥) |
| 2019/3 | 19,254 | 11.0 | 1,605 | -7.5 | 1,651 | -7.4 | 1,575 | 31.3 | 72.13 | 13.00 |
| 2020/3 | 21,138 | 9.8 | 1,394 | -13.2 | 1,372 | -16.9 | 792 | -49.7 | 36.31 | 14.00 |
| 2021/3 | 22,669 | 7.2 | 1,908 | 36.9 | 1,975 | 43.9 | 974 | 23.0 | 45.15 | 14.00 |
| 2022/3 | 29,178 | 28.7 | 2,701 | 41.5 | 2,778 | 40.7 | 1,780 | 82.7 | 82.35 | 15.00 |
| 2023/3 (CE) | 35,500 | 21.7 | 3,290 | 21.8 | 3,290 | 18.4 | 2,250 | 26.4 | 104.04 | 21.00 |
| 2022/3 Q1 | 6,098 | 19.7 | 636 | 301.3 | 670 | 244.9 | 487 | 391.3 | 22.57 | – |
| 2023/3 Q1 | 8,372 | 37.3 | 639 | 0.5 | 637 | -4.8 | 416 | -14.7 | 19.24 | – |
Full year consolidated sales / operating profit trend
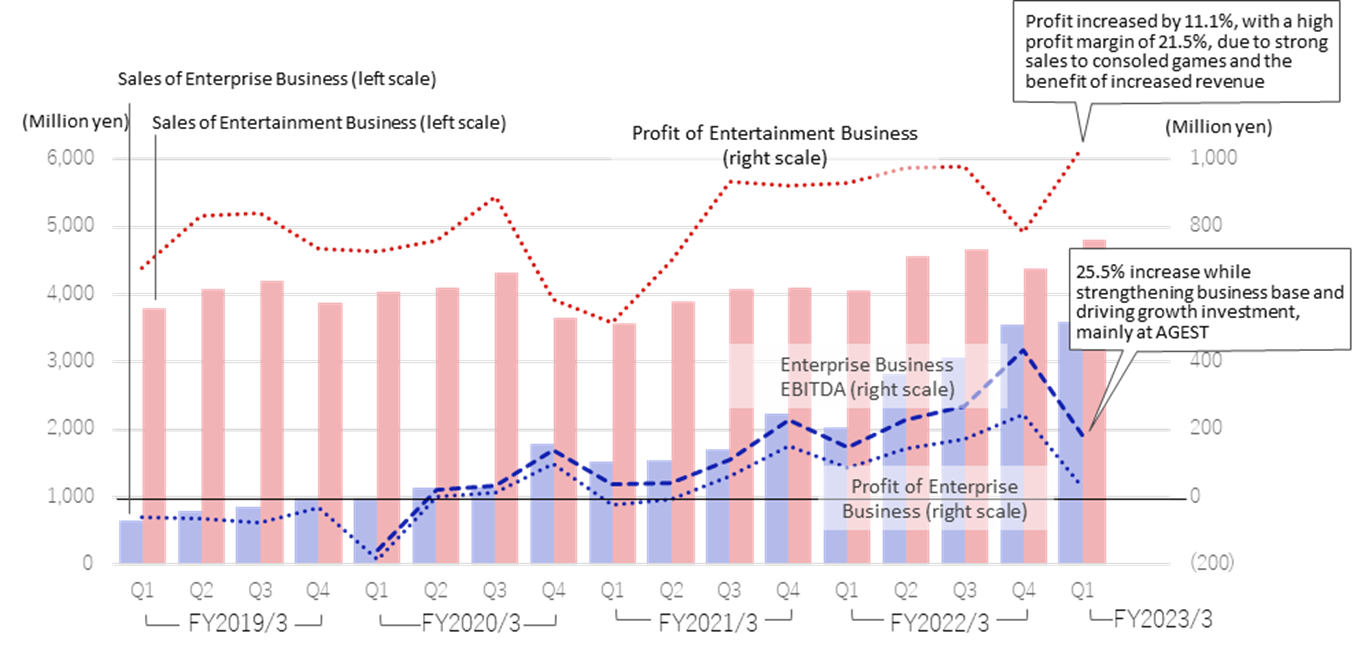
◊ Trends by segment:
1) Enterprise Business: 76.8% yoy increase in sales (3,589 million yen), 25.8% rise in EBITDA
Existing businesses continue to record double-digit revenue growth on the back of increased demand from DX developments and growing test outsourcing needs. The recent M&A effect has also contributed, and the sales of Enterprise Business grew by about 80% yoy. Consequently, gross profit has increased steadily with the margin remaining above 25%. Although SG&A expenses are rising reflecting pro-active investment to reinforce the business infrastructure and growth, EBITDA increased significantly to 185 million yen, or +25.8% yoy. Segment profit decreased (29 million yen, -66.2% yoy) due to continued investment for growth.
As already announced, the sub-segments were reshuffled from this Q1. They are “QA solutions” and “IT Services and others” as shown below.
QA solution: sales: 2,102 million yen (+50.7%). Leveraging the company’s unique characteristics, cross-selling has been strengthened in areas such as security testing and test automation, based on manual software testing. The company focused on increasing the number of new customers and the scale of transactions per client and achieved a 16.2% increase in revenue on an existing business basis. ERP-related sales also increased, with CEGB, which was acquired through M&A in March 2022, contributing from Q1. The gross profit margin of QA solution remained above 30%, despite continued investment for business expansion. In Q1, there were 627 customers with orders received and the average sales per client was 10 million yen (on a LTM basis, excluding subsidiaries that have been consolidated for less than 12 months).
IT services and others: sales: 1,486 million yen (+134.3%). Sales increased 2.4 times yoy due to the inclusion of identity Inc. (SES: temporary engineer staffing), which became a subsidiary in June 2021. Sales net of M&A impact rose 11.6%. Demand for security monitoring is steadily increasing against the backdrop of the expanding remote working and so on. The number of security monitoring units is held in excess of 550,000.
2) Entertainment Business: 18.4% increase in revenue (4,818 million yen), segment profit rose 11.4%
Increasing demand is steadily being captured against the backdrop of the buoyant domestic console games market and the accelerating overseas development of content. Both Domestic debugging, Global and others sales increased by double-digits. Segment profit increased by 11.4% due to higher Domestic debugging sales and improved gross margins, generating the highest segment profit ever in Q1. The segment profit margin remained high at 21.5%.
Domestic debugging: sales: 3,334 million yen (+13.7%). The development of new titles in the console game market has become more active. Sales in this field were strong, driving growth in the Domestic debugging business. Meanwhile, the gross margin remained high at 32.8%, up 1.5 percentage points yoy, thanks to the ongoing efforts to improve operational efficiency and the sales rise.
Global and others: sales: 1,484 million yen (+30.4%). Cross-border/global projects were steadily won against the backdrop of a buoyant market environment. All Global, Creative, Media and others services achieved double-digit revenue growth. Going forward, in addition to pursuing synergies with the DIGITAL HEARTS CROSS Group, the company plans to expand its business in Asia and create new value by strengthening initiatives with alliance partners, including GameWith, with which it has newly formed a capital and business alliance.
Sales/Profit by Segment
◊ Result progress vs FY2023/3 targets: Running on target. The company aims at record high sales and operating profit
As of Q1, progress rations against the full-year forecast were 23.6% of net sales, 19.5% of operating profit, 21.1% of EBITDA and 18.5% of net profit attributable to shareholders of the parent company. Sales are expected to be firm vis-a-vis the company forecast, considering the outlook of steady growth in Q2 and beyond, mainly in Enterprise Business, and the benefits of M&As during the current fiscal year. Profit-wise, the company should also meet its targets, as sales will increase while growth investment will be restrained HoH in the 2H.
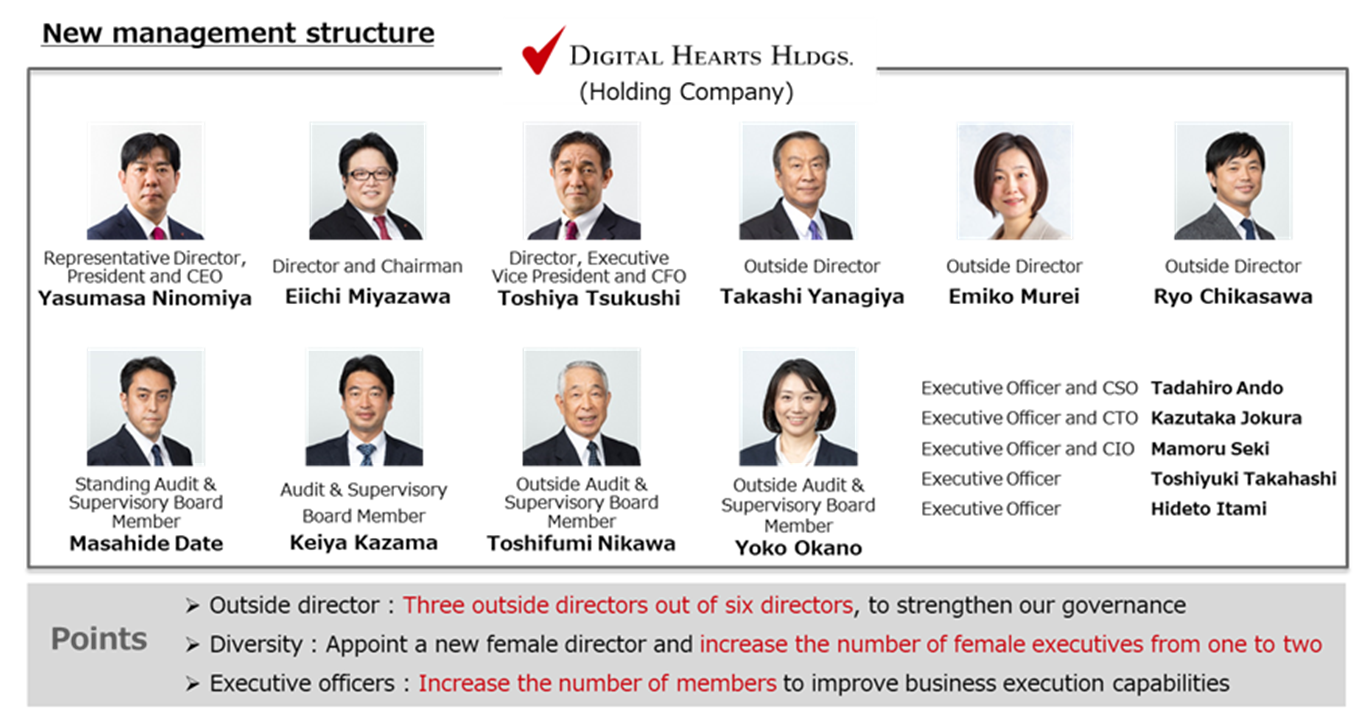
◊ New management structure: Establishing a group structure to ensure growth from an organisational perspective as well
The establishment of AGEST in April 2022 clarified the group structure, with AGEST as the Enterprise Business company, DIGITAL HEARTS as the Entertainment Business and DIGITAL HEARTS HOLDING as the holding company that oversees these businesses. Furthermore, the number of outside directors and executive officers has been increased at the holding company. The company is now ready to drive medium-term growth from a organisational perspective, aiming to strengthen its governance structure and improve its business execution capabilities.
◊ Resolved on equity finance for M&A and other purposes
On 30 June, the company announced equity finance through the issue of stock subscription rights with a revised exercise price (allotment date: 19 July 2022). The estimated amount raised is 4.24 billion yen (approximate net proceeds assuming all subscription rights are exercised at the initial exercise price). The maximum dilution to existing shareholders would be 11.0% if all subscription rights were exercised, but the financing is intended to enable the company to make the investments necessary to realise its medium-term management vision. Therefore, investors should expect a return in the form of capital gains.
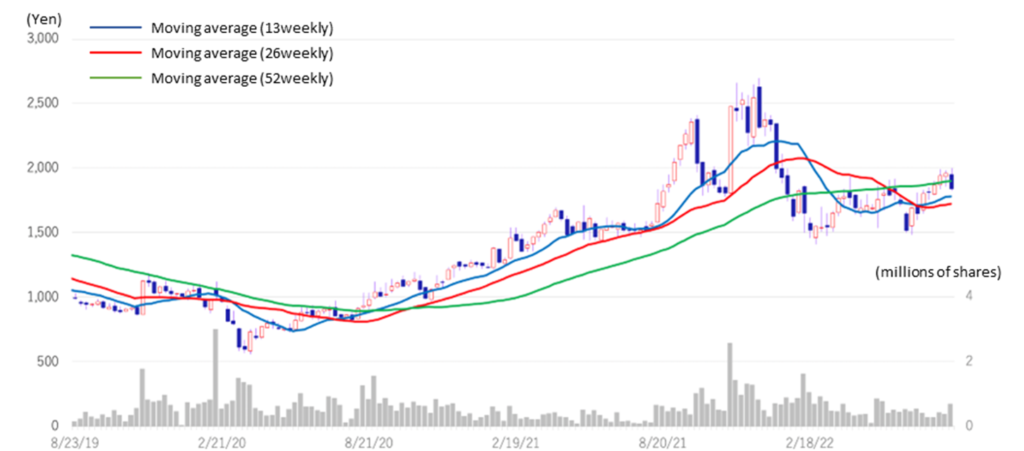
◊ Share price: On a recovery trend, but room for further upside
The company’s share price rose sharply on the back of strong results in the previous year and the management’s forecast for a large dividend increase in FY2023/3. There was a swing back for some time afterwards, but the share price has returned to an uptrend. As we have seen, the business environment surrounding the company is extremely favourable. In addition, the company has settled down the group reorganisation and the finance necessary for growth, so there is little to be concerned about in the immediate future.
On the other hand, the valuations of the company’s shares are running below their historical averages. Considering the company’s current strong business performance and future growth expectations, the shares look undervalued in terms of PER and PBR.
Digital Hearts Holdings (3676) Share Price Trend (3Year-to-date)
Historical PER/PBR (five years)
Financial data I
2020/3 |
2021/3 |
2022/3 |
2023/3 |
||||||||||
Q1 |
Q2 |
Q3 |
Q4 |
Q1 |
Q2 |
Q3 |
Q4 |
Q1 |
Q2 |
Q3 |
Q4 |
Q1 |
|
[Sales by segment] |
|||||||||||||
Net sales |
4,988 |
5,234 |
5,455 |
5,460 |
5,093 |
5,437 |
5,782 |
6,355 |
6,098 |
7,400 |
7,747 |
7,932 |
8,372 |
YoY |
12.1% |
7.2% |
7.8% |
15.0% |
2.1% |
3.9% |
6.0% |
16.4% |
19.7% |
36.1% |
34.0% |
24.8% |
37.3% |
Enterprise business |
954 |
1,140 |
1,133 |
1,794 |
1,523 |
1,540 |
1,710 |
2,246 |
2,029 |
2,833 |
3,074 |
3,553 |
3,589 |
YoY |
46.3% |
41.5% |
32.0% |
82.5% |
59.6% |
35.1% |
50.9% |
25.2% |
33.2% |
83.9% |
79.7% |
58.2% |
76.8% |
Composition of sales |
19.1% |
21.8% |
20.8% |
32.9% |
29.9% |
28.3% |
29.6% |
35.3% |
33.3% |
38.3% |
39.7% |
44.8% |
42.9% |
New sub-segments |
|||||||||||||
QA solutions |
1,395 |
– |
– |
– |
2,102 |
||||||||
YoY |
– |
– |
– |
– |
50.7% |
||||||||
Composition of sales |
22.9% |
– |
– |
– |
25.1% |
||||||||
IT services and others |
634 |
– |
– |
– |
1,486 |
||||||||
YoY |
– |
– |
– |
– |
134.3% |
||||||||
Composition of sales |
10.4% |
– |
– |
– |
17.7% |
||||||||
Old sub-segments |
|||||||||||||
System testing |
430 |
570 |
488 |
924 |
788 |
777 |
937 |
1,078 |
1,018 |
1,144 |
1,233 |
1,558 |
– |
YoY |
65.8% |
99.5% |
33.5% |
91.4% |
83.1% |
36.2% |
92.0% |
16.7% |
29.2% |
47.2% |
31.5% |
44.5% |
– |
Composition of sales |
8.6% |
10.9% |
8.9% |
16.9% |
15.5% |
14.3% |
16.2% |
17.0% |
16.7% |
15.5% |
15.9% |
19.6% |
– |
IT services / Security |
523 |
569 |
645 |
869 |
735 |
763 |
772 |
1,167 |
1,011 |
1,688 |
1,841 |
1,995 |
– |
YoY |
33.4% |
9.5% |
30.9% |
73.9% |
40.4% |
34.1% |
19.8% |
34.3% |
37.5% |
121.2% |
138.2% |
70.9% |
– |
Composition of sales |
10.5% |
10.9% |
11.8% |
15.9% |
14.4% |
14.0% |
13.4% |
18.4% |
16.6% |
22.8% |
23.8% |
25.2% |
– |
Entertainment business |
4,033 |
4,093 |
4,321 |
3,666 |
3,566 |
3,900 |
4,072 |
4,109 |
4,069 |
4,566 |
4,672 |
4,378 |
4,818 |
YoY |
6.2% |
0.5% |
2.9% |
-5.4% |
-11.6% |
-4.7% |
-5.8% |
12.1% |
14.0% |
17.1% |
14.7% |
6.6% |
18.4% |
Composition of sales |
80.9% |
78.2% |
79.2% |
67.1% |
70.0% |
71.7% |
70.4% |
64.7% |
66.7% |
61.7% |
60.3% |
55.2% |
57.5% |
New sub-segments |
|||||||||||||
Domestic debugging |
2,681 |
2,846 |
2,953 |
3,054 |
2,931 |
3,030 |
3,149 |
3,011 |
3,334 |
||||
YoY |
– |
– |
– |
– |
9.3% |
6.4% |
6.7% |
-1.4% |
13.7% |
||||
Composition of sales |
52.7% |
52.4% |
51.1% |
48.1% |
48.1% |
41.0% |
40.7% |
38.0% |
39.8% |
||||
Global and others |
887 |
1,049 |
1,118 |
1,054 |
1,137 |
1,536 |
1,522 |
1,366 |
1,484 |
||||
YoY |
– |
– |
– |
– |
28.2% |
46.3% |
36.1% |
29.6% |
30.4% |
||||
Composition of sales |
17.4% |
19.3% |
19.3% |
16.6% |
18.7% |
20.8% |
19.7% |
17.2% |
17.7% |
||||
Old sub-segments |
|||||||||||||
Debugging |
3,444 |
3,480 |
3,730 |
3,167 |
3,023 |
3,235 |
3,375 |
3,424 |
– |
– |
– |
– |
– |
YoY |
10.8% |
6.0% |
6.8% |
-1.5% |
-12.2% |
-7.0% |
-9.5% |
8.1% |
– |
– |
– |
– |
– |
Composition of sales |
69.1% |
66.5% |
68.4% |
58.0% |
59.4% |
59.5% |
58.4% |
53.9% |
– |
– |
– |
– |
– |
Game Consoles |
1,186 |
1,056 |
1,341 |
1,126 |
1,023 |
1,147 |
1,258 |
1,402 |
– |
– |
– |
– |
– |
YoY |
21.1% |
5.4% |
15.9% |
10.7% |
-13.7% |
8.6% |
-6.2% |
24.5% |
– |
– |
– |
– |
– |
Composition of sales |
23.8% |
20.2% |
24.6% |
20.6% |
20.1% |
21.1% |
21.8% |
22.1% |
– |
– |
– |
– |
– |
Mobile solutions |
2,013 |
2,171 |
2,141 |
1,848 |
1,819 |
1,959 |
2,005 |
1,870 |
– |
– |
– |
– |
– |
YoY |
1.0% |
1.7% |
2.0% |
-4.9% |
-9.6% |
-9.8% |
-6.4% |
1.2% |
– |
– |
– |
– |
– |
Composition of sales |
40.4% |
41.5% |
39.2% |
33.8% |
35.7% |
36.0% |
34.7% |
29.4% |
– |
– |
– |
– |
– |
Amusement |
245 |
253 |
248 |
193 |
179 |
130 |
111 |
153 |
– |
– |
– |
– |
– |
YoY |
77.5% |
75.7% |
4.6% |
-24.3% |
-26.9% |
-48.6% |
-55.2% |
-20.7% |
– |
– |
– |
– |
– |
Composition of sales |
4.9% |
4.8% |
4.5% |
3.5% |
3.5% |
2.4% |
1.9% |
2.4% |
– |
– |
– |
– |
– |
Creative |
350 |
307 |
282 |
285 |
311 |
367 |
372 |
398 |
– |
– |
– |
– |
– |
YoY |
-31.4% |
-45.2% |
-33.1% |
-27.6% |
-11.2% |
19.6% |
32.0% |
39.2% |
– |
– |
– |
– |
– |
Composition of sales |
7.0% |
5.9% |
5.2% |
5.2% |
6.1% |
6.8% |
6.4% |
6.3% |
– |
– |
– |
– |
– |
Media and others |
238 |
306 |
308 |
212 |
234 |
294 |
324 |
286 |
– |
– |
– |
– |
– |
YoY |
35.5% |
32.6% |
8.7% |
-19.4% |
-1.5% |
-3.9% |
5.0% |
34.5% |
– |
– |
– |
– |
– |
Composition of sales |
4.8% |
5.9% |
5.7% |
3.9% |
4.6% |
5.4% |
5.6% |
4.5% |
– |
– |
– |
– |
– |
Operating profit |
189 |
328 |
547 |
327 |
158 |
369 |
655 |
725 |
636 |
733 |
753 |
577 |
639 |
YoY |
-37.2% |
-30.9% |
18.0% |
-9.9% |
-16.4% |
12.4% |
19.7% |
121.3% |
301.3% |
98.5% |
14.9% |
-20.4% |
0.5% |
Operating profit margin |
3.8% |
6.3% |
10.0% |
6.0% |
3.1% |
6.8% |
11.3% |
11.4% |
10.4% |
9.9% |
9.7% |
7.3% |
7.6% |
Enterprise business |
-184 |
2 |
14 |
100 |
-21 |
-7 |
64 |
152 |
87 |
144 |
171 |
246 |
29 |
YoY |
– |
– |
– |
– |
– |
– |
363.5% |
52.4% |
– |
– |
163.8% |
61.9% |
33.8% |
Segment profit margin |
-19.4% |
0.3% |
1.2% |
5.6% |
-1.4% |
-0.5% |
3.8% |
6.8% |
4.3% |
5.1% |
5.6% |
6.9% |
0.8% |
Entertainment business |
727 |
760 |
891 |
585 |
517 |
700 |
936 |
923 |
930 |
975 |
978 |
783 |
1,036 |
YoY |
7.3% |
-8.8% |
6.1% |
-20.3% |
-28.9% |
-8.0% |
5.0% |
57.9% |
79.9% |
39.3% |
4.5% |
-15.2% |
11.4% |
Segment profit margin |
18.0% |
18.6% |
20.6% |
16.0% |
14.5% |
18.0% |
23.0% |
22.5% |
22.9% |
21.4% |
20.9% |
17.9% |
21.5% |
Note) Total segment sales and operating profit may not match the total because of adjustments in both sales and operating profit.
Source: Omega Investment, based on company data
Financial data II
2020/3 |
2021/3 |
2022/3 |
2023/3 |
||||||||||
Q1 |
Q2 |
Q3 |
Q4 |
Q1 |
Q2 |
Q3 |
Q4 |
Q1 |
Q2 |
Q3 |
Q4 |
Q1 |
|
[Statements of income] |
|||||||||||||
Net sales |
4,988 |
5,234 |
5,455 |
5,460 |
5,093 |
5,437 |
5,782 |
6,355 |
6,098 |
7,400 |
7,747 |
7,932 |
8,372 |
Cost of sales |
3,772 |
3,830 |
3,949 |
3,953 |
3,819 |
4,002 |
4,001 |
4,700 |
4,271 |
5,290 |
5,579 |
5,645 |
5,899 |
Gross profit |
1,216 |
1,403 |
1,506 |
1,507 |
1,273 |
1,437 |
1,781 |
1,655 |
1,827 |
2,109 |
2,167 |
2,287 |
2,472 |
SG&A expenses |
1.026 |
1,074 |
958 |
959 |
1,115 |
1,067 |
1,126 |
1,150 |
1,191 |
1,375 |
1,414 |
1,709 |
1,832 |
Operating profit |
189 |
328 |
547 |
327 |
158 |
369 |
655 |
725 |
636 |
733 |
753 |
577 |
639 |
Non-operating income |
3 |
2 |
1 |
1 |
38 |
10 |
24 |
5 |
38 |
31 |
12 |
30 |
5 |
Non-operating expenses |
3 |
7 |
7 |
7 |
2 |
3 |
4 |
10 |
4 |
4 |
5 |
21 |
7 |
Ordinary profit |
189 |
323 |
542 |
542 |
194 |
376 |
675 |
720 |
670 |
760 |
759 |
587 |
637 |
Extraordinary income |
0 |
0 |
0 |
19 |
32 |
|
13 |
66 |
1 |
1 |
– |
||
Extraordinary expenses |
0 |
0 |
75 |
82 |
13 |
16 |
415 |
2 |
42 |
32 |
35 |
– |
|
Net profit before income taxes |
189 |
323 |
542 |
240 |
113 |
381 |
691 |
318 |
681 |
785 |
730 |
552 |
637 |
Total income taxes |
77 |
159 |
162 |
99 |
38 |
122 |
224 |
145 |
189 |
281 |
233 |
38 |
201 |
Net profit attributable to
|
112 |
165 |
375 |
139 |
99 |
256 |
438 |
180 |
487 |
429 |
445 |
417 |
416 |
[Balance Sheets] |
|||||||||||||
Current assets |
6,717 |
7,574 |
7,710 |
7,453 |
6,648 |
7,291 |
8,017 |
9,744 |
9,604 |
9,848 |
10,658 |
10,392 |
10,874 |
Cash and deposits |
3,650 |
3,849 |
3,882 |
3,739 |
3,027 |
3,482 |
4,085 |
5,076 |
4,911 |
5,435 |
5,746 |
5,208 |
5,573 |
Notes and accounts receivable |
2,677 |
3,017 |
3,013 |
2,985 |
2,889 |
3,099 |
3,201 |
4,097 |
|||||
Notes, accounts receivable andcontract assets |
4,161 |
3,872 |
4,372 |
4,411 |
4,614 |
||||||||
Non-current assets |
2,481 |
3,252 |
3,227 |
3,184 |
3,205 |
3,167 |
3,160 |
4,593 |
6,321 |
6,178 |
6,342 |
7,172 |
8,158 |
Tangible fixed assets |
545 |
646 |
627 |
579 |
560 |
549 |
565 |
598 |
602 |
623 |
621 |
693 |
1,067 |
Intangible fixed assets |
793 |
1,404 |
1,390 |
1,379 |
1,445 |
1,424 |
1,433 |
2,670 |
4,389 |
4,244 |
4,225 |
5,094 |
5,206 |
Goodwill |
491 |
1,066 |
1,033 |
1,027 |
1,032 |
991 |
950 |
2,467 |
4,175 |
4,042 |
3,945 |
4,763 |
4,812 |
Investments and other assets |
1,142 |
1,202 |
1,209 |
1,225 |
1,199 |
1,193 |
1,161 |
1,324 |
1,330 |
1,309 |
1,495 |
1,384 |
1,883 |
Total assets |
9,199 |
10,827 |
10,938 |
10,637 |
9,854 |
10,459 |
11,177 |
14,338 |
15,925 |
16,026 |
17,001 |
17,565 |
19,033 |
Current liabilities |
3,621 |
4,679 |
4,863 |
5,135 |
4,450 |
4,655 |
5,061 |
7,904 |
8,954 |
8,775 |
9,354 |
9,679 |
10,759 |
Short-term borrowings |
1,704 |
2,504 |
2,506 |
2,546 |
2,546 |
2,551 |
2,552 |
4,728 |
5,534 |
5,406 |
5,406 |
5,421 |
6,806 |
Non-current liabilities |
622 |
624 |
629 |
63 |
62 |
132 |
135 |
119 |
294 |
55 |
58 |
309 |
162 |
Long-term debt |
48 |
46 |
48 |
– |
– |
66 |
65 |
63 |
236 |
– |
– |
169 |
– |
Total liabilities |
4,243 |
5,304 |
5,493 |
5,198 |
4,513 |
4,788 |
5,196 |
8,024 |
9,249 |
8,830 |
9,413 |
9,989 |
10,921 |
Total net assets |
4,955 |
5,523 |
5,445 |
5,438 |
5,340 |
5,670 |
5,980 |
6,314 |
6,677 |
7,196 |
7,588 |
7,576 |
8,111 |
Shareholders’ equity |
4,734 |
5,039 |
4,919 |
4,898 |
4,841 |
5,172 |
5,460 |
5,642 |
5,983 |
6,436 |
6,719 |
6,776 |
7,030 |
Capital |
300 |
300 |
300 |
300 |
300 |
300 |
300 |
300 |
300 |
300 |
300 |
300 |
300 |
Legal capital reserve |
366 |
357 |
357 |
355 |
355 |
331 |
331 |
331 |
331 |
338 |
338 |
– |
– |
Retained earnings |
6,378 |
6,543 |
6,765 |
6,904 |
6,848 |
7,105 |
7,393 |
7,575 |
7,916 |
8,342 |
8,626 |
9,021 |
9,275 |
Treasury shares |
-2,311 |
-2,162 |
-2,503 |
-2,662 |
-2,662 |
-2,565 |
-2,565 |
-2,565 |
-2,565 |
-2,545 |
-2,546 |
-2,545 |
-2,545 |
Stock acquisition right |
13 |
13 |
13 |
13 |
13 |
13 |
13 |
13 |
– |
– |
– |
– |
– |
Total liabilities and net assets |
9,199 |
10,827 |
10,938 |
10,637 |
9,854 |
10,459 |
11,177 |
14,338 |
15,925 |
16,026 |
17,001 |
17,565 |
19,033 |
[Statements of cash flows] |
|||||||||||||
Cash flow from operating
|
-5 |
1,086 |
101 |
1,416 |
1,703 |
3,077 |
|||||||
Net profit before tax and otheradjustments |
513 |
1,296 |
494 |
1,504 |
1,466 |
2,749 |
|||||||
Cash flow from investing
|
-963 |
1,018 |
-261 |
-1,813 |
-1,682 |
-2,537 |
|||||||
Cash flow from financing
|
|
637 |
|
-515 |
|
-90 |
|
1,730 |
|
316 |
-546 |
||
Free cash flow |
958 |
68 |
362 |
3,229 |
3,385 |
5,614 |
|||||||
Cash and cash equivalents
|
-347 |
-458 |
-252 |
1,341 |
359 |
132 |
|||||||
Cash and cash equivalents
|
4,162 |
4,162 |
3,704 |
3,704 |
5,041 |
5.041 |
|||||||
Cash and cash equivalents
|
3,814 |
3,704 |
3,447 |
5,041 |
5,400 |
5,173 |
Source: Omega Investment, based on company data.