2026-07-15
Home
Japanese

Omega Investment Co., Ltd.
Sansei Landic (Company Note 2Q update)
| Share price (9/26) | ¥815 | Dividend Yield (22/12 CE) | 3.31 % |
| 52weeks high/low | ¥921/778 | ROE(TTM) | 8.85 % |
| Avg Vol (3 month) | 18.5 thou shrs | Operating margin (22/6) | 5.79 % |
| Market Cap | ¥6.91 bn | Beta (5Y Monthly) | 0.72 |
| Enterprise Value | ¥8.78 bn | Shares Outstanding | 8.483 mn shrs |
| PER (22/12 CE) | 6.34 X | Listed market | TSE Standard |
| PBR (21/12 act) | 0.62 X |
| Click here for the PDF version of this page |
| PDF Version |
The earnings exceed the company’s forecasts, which had previously been revised upwards.
The number of projects recovered to above the pre-pandemic levels.
◇The impact of the pandemic disease has been largely overcome, and the earnings came in ahead of the company forecasts.
In 2Q FY12/2022 results, sales were slightly short of the plan due to some sales of old unutilised properties being shifted to 3Q. On the other hand, profits were even higher than the upward revision announced at the time of the 1Q results announcement due to higher-than-planned sales of leasehold land and cost reductions. The number of projects and purchase contracts has increased significantly and is recovering to the pre-pandemic levels. As of 2Q, the progress ratios against the company’s full-year forecast is 48% for sales and 65% for operating profit, and the company may well revise up eventually. The company’s share price was above 900 yen after the announcement of 1Q results but has recently been in the low 800s, and its P/B ratio of 0.64x remains undervalued compared with historical averages.
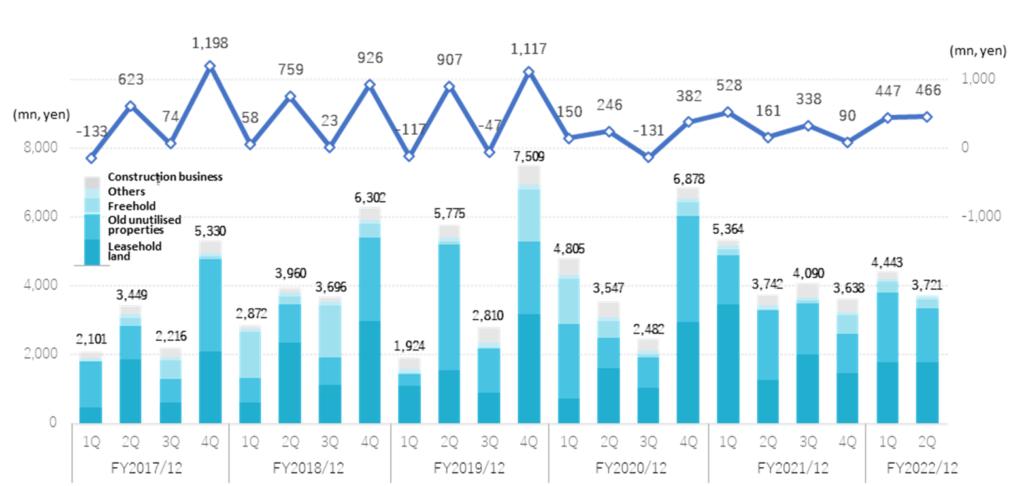
◇Trends in 2Q results for FY2022/12: Operating profit above forecast, up 33% yoy.
In the 2Q results for FY2022/12, sales fell 10.4% yoy to 8.165 billion yen, underachieving the company plan by 124 million yen. This is because the company postponed some sales of old unutilised properties to the 3Q. Profits exceeded forecasts thanks to higher-than-planned sales of leasehold land and the benefit of cost reductions. Operating profit increased by 32.5% to 913 million yen yoy.
On a 2Q non-consolidated basis, sales were 3,721 million, down 0.6%, and operating profit was 466 million, up 190.0%. The operating profit margin was 12.5%, a 2.5 pt improvement compared to 1Q.
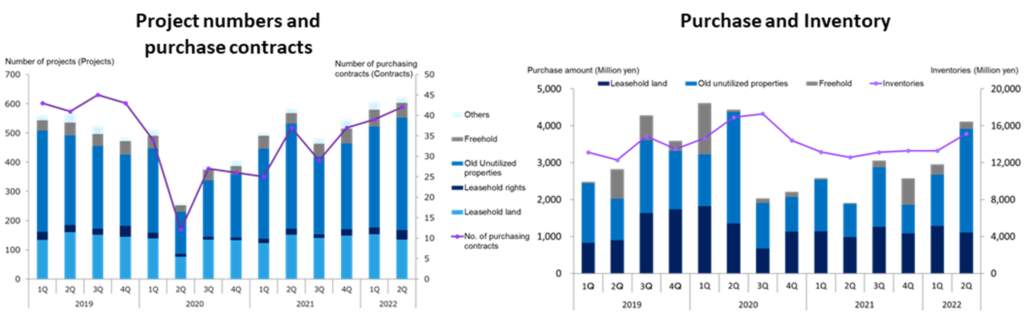
In Real estate sales business, where face-to-face sales are the main operation, the company’s sales activities were severely affected after the spread of COVID-19 at the beginning of 2020. The company has now returned to almost normal operating conditions after implementing many anti-infection countermeasures, including introducing a remote working system. As a result, the number of projects has recovered above the pre-pandemic level. Purchases and inventories have also increased significantly.
On the purchasing side, the volume of information received by the company has increased. In addition, demand is strong, reflecting the robust property market in recent times. On the other hand, there are concerns about the various cost increases, such as demolition costs.
On the sales front, selling prices are on an upward trend, backed by increasing demand for property, and profit margins are improving. With leaseholders’ purchasing sentiment recovering, the company’s operating environment continues to be favourable.
In BS, real estate for sale has increased due to steady progress in purchasing. It increased by 1,851 million yen to 15,152 million yen compared to the end of the previous year. On the other hand, interest-bearing debt decreased by 222 million yen to 7,885 million yen as a result of progress in sales. As total assets increased by 2,628 million yen to 22,678 million yen, the equity ratio fell by 4.3 percentage points to 47.1%.
| JPY, mn | Net sales |
YoY % |
Oper. profit |
YoY % |
Ord. profit |
YoY % |
Profit ATOP |
YoY % |
EPS (¥) |
DPS (¥) |
| 2019/12 | 18,020 | 7.1 | 1,860 | 5.4 | 1,758 | 7.0 | 1,158 | 15.1 | 137.08 | 23.00 |
| 2020/12 | 17,774 | -1.4 | 847 | -54.5 | 709 | -59.7 | 357 | -69.1 | 42.34 | 25.00 |
| 2021/12 | 16,836 | -5.3 | 1,117 | 31.9 | 999 | 40.9 | 609 | 70.5 | 73.56 | 26.00 |
| 2022/12 (CE) | 17,103 | 1.6 | 1,402 | 25.5 | 1,226 | 22.7 | 1,058 | 73.7 | 128.40 | 27.00 |
| 2021/12 2Q | 9,109 | 9.0 | 689 | 74.3 | 631 | 116.4 | 402 | 120.8 | 48.37 | – |
| 2022/12 2Q | 8,165 | -10.4 | 913 | 32.5 | 832 | 31.9 | 713 | 77.2 | 86.67 | – |
Quarterly sales and operating profit
By segment, Real estate sales business recorded sales of 7,943 million yen (-7.7%). Sales of Leasehold land and Freehold were higher than planned, but the overall sales were lower than planned due to changes in the timing of sales of the above-mentioned old unutilised properties. Segment profit increased to 1,540 million yen, up 20.4%. Sales of leasehold land overachieved the plan, and cost reductions exceeded the plan.
Leasehold land: recorded sales of 3,587 million yen (-24.2%). Sales decreased yoy due to higher-than-normal results in the same quarter of the previous year. Sales came in 4.2% above the company plan, with profits also exceeding the forecasts. Sales remained steady, particularly in the metropolitan area.
Old unutilised properties: booked sales of 3,580 million yen (+3.9%). Sales were 7.9% below the company plan due to the postponement of a project to 3Q that was scheduled to be booked in 2Q. Profits were higher yoy thanks to the improved profit margin. The company is better at this business in western Japan, but recent projects in the Tokyo metropolitan area are also increasing.
Freehold: saw sales rise to 581 million yen (+145.1%). Significant yoy growth, partly due to the low level of the same period of last year. Sales were 4.1% ahead of the plan. Profits also overachieved the forecast.
As noted in the previous update note, the company sold all the shares in building subsidiary One’s Life Home at the end of March 2022, and only sales of 222 million yen in 1Q were counted in the 2Q cumulative results. Sales from Construction business will be non-existent from 2Q onwards.
Purchases increased significantly by 57.4% yoy to 7,070 million yen. The breakdown was 2,398 million yen (+12.8%) for Leasehold land, 4,192 million yen (+82.3%) for Old unutilised properties and 479 million yen (+634.5%) for Freehold, running in line with the company’s full-year purchase volume target of 13.4 billion yen. The number of projects has exceeded the pre-pandemic level, and the number of contracts is also upward.
◇ Company forecast for FY12/2022: no change from the numbers released at the time of the 1Q result announcement
As of the end of 2Q, the progress ratios against the full-year forecasts are 48% for sales, 65% for operating profit, 68% for recurring profit and 67% for net profit attributable to owners of the parent company. As mentioned above, the company expects to record the sales of some old unutilised properties in 3Q, which was previously planned to be booked in 2Q, so the company should comfortably achieve its full-year sales targets. Given the current progress, the earnings will likely exceed the company’s forecasts.
The company plans to pay a dividend of 27 yen at the end of FY2022/12, the ninth consecutive year of dividend increases.
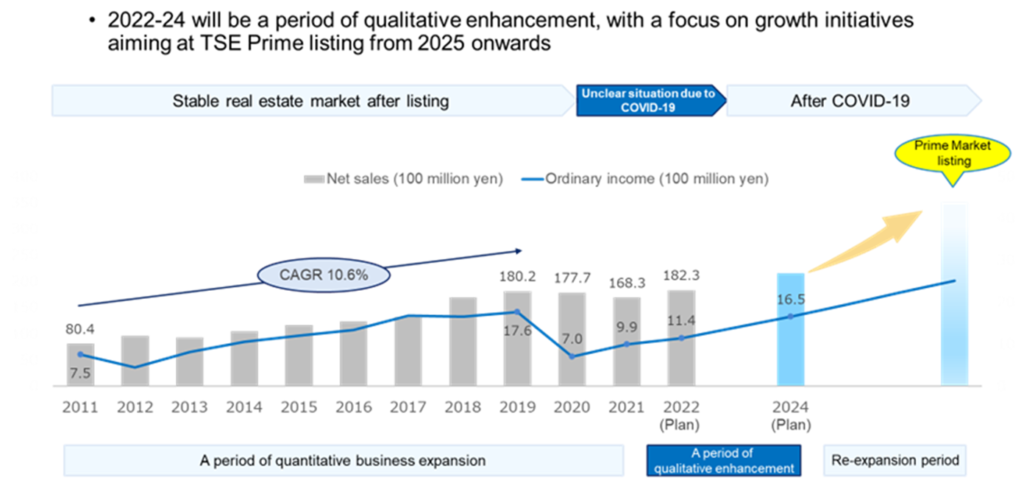
◇ Progress of the medium-term management plan “Transformation to 2024”
In February 2022, the company announced its medium-term management reform plan, “Transformation to 2024”, which clarified that the company, which had been growing at a CAGR of 10.6% in top-line sales until 2019, would restructure its growth story, which had flattened due to COVID-19. The company has identified 2022-24 as a period of qualitative strengthening, with the aim of TSE Prime listing from 2025 onwards. It is actively investing in new businesses and bolstering its financial base. The objective is to achieve new growth.
To expand existing businesses, the company will actively introduce IT. By strengthening the improvement process through IT, the company aims to achieve a more sophisticated procurement and sales strategy, strengthen the company-wide information sharing mechanism, and strengthen individual sales capabilities.
In addition, as part of expanding its business domain, the company is promoting regional redevelopment projects. For example, it has renovated a cottage in Hachimantai, operating accommodation facilities and revitalising the local area. It is expected to take time for the new business to become profitable. Nevertheless, the project is expected to expand and should be a matter of future attention.
Medium-term management plan: positioning
◇ Share price trend
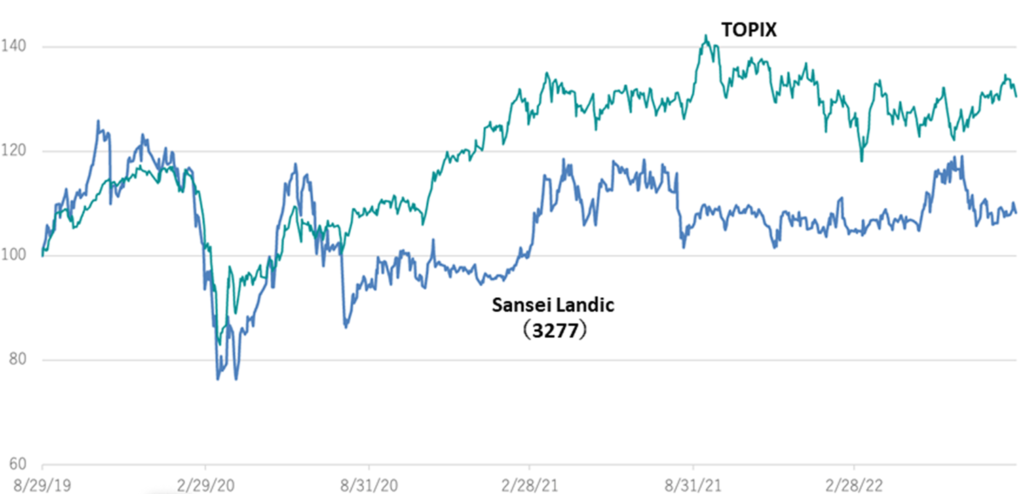
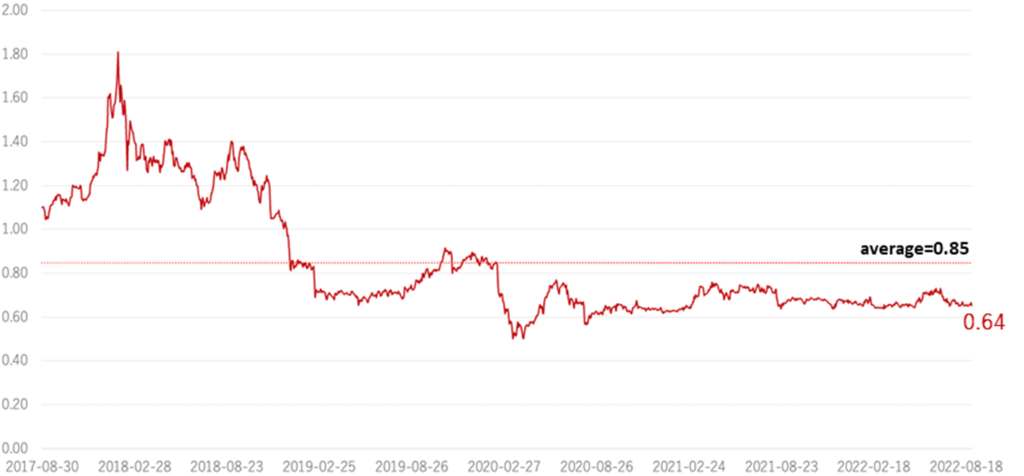
The company’s share price was above 900 yen after the announcement of 1Q results but has recently been in the low 800 yen range. The share price continues to struggle to move up. The shares underperformed TOPIX over the last three years. However, the company has largely recovered from the adverse impact of the pandemic disease, as endorsed by the recent financial results. At the same time, its profit recovery has been remarkable, partly due to the buoyant property market. The company operates on a solid financial base, with over 9 billion yen retained earnings. In light of these, a PBR of 0.64x, which remains below the five-year historical trend of 0.85x, suggests that the shares are undervalued.
(See figure, next page.)
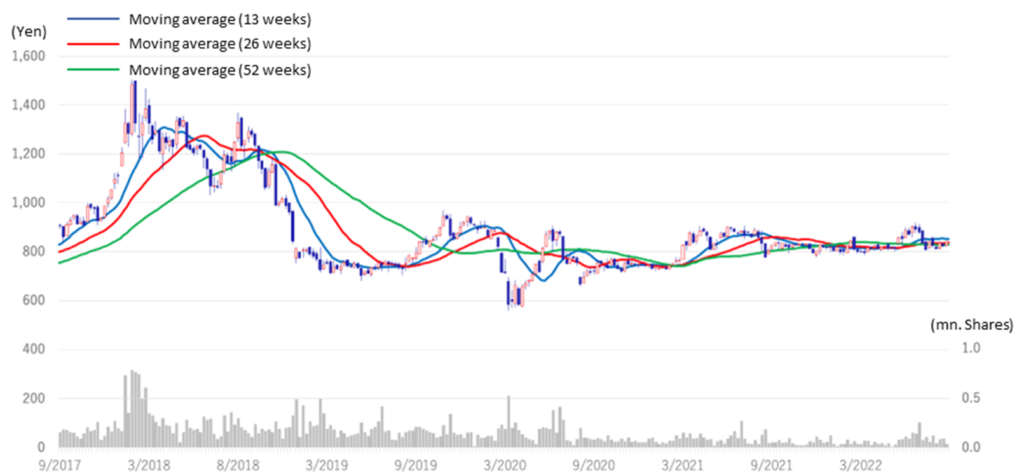
5-year stock price move
Share price compared to TOPIX (last three years)
Historical PBR (last five years)
Financial data
FY (¥mn) |
2019/12 |
2020/12 |
2021/12 |
2022/12 |
||||||||||
1Q |
2Q |
3Q |
4Q |
1Q |
2Q |
3Q |
4Q |
1Q |
2Q |
3Q |
4Q |
1Q |
2Q |
|
[Sales by segment] |
||||||||||||||
Net sales |
1,925 |
5,775 |
2,811 |
7,507 |
4,807 |
3,546 |
2,481 |
6,938 |
5,365 |
3,744 |
4,089 |
3,637 |
4,444 |
3,721 |
Year-on-year basis |
-33.0% |
45.8% |
-23.9% |
15.0% |
149.7% |
-38.6% |
-11.7% |
-7.6% |
11.6% |
5.6% |
64.8% |
-47.6% |
-17.2% |
-0.6% |
Real estate sales business |
1,576 |
5,396 |
2,353 |
6,941 |
4,339 |
3,092 |
2,137 |
6,543 |
5,171 |
3,434 |
3,679 |
3,244 |
4,222 |
3,721 |
Year-on-year basis |
-42.8% |
41.3% |
-33.9% |
17.5% |
175.3% |
-42.7% |
-9.2% |
-5.7% |
19.2% |
11.1% |
72.1% |
-50.4% |
-18.3% |
8.3% |
Sales composition ratio |
81.9% |
93.4% |
83.7% |
92.5% |
90.3% |
87.2% |
86.2% |
94.3% |
96.4% |
91.7% |
90.0% |
89.2% |
95.0% |
100.0% |
Leasehold land |
1,086 |
1,546 |
889 |
3,176 |
719 |
1,613 |
1,044 |
2,950 |
3,464 |
1,267 |
2,003 |
1,474 |
1,793 |
1,794 |
Year-on-year basis |
77.7% |
-34.2% |
-21.5% |
6.1% |
-33.8% |
4.3% |
17.4% |
-7.1% |
381.4% |
-21.5% |
91.9% |
-50.0% |
-48.2% |
41.6% |
Sales composition ratio |
56.4% |
26.8% |
31.6% |
42.3% |
15.0% |
45.5% |
42.1% |
42.5% |
64.6% |
33.8% |
49.0% |
40.5% |
40.3% |
48.2% |
Old unutilised properties |
351 |
3,657 |
1,283 |
2,108 |
2,180 |
897 |
872 |
3,101 |
1,419 |
2,025 |
1,488 |
1,151 |
2,024 |
1,556 |
Year-on-year basis |
-51.6% |
225.4% |
62.0% |
-12.9% |
520.6% |
-75.5% |
-32.0% |
-47.1% |
-34.9% |
125.8% |
70.6% |
-62.9% |
42.6% |
-23.2% |
Sales composition ratio |
18.2% |
63.3% |
45.6% |
28.1% |
45.4% |
25.3% |
35.1% |
44.7% |
26.4% |
54.1% |
36.4% |
31.6% |
45.5% |
41.8% |
Freehold |
28 |
88 |
55 |
1,532 |
1,305 |
465 |
106 |
395 |
191 |
46 |
101 |
526 |
315 |
266 |
Year-on-year basis |
-97.9% |
-60.4% |
-96.4% |
290.8% |
4560.7% |
428.4% |
92.7% |
-74.2% |
-85.3% |
-90.1% |
-4.7% |
33.2% |
64.9% |
478.3% |
Sales composition ratio |
1.5% |
1.5% |
2.0% |
20.4% |
27.1% |
13.1% |
4.3% |
5.7% |
3.6% |
1.2% |
2.5% |
14.5% |
7.1% |
7.1% |
Others |
110 |
104 |
126 |
126 |
133 |
117 |
116 |
97 |
96 |
95 |
88 |
94 |
89 |
105 |
Year-on-year basis |
11.1% |
-14.8% |
5.0% |
21.2% |
21.5% |
12.5% |
-7.9% |
-23.0% |
-28.3% |
-18.8% |
-24.1% |
-3.1% |
-7.3% |
10.5% |
Sales composition ratio |
5.7% |
1.8% |
4.5% |
1.7% |
2.8% |
3.3% |
4.7% |
1.4% |
1.8% |
2.5% |
2.2% |
2.6% |
2.0% |
2.8% |
Construction business |
349 |
379 |
457 |
566 |
468 |
455 |
343 |
395 |
194 |
309 |
409 |
392 |
222 |
– |
Year-on-year basis |
202.6% |
166.5% |
246.1% |
44.0% |
34.1% |
19.8% |
-24.9% |
-30.1% |
-58.4% |
-32.1% |
19.3% |
-0.8% |
14.0% |
– |
Sales composition ratio |
18.1% |
6.6% |
16.3% |
7.5% |
9.7% |
12.8% |
13.8% |
5.7% |
3.6% |
8.3% |
10.0% |
10.8% |
5.0% |
– |
[Statements of income] |
||||||||||||||
Net sales |
1,925 |
5,775 |
2,811 |
7,507 |
4,807 |
3,546 |
2,481 |
6,938 |
5,365 |
3,744 |
4,089 |
3,637 |
4,444 |
3,721 |
Cost of sales |
1,346 |
4,014 |
2,076 |
5,466 |
3,865 |
2,557 |
1,934 |
5,431 |
4,020 |
2,756 |
2,945 |
2,745 |
3,146 |
2,310 |
Gross profit |
579 |
1,762 |
736 |
2,042 |
942 |
989 |
548 |
1,507 |
1,344 |
986 |
1,143 |
892 |
1,297 |
1,411 |
SG&A expenses |
696 |
855 |
783 |
924 |
792 |
744 |
678 |
925 |
816 |
826 |
805 |
802 |
850 |
946 |
Operating income |
-117 |
907 |
-47 |
1,117 |
150 |
245 |
-131 |
382 |
528 |
160 |
338 |
90 |
447 |
466 |
Non-operating income |
4 |
28 |
5 |
5 |
9 |
5 |
51 |
5 |
12 |
8 |
8 |
6 |
7 |
7 |
Non-operating expenses |
34 |
38 |
32 |
40 |
55 |
63 |
60 |
10 |
37 |
40 |
34 |
39 |
39 |
55 |
Ordinary income |
-147 |
898 |
-75 |
1,083 |
103 |
188 |
-140 |
298 |
502 |
128 |
311 |
56 |
415 |
417 |
Extraordinary income |
0 |
0 |
0 |
0 |
0 |
0 |
0 |
|
3 |
0 |
0 |
0 |
19 |
0 |
Extraordinary expenses |
0 |
0 |
0 |
0 |
0 |
0 |
0 |
|
0 |
0 |
||||
Loss before income taxes |
-147 |
898 |
-75 |
1,083 |
103 |
188 |
-140 |
298 |
506 |
128 |
311 |
56 |
435 |
399 |
Total income taxes |
-35 |
312 |
-26 |
349 |
36 |
72 |
-49 |
295 |
183 |
48 |
166 |
-4 |
59 |
60 |
Net income |
-112 |
585 |
-48 |
734 |
67 |
114 |
-90 |
176 |
323 |
79 |
145 |
61 |
375 |
338 |
[Balance Sheets] |
||||||||||||||
Current assets |
16,007 |
15,596 |
17,458 |
18,095 |
18,816 |
20,798 |
20,577 |
19,040 |
17,554 |
17,371 |
18,769 |
18,968 |
19.018 |
21,579 |
Property for sale |
13,129 |
12,290 |
14,890 |
13,493 |
14,655 |
16,923 |
17,312 |
14,424 |
13,493 |
12,586 |
13,134 |
13,301 |
13,304 |
15,152 |
Non-current assets |
1,230 |
1,206 |
1,229 |
1,199 |
1,188 |
1,164 |
1,197 |
1,030 |
951 |
1,054 |
1,081 |
1,082 |
1,124 |
1,099 |
Tangible assets |
469 |
471 |
462 |
456 |
451 |
449 |
443 |
306 |
291 |
290 |
293 |
301 |
317 |
313 |
Investments and other assets |
694 |
666 |
689 |
669 |
668 |
653 |
691 |
655 |
595 |
703 |
732 |
730 |
761 |
743 |
Total assets |
17,236 |
16,802 |
18,686 |
19,294 |
20,004 |
21,962 |
21,774 |
20,071 |
18,505 |
18,425 |
19,849 |
20,051 |
20,134 |
22,678 |
Current liabilities |
6,904 |
6,996 |
9,135 |
9,047 |
9,883 |
7,767 |
7,699 |
5,772 |
5,517 |
7,540 |
8,633 |
8,731 |
8,153 |
8,871 |
Short-term borrowings |
5,645 |
5,360 |
7,702 |
7,203 |
7,729 |
6,352 |
6,676 |
4,463 |
4,272 |
6,105 |
7,171 |
7,367 |
5,025 |
5,057 |
Non-current liabilities |
1,714 |
602 |
389 |
351 |
345 |
4,303 |
4,274 |
4,232 |
2,919 |
792 |
976 |
1,017 |
1,525 |
3,114 |
Long-Term Borrowings |
1,347 |
222 |
|
|
|
3,958 |
3,929 |
3,879 |
2,570 |
483 |
683 |
740 |
1,260 |
2,827 |
Total liabilities |
8,618 |
7,598 |
9,524 |
9,399 |
10,228 |
12,071 |
11,973 |
10,004 |
8,436 |
8,332 |
9,609 |
9,749 |
9.679 |
11,968 |
Total net assets |
8,618 |
9,204 |
9,162 |
9,895 |
9,776 |
9,891 |
9,801 |
10,067 |
10,070 |
10,093 |
10,240 |
10,301 |
10,463 |
10,692 |
Total shareholders’ equity |
8,618 |
9,204 |
9,162 |
9,895 |
9,776 |
9,891 |
9,801 |
10,067 |
10,070 |
10,093 |
10,240 |
10,297 |
10,459 |
10,688 |
Capital stock |
811 |
811 |
814 |
814 |
818 |
818 |
818 |
818 |
818 |
820 |
820 |
820 |
821 |
822 |
Legal capital reserve |
772 |
772 |
775 |
775 |
779 |
779 |
779 |
779 |
779 |
781 |
781 |
781 |
782 |
785 |
Retained earnings |
7,031 |
7,616 |
7,568 |
8,302 |
8,174 |
8,289 |
8,200 |
8,465 |
8,577 |
8,656 |
8,802 |
8,863 |
9,023 |
9,362 |
Stock acquisition right |
4 |
4 |
4 |
4 |
4 |
4 |
4 |
4 |
4 |
4 |
4 |
4 |
4 |
3 |
Total liabilities and net assets |
17,236 |
16,802 |
18,686 |
19,294 |
20,004 |
21,962 |
21,774 |
20,071 |
18,505 |
18,425 |
19,849 |
20,051 |
20,134 |
22,678 |
[Statements of cash flows] |
||||||||||||||
Cash flow from operating activities |
-286 |
-419 |
-3,683 |
-916 |
2,110 |
1,704 |
1,184 |
|||||||
Loss before income taxes |
750 |
1,758 |
291 |
712 |
635 |
1,003 |
833 |
|||||||
Cash flow from investing activities |
-27 |
-70 |
-9 |
-287 |
-26 |
-51 |
-205 |
|||||||
Cash flow from financing activities |
|
-446 |
|
984 |
|
3,021 |
|
952 |
|
-2,129 |
-608 |
-559 |
||
Net increase in cash and cash equiv. |
-760 |
493 |
-671 |
-251 |
-46 |
1,045 |
420 |
|||||||
Cash and cash equiv. at beginning of period |
3,465 |
3,465 |
3,958 |
3,958 |
3,707 |
3,707 |
4,752 |
|||||||
Cash and cash equiv. at end of period |
2,704 |
3,958 |
3,287 |
3,707 |
3,661 |
4,752 |
5,173 |
|||||||
Source: Omega Investment from Company materials.