2026-07-15
Home
Japanese

Omega Investment Co., Ltd.
Chiome Bioscience (Company Note – 3Q update)

| Share price (11/28) | ¥152 | Dividend Yield (22/12 CE) | – % |
| 52weeks high/low | ¥219/135 | ROE(TTM) | -81.63 % |
| Avg Vol (3 month) | 333.8 thou shrs | Operating margin (TTM) | -251.75 % |
| Market Cap | ¥7.0 bn | Beta (5Y Monthly) | 1.08 |
| Enterprise Value | ¥5.4 bn | Shares Outstanding | 46.205 mn shrs |
| PER (22/12 CE) | – X | Listed market | TSE Growth |
| PBR (21/12 act) | 4.17 X |
| Click here for the PDF version of this page |
| PDF Version |
PTRY, a new TribodyTM, has been added to the pipeline.
Other pipelines are progressing well.
◇ New TribodyTM, PTRY is in the pipeline.
In the drug discovery business, each pipeline is progressing well. Chiome Bioscience (hereafter referred to as ‘the company’) has completed a new patent application for TribodyTM , which the company has been focusing on in recent years, and put it into the pipeline as a PTRY. In-house developed products CBA-1535 and CBA-1205 are steadily progressing in Phase I clinical trials.
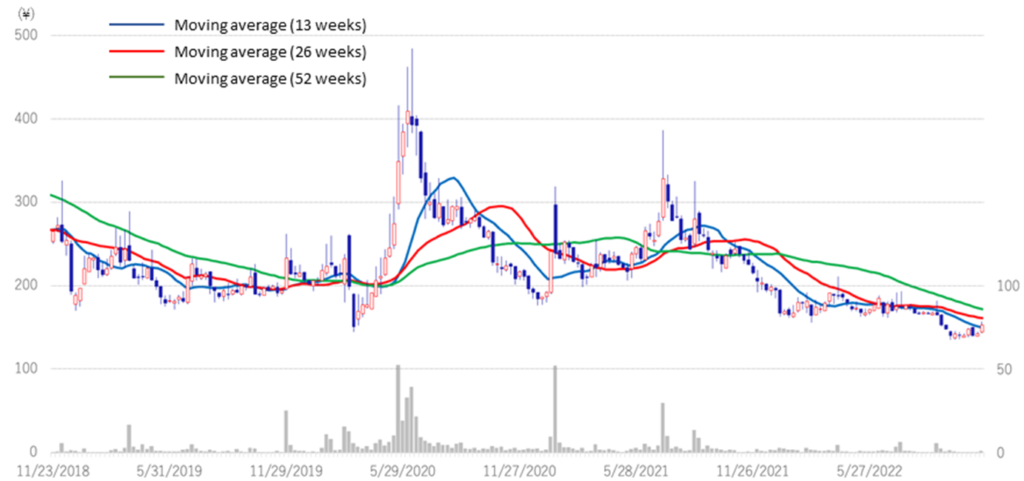
The company’s share price continued to decline after the announcement of 2Q results, hitting a historic low of 135 yen on 28 September, but has been on an upward trend since the announcement of the 3Q results. The share price will likely react positively if the company announces concrete revenue-generating events such as license agreements with partners or milestone revenues. Drug discovery venture companies take a long time to develop their pipelines, so we advise long-term investment without worrying too much about short-term share price movements.
◇ Results for 3Q FY2022/12.
Chiome Bioscience’s 3Q results for FY2022/12 show sales of 433 million yen (-19.9% YoY) and an operating loss of 1,039 million yen (vs an operating loss of 850 million yen in 3Q FY2022). In 1Q FY2021/12, the company recorded an upfront payment of 103 million yen to Henlius for out-licensing its drug discovery and development business in 1Q. In contrast, the company only recorded sales from its drug discovery support business this year.
Drug discovery and development business recorded a segment loss of 690 million yen (the previous year: a loss of 757 million yen) due to an increase of 56 million yen yoy in research and development costs to 916 million yen because of progress in clinical development.
The drug discovery support business continued to enjoy stable business with existing customers, mainly domestic pharmaceutical companies. Sales were 433 million yen (down 4 million yen yoy), and segment profit was 234 million yen (up 0.1 million yen yoy). The main reason for the decline in sales was the inclusion of a large spot project in 1Q of the previous year. The segment profit margin was 54.2%, meeting the target of 50%.
In BS, total assets at end-September 2022 amounted to 2,081 million yen. This is a decrease of 258 million yen compared to the end of December 2021. Cash and deposits decreased by 198 million yen to 1,592 million yen. Others in current assets decreased by 62 million yen due to the reversal of advance payment and recording it as an expense in the current period following the completion of the manufacturing of the CBA-1535 investigational medicinal product. Total net assets amounted to 1,650 million yen (previous year-end: 1,893 million yen). Capital and capital reserves increased by 400 million yen each due to the exercise of subscription rights, while the deficit in retained earnings increased by 1,027 million yen due to the net loss for the year.
| JPY, mn, % | Net sales | YoY % |
Oper. profit |
YoY % |
Ord. profit |
YoY % |
Profit ATOP |
YoY % |
EPS (¥) |
| 2018/12 | 212 | -18.1 | -1,539 | – | -1,533 | – | -1,533 | – | -57.26 |
| 2019/12 | 447 | 110.3 | -1,401 | – | -1,410 | – | -1,403 | – | -44.61 |
| 2020/12 | 480 | 7.4 | -1,283 | – | -1,291 | – | -1,293 | – | -36.06 |
| 2021/12 | 712 | 48.3 | -1,334 | – | -1,329 | – | -1,479 | – | -36.74 |
| 2022/12 (CE) | – | – | – | – | – | – | – | – | – |
| 2021/12 3Q | 541 | 73.5 | -850 | – | -843 | – | -842 | – | -20.94 |
| 2022/12 3Q | 433 | -19.9 | -1,039 | – | -1,029 | – | -1,027 | – | -23.87 |
Drug discovery and development business – pipeline
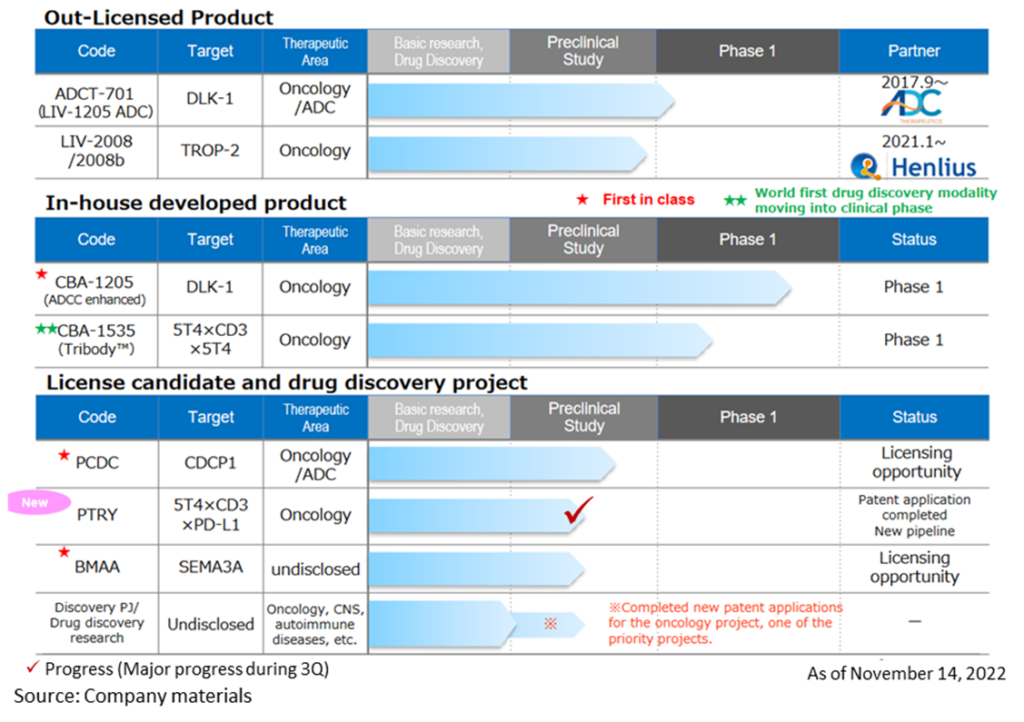
◇Progress in the pipeline:
<In-house developed products>
*CBA-1205; Phase I clinical trial continues to progress from 2Q
The first half of the Phase I trial in patients with solid tumours conducted at the National Cancer Centre showed high safety and tolerability. Although the complete analysis will take a little more time, the mid-stage of the study identified several patients who were refractory to standard treatment and who continued to receive the drug for more than seven months with an SD (stable) evaluation. The trial has moved into the second half of the Phase 1 trial, and dosing has been initiated in patients with hepatocellular carcinoma.
Based on progress in the second half of the Phase 1 trial, CBA-1205 is expected to be out-licensed in 2023-2025. The timing of out-licensing and the upfront payment for out-licensing differ between companies that want to expand their development pipelines as soon as possible and those that focus on business feasibility and probability of success. Still, the company is considering various out-licensing candidates. The company aims to achieve profitability in a single year from 2023 at the earliest and by 2025 at the latest by receiving an upfront payment.
*CBA-1535; Phase I clinical trials started dosing at the end of June.
In February 2022, the company submitted a clinical trial plan notification to the PMDA and began administering the drug in Phase I clinical trials at the National Cancer Centre Central Hospital and Shizuoka Cancer Centre from the end of June. In the first part of the Phase I clinical trial, safety and efficacy signals were evaluated in patients with solid tumours. The second part will evaluate the drug’s efficacy in combination with cancer immunotherapy. The first part is scheduled to continue until the first half of 2024. The second part will be conducted in parallel from mid-2023, with a development plan to confirm safety and efficacy as quickly as possible.
CBA-1535 is the world’s first clinical trial of TribodyTM and, if the concept is confirmed, will expand the applicability of TribodyTM for many cancer antigens.
<Out-license candidates >
*BMAA; Completed joint research with overseas research institutes targeting diseases in which semaphorin 3A is involved. The data on semaphorin 3A and exploratory studies on the semaphorin family obtained to date are planned to be used for future business development activities.
*PCDC; Promoting out-licensing activities focusing on ADC applications and accumulating animal study data. Ongoing out-licensing strategy and targeting pharmaceutical companies that want to expand their pipelines as ADCs and those that want antibodies for ADCs with proprietary ADC technologies.
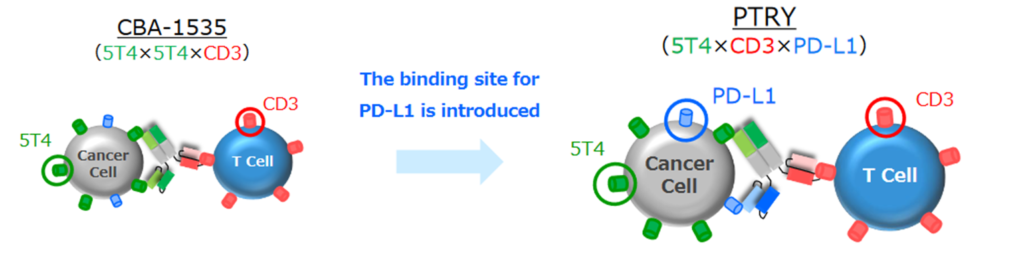
*PTRY; Novel pipeline. Creation of intensely active TribodyTM antibodies by combining new molecules. PTRY, targeting 5T4xCD3xPD-L1, is a new pipeline. Results of joint research on cancer immunotherapy conducted with the Italian public research institute Ceinge-Biotechnologie Avanzate were published in the international journal Journal of Experimental & Clinical Cancer Research. A patent application has been completed for the results obtained through this joint research.
☆PTRY (humanised anti 5T4, anti-CD3 and anti-PD-L1 multispecificity antibody)
| Target molecule | 5T4xCD3xPD-L1 |
| How it started | Therapeutic cancer antibodies created using TribodyTM technology, which recognises three molecules.Therapeutic cancer antibodies with antigen-binding site targets of (i) 5T4, which is found to be expressed in solid tumours, (ii) CD3 on T cells, which are immune cells, and (iii) PD-L1, which is involved in immune checkpoint inhibition. |
| Assumed Indicated Diseases | Malignant mesothelioma, small cell lung cancer, non-small cell lung cancer, triple negative breast cancer (TNBC), etc. |
| Expectation | Expected to be developed as a new treatment for patients for whom conventional cancer immunotherapy has not been sufficiently effective. Also expected to be useful in contributing to healthcare economics by reducing drug costs. |
| Intellectual property | Patent applications completed. |
The company is constantly researching around ten drug discovery themes, including the above, and is continuing to create a new drug discovery pipeline for the future.
<Out-licenced product >
*LIV-1205; Out-licenced to ADC Therapeutics, Switzerland, for ADC use only. ADCT is preparing a clinical trial in neuroendocrine cancer in collaboration with the National Cancer Institute (NCI), USA.
*LIV-2008; In January 2021, a licence agreement was signed with Shanghai Henlius Biotech, Inc. in China. The licence grants development, manufacturing and marketing rights in China, Taiwan, Hong Kong and Macau. Henlius is considering several development plans for future IND filings. Furthermore, licensing activities to other pharmaceutical companies are ongoing.
◇ Progress in drug discovery support business: Contract agreement signed with Rohto Pharmaceutical Co.
On 11 July 2022, the company signed a new outsourcing agreement with Rohto Pharmaceuticals to create therapeutic antibodies with option rights. The company will receive compensation for using its ADLib®︎ system to acquire antibodies to therapeutic target antigens for Rohto and perform affinity testing of the acquired antibodies. Suppose the antibodies create the move to the commercialisation and development stage. In that case, the option right is exercised, and a licence agreement is concluded with Rohto (the option right is exercisable for five years after completing the work related to this consignment agreement).
In addition, Fujirebio launched a diagnostic kit to be developed using ADLib®︎ antibodies. The company also continues to deepen its business with existing customers, mainly traditional domestic pharmaceutical companies.
◇Core technology: evolving and deepening the use and improvement of the ADLib®︎ system / Tribody TM
The company continues to utilise and improve its core technology, the ADLib ®︎ system, through participation in projects funded by the Japan Agency for Medical Research and Development (AMED). In addition, the company received patent applications for the ADLib ®︎ system in Japan and Europe. These studies will also continue to be carried out to improve the technology related to the drug discovery support business and help strengthen the in-house drug discovery pipeline.
◇Financing trends: research and development funding secured during the current financial year
On 15 December 2021, the company concluded a contract to raise approximately 1.7 billion yen through the issuance of 18 warrants (with a clause to amend the exercise price) through a third-party allotment. The company is on track to secure investment in research and development during the current financial year, with 22,184 unexercised warrants remaining at end-October 2022, representing 27.7% of the total.
◇Full-year forecast for FY2022/12: The drug discovery support business (full-year: 620 million yen) is progressing as planned.
For FY2022/12, the company has announced sales of 620 million yen for the drug discovery support business, which is expected to generate ongoing revenues which appear to be progressing in line with current expectations. In terms of costs, R&D investment is expected to continue to be in the region of 1 billion per year as clinical trials and investigational drug manufacturing costs increase in line with the progress of each pipeline.
◇Share price trend: Attractive as a biotech stock for long-term holding.
The company’s share price continued to fall after the 2Q results announcement, hitting a historic low of 135 yen on 28 September. Since the announcement of the 3Q results, the share price has been on an upward trend. Generally, research and development of biopharmaceuticals take a long time, and the development risk is high. There is a possibility of upfront and milestone income from out-licensing, but there is also an element of uncertainty as the timing and amount are yet to be determined. Investing in drug discovery ventures is based on long-term investment, not on short-term share price movements.
Meanwhile, the positive news is continuously being transmitted in the company, such as clinical trial applications and patent filings. The company also has several drug discovery projects in the pipeline, and clinical trials for CBA-1205 and CBA-1535 are progressing steadily. The company has been fulfilling its commitments to investors ahead of schedule, with PTRY newly added to the pipeline in the current 3Q. Considering these points, the current share price level is an attractive investment for investors who can tolerate risk from a medium- to long-term perspective.
Stock price (3 years)
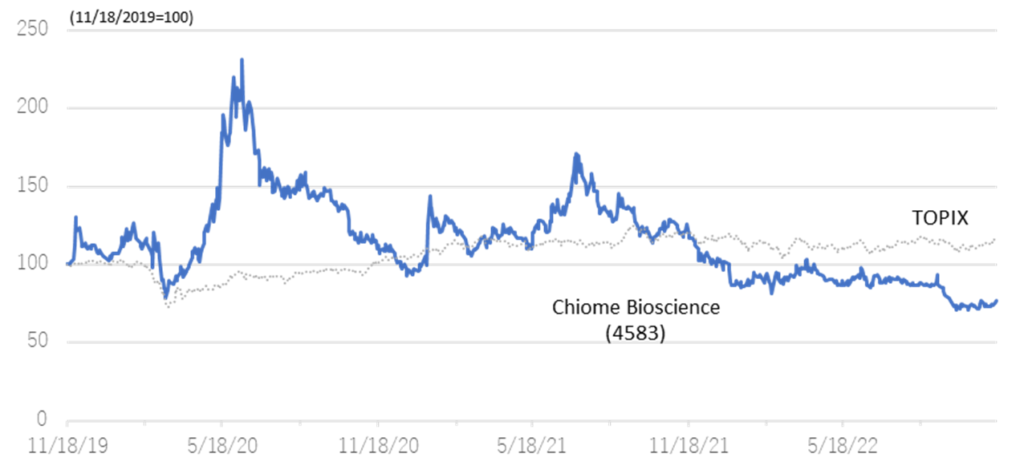
Relative chart; Chiome Bioscience (4583) and TOPIX (3 years)
Financial data
| FY (¥mn) | 2019/12 | 2020/12 | 2021/12 | 2022/12 | |||||||||||
| 1Q | 2Q | 3Q | 4Q | 1Q | 2Q | 3Q | 4Q | 1Q | 2Q | 3Q | 4Q | 1Q | 2Q | 3Q | |
| [Statements of income] | |||||||||||||||
| Net sales | 64 | 77 | 142 | 165 | 91 | 82 | 139 | 169 | 246 | 139 | 157 | 171 | 128 | 149 | 156 |
| Drug Discovery and Development Business |
0 | 1 | 1 | 28 | 1 | 1 | 0 | 1 | 103 | 0 | 0 | 0 | 0 | 0 | 0 |
| Drug Discovery Support Business | 63 | 76 | 142 | 137 | 90 | 82 | 138 | 168 | 143 | 138 | 157 | 171 | 128 | 149 | 156 |
| Cost of sales | 27 | 26 | 58 | 52 | 61 | 46 | 59 | 70 | 64 | 62 | 78 | 86 | 57 | 69 | 72 |
| Gross profit | 37 | 51 | 84 | 113 | 30 | 36 | 80 | 99 | 182 | 77 | 79 | 84 | 70 | 80 | 84 |
| SG&A expenses | 464 | 374 | 503 | 346 | 456 | 346 | 424 | 303 | 337 | 337 | 515 | 568 | 557 | 373 | 344 |
| R&D expenses | 363 | 273 | 407 | 256 | 343 | 266 | 342 | 206 | 216 | 243 | 401 | 451 | 446 | 245 | 225 |
| Operating profit | -426 | -324 | -419 | -233 | -426 | -310 | -344 | -204 | -155 | -260 | -436 | -483 | -486 | -292 | -260 |
| Non-operating income | 0 | 1 | 4 | 0 | 2 | 0 | 3 | 0 | 7 | 0 | 2 | 4 | 0 | 16 | 0 |
| Non-operating expenses | 6 | 4 | 4 | 0 | 0 | 2 | 10 | 1 | 1 | 0 | 1 | 6 | 4 | 1 | 1 |
| Ordinary profit | -432 | -327 | -418 | -233 | -425 | -311 | -351 | -205 | -150 | -259 | -434 | -486 | -491 | -278 | -261 |
| Extraordinary income | 2 | 1 | 6 | 0 | 0 | 0 | 0 | 6 | |||||||
| Extraordinary expenses | |||||||||||||||
| Loss before income taxes | -430 | -326 | -412 | -233 | -425 | -310 | -351 | -205 | -149 | -247 | -433 | -636 | -491 | -278 | -255 |
| Total income taxes | 1 | 0 | 1 | 0 | 1 | 0 | 1 | 1 | 11 | 1 | 1 | 0 | 1 | 2 | 1 |
| Net income | -431 | -326 | -413 | -234 | -425 | -311 | -352 | -206 | -161 | -248 | -434 | -637 | -492 | -279 | -257 |
| [Balance Sheets] | |||||||||||||||
| Current assets | 3,048 | 3,206 | 2,807 | 2,561 | 2,309 | 2,805 | 3,316 | 3,249 | 3,294 | 3,088 | 2,675 | 2,216 | 2,005 | 1,792 | 1,955 |
| Cash and deposits | 2,776 | 2,899 | 2,469 | 2,106 | 1,967 | 2,472 | 2,881 | 2,686 | 2,580 | 2,302 | 2,071 | 1,790 | 1,744 | 1,471 | 1,592 |
| Non-current assets | 219 | 217 | 242 | 247 | 247 | 249 | 249 | 246 | 244 | 241 | 274 | 122 | 121 | 128 | 126 |
| Tangible assets | 15 | 14 | 12 | 11 | 10 | 9 | 8 | 7 | 6 | 6 | 4 | 4 | 3 | 3 | 2 |
| Investments and other assets | 204 | 204 | 230 | 236 | 237 | 240 | 241 | 238 | 237 | 235 | 269 | 118 | 117 | 124 | 122 |
| Total assets | 3,267 | 3,423 | 3,049 | 2,808 | 2,556 | 3,054 | 3,566 | 3,495 | 3,537 | 3,329 | 2,950 | 2,339 | 2,126 | 1,920 | 2,081 |
| Current liabilities | 177 | 207 | 154 | 145 | 315 | 427 | 378 | 343 | 378 | 428 | 468 | 392 | 419 | 390 | 376 |
| Short-term borrowings | 142 | 199 | 199 | 180 | 180 | 190 | 199 | 183 | 183 | 188 | 188 | ||||
| Non-current liabilities | 41 | 41 | 41 | 41 | 42 | 42 | 42 | 42 | 42 | 42 | 53 | 53 | 53 | 54 | 54 |
| Total liabilities | 219 | 248 | 196 | 187 | 357 | 469 | 420 | 385 | 420 | 470 | 522 | 446 | 473 | 444 | 431 |
| Total net assets | 3,048 | 3,175 | 2,853 | 2,622 | 2,199 | 2,585 | 3,146 | 3,110 | 3,118 | 2,859 | 2,428 | 1,893 | 1,653 | 1,476 | 1,650 |
| Total shareholders’ equity | 3,048 | 3,175 | 2,853 | 2,622 | 2,199 | 2,585 | 3,146 | 3,110 | 3,118 | 2,859 | 2,428 | 1,857 | 1,621 | 1,445 | 1,631 |
| Capital stock | 5,856 | 6,084 | 6,132 | 6,132 | 6,133 | 846 | 1,303 | 1,388 | 1,471 | 1,471 | 1,472 | 1,515 | 1,642 | 1,695 | 1,916 |
| Legal capital reserve | 5,846 | 6,074 | 6,122 | 6,122 | 6,123 | 2,446 | 2,903 | 2,987 | 3,071 | 3,071 | 3,072 | 3,115 | 3,242 | 3,295 | 3,516 |
| Retained earnings | -8,682 | -9,008 | -9,421 | -9,655 | -10,080 | -736 | -1,088 | -1,294 | -1,455 | -1,703 | -2,136 | -2,773 | -3,262 | -3,544 | -3,801 |
| Subscription rights to shares | 28 | 26 | 20 | 22 | 24 | 30 | 28 | 29 | 30 | 19 | 19 | 35 | 31 | 30 | 18 |
| Total liabilities and net assets | 3,267 | 3,423 | 3,049 | 2,808 | 2,556 | 3,054 | 3,566 | 3,495 | 3,537 | 3,329 | 2,950 | 2,339 | 2,126 | 1,920 | 2,081 |
| [Statements of cash flows] | |||||||||||||||
| Cash flow from operating activities | -677 | -1,537 | -528 | -1,361 | -560 | -1,139 | -660 | ||||||||
| Loss before income taxes | -755 | -1,401 | -734 | -1,290 | -396 | -1,466 | -768 | ||||||||
| Cash flow from investing activities | – | -26 | – | 3 | – | -35 | – | ||||||||
| Purchase of investment securities | – | – | – | – | – | – | – | ||||||||
| Cash flow from financing activities | 1,248 | 1,341 | 894 | 1,944 | 176 | 271 | 341 | ||||||||
| Proceeds from issuance of common shares |
1,249 | 1,345 | 697 | 1,769 | 166 | 253 | 336 | ||||||||
| Net increase in cash and cash equiv. | 570 | -222 | 366 | 580 | -384 | -895 | -319 | ||||||||
| Cash and cash equiv. at beginning of period | 2,328 | 2,328 | 2,105 | 2,105 | 2,686 | 2,686 | 1,790 | ||||||||
| Cash and cash equiv. at end of period | 2,899 | 2,105 | 2,472 | 2,686 | 2,301 | 1,790 | 1,471 | ||||||||
Note) For the cash flow statement, Q2 is the cumulative of Q1 to Q2, and Q4 is the cumulative of Q1 to Q4. Therefore, the beginning balance will be the beginning balance of Q1 for both Q2 and Q4.
Source: Omega Investment from Company materials.