2026-07-15
Home
Japanese

Omega Investment Co., Ltd.
Digital Hearts Holdings (Company Note Q2 update)

| Share price (12/9) | ¥1,876 | Dividend Yield (22/3 CE) | 1.11 % |
| 52weeks high/low | ¥2,700 / 1,405 | ROE(TTM) | 24.69 % |
| Avg Vol (3 month) | 93.4 thou shrs | Operating margin (TTM) | 5.45 % |
| Market Cap | ¥44.8 bn | Beta (5Y Monthly) | 0.90 |
| Enterprise Value | ¥41.7 bn | Shares Outstanding | 23.890 mn shrs |
| PER (23/3 CE) | 18.1 X | Listed market | TSE Prime section |
| PBR (22/3 act) | 4.77 X |
| Click here for the PDF version of this page |
| PDF Version |
Record-high 1H profit – Enterprise business continues high growth while Entertainment business posts double-digit earnings growth
◇Summary of financial results: both businesses registered a significant increase in sales, posting record 1H profits
Enterprise Business, a key business, continued to grow strongly, with sales up 60% yoy. Entertainment Business also achieved double-digit revenue growth on solid sales for console games. Despite continued growth investment in Enterprise Business, the company delivered record profits in 1H, partly because of increased sales in Entertainment Business. The company continues to invest in AGEST, which is responsible for the enterprise business, to develop the business infrastructure and continues to focus on this business as a critical segment for high growth in the medium term.
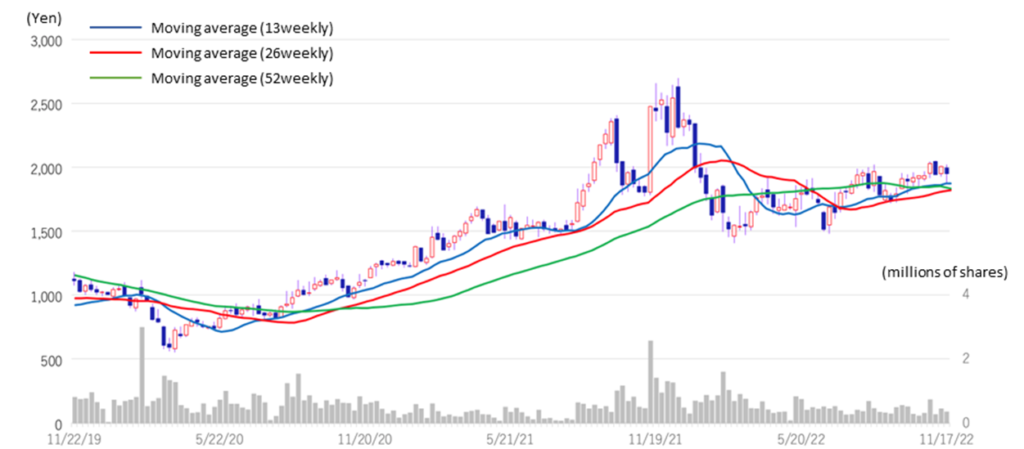
◇ Stock price trends: undervalued compared to peers
The company’s share price has rebounded over the past year, bottoming out at 1,405 yen on 24 February. The profit model has worked as designed, with profits generated by the highly profitable Entertainment Business underpinning earnings while continuing growth investment in Enterprise Business. With good business performance and future growth expectations combined, the company’s shares look undervalued in terms of PER and PBR compared to its peers.
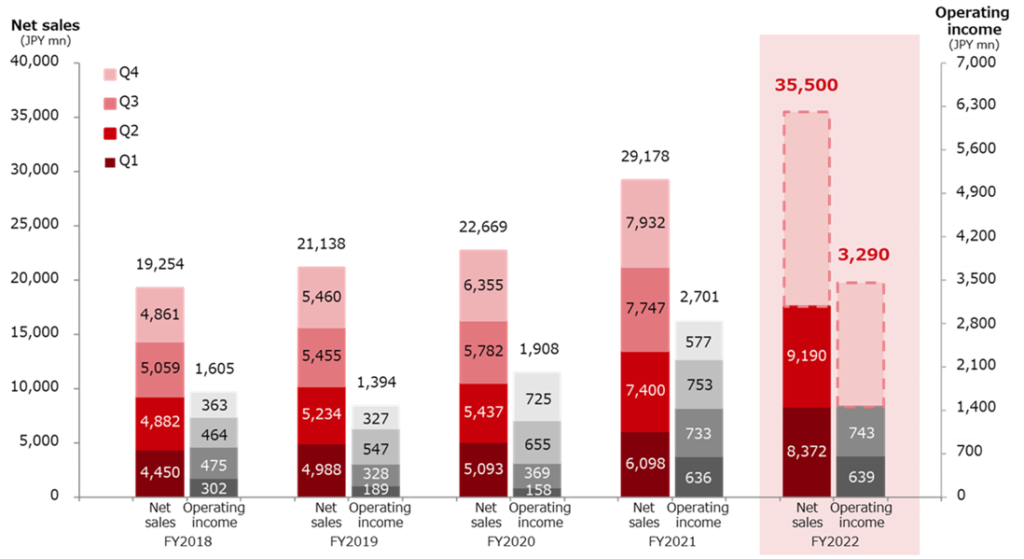
◇ Financial results for Q2 FY2023/3: record high sales and operating profit in 1H
Digital Hearts Holdings’ Q2 results for FY2023/3 show double-digit revenue growth in both Enterprise Business and Entertainment Business. While continuing growth investment in Enterprise Business, the company achieved a record 1H operating profit due to profit generation in Entertainment Business, which is a cash cow. Sales and operating profit reached record 1H highs of 17,562 million yen (+30.1% YoY) and 1,382 million yen (+0.9% YoY), respectively, despite amortisation of goodwill on M&A and growth investment in Enterprise Business. EBITDA increased to 1,920 million yen, rising 17.7%.
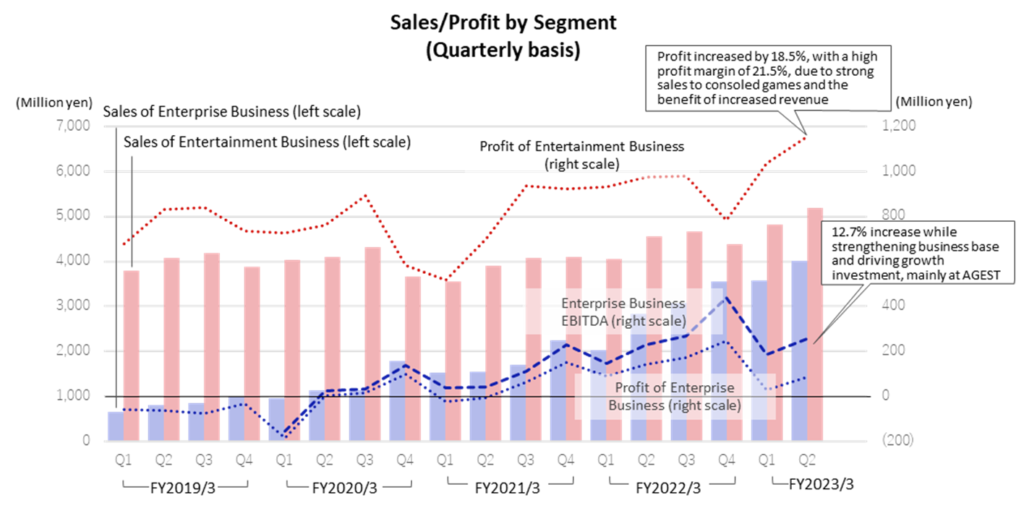
By segment, Enterprise Business saw a 56.6% increase in sales, with existing businesses continuing double-digit revenue growth while M&As carried out in the previous year contributing to the growth as well. Segment profit halved (+17.8% on an EBITDA basis) due to the strengthening of the already-announced business platform and aggressive investment in growth. On the other hand, sales for console games in Entertainment Business remained extremely strong. The segment’s profit grew 15.0% yoy, registering profit margins of 21.9%.
◇ Full-year progress in FY2023/3: on track with plans, targeting record sales and operating profit
As of Q2, progress against the full-year forecast was 49% of sales, 42% of operating profit and 45% of EBITDA. In 2H, those companies that have been added to the group through M&A will make a full earnings contribution, and the company will likely achieve these targets.
| JPY, mn, % | Net sales | YoY % |
Oper. profit |
YoY % |
Ord. profit |
YoY % |
Profit ATOP |
YoY % |
EPS (¥) |
DPS (¥) |
| 2019/3 | 19,254 | 11.0 | 1,605 | -7.5 | 1,651 | -7.4 | 1,575 | 31.3 | 72.13 | 13.00 |
| 2020/3 | 21,138 | 9.8 | 1,394 | -13.2 | 1,372 | -16.9 | 792 | -49.7 | 36.31 | 14.00 |
| 2021/3 | 22,669 | 7.2 | 1,908 | 36.9 | 1,975 | 43.9 | 974 | 23.0 | 45.15 | 14.00 |
| 2022/3 | 29,178 | 28.7 | 2,701 | 41.5 | 2,778 | 40.7 | 1,780 | 82.7 | 82.35 | 15.00 |
| 2023/3 (CE) | 35,500 | 21.7 | 3,290 | 21.8 | 3,290 | 18.4 | 2,250 | 26.4 | 104.04 | 21.00 |
| 2022/3 Q2 | 13,498 | 28.2 | 1,370 | 159.7 | 1,431 | 151.0 | 917 | 157.9 | 42.45 | 7.50 |
| 2023/3 Q2 | 17,562 | 30.1 | 1,382 | 0.9 | 1,527 | 6.7 | 950 | 3.5 | 43.89 | 10.50 |
Full year consolidated sales / operating profit trend
◇Segmental trends: (see also graph on p. 3 and table on p. 6)
1) Enterprise Business: 56.6% increase in revenue (7,614 million yen), 17.8% increase in EBITDA
The company actively pursued proposal-based sales activities to win new projects, driven by the development of DX and the growing need for test outsourcing. As a result, existing businesses continued to achieve double-digit revenue growth. In addition, the recent mergers and acquisitions have also contributed to a nearly 60% increase in sales. In line with the rise in sales, the gross profit margin also improved, reaching almost 28% in Q2 alone. On the other hand, segment profit halved due to higher SG&A expenses associated with growth investments, such as building a solid future business foundation. On an EBITDA basis, the company posted a 17.8% increase, to 443 million yen.
QA solution: sales of 4,583 million yen (+54.5%). Improved profitability through cross-selling, including security testing and test automation, based on the company’s strength in manual software testing. Focused on increasing the number of new customers and the scale of transactions per customer company, CEGB, acquired through M&A, has been contributing to the company’s results since Q1, but even excluding the impact of CEGB and other new consolidated subsidiaries, sales grew 29.1%. The gross profit margin also rose as the utilisation rate of engineers increased and stood at 35.3% in Q2 alone. In Q2, the number of customers placing orders and the average order value per customer increased steadily by 23 companies and 2 million yen, respectively, to 650 companies and 12 million yen, compared with Q1. (Calculated based on LTM results, excluding subsidiaries that consolidated for less than 12 months).
IT services and others: sales of 3,030 million yen (+59.9%). identity Inc. (SES: temporary engineer staffing), which became a subsidiary in June 2021, contributed. The number of registered engineers at identity Inc. grew to 23,000, driving the top-line expansion. Security monitoring services are also growing steadily against the expansion of remote working.
2) Entertainment Business: 16.0% increase in revenue (10,020 million yen), 15.0% increase in segment profit
The domestic console games market is robust, and the overseas marketing for content is accelerating, capturing demand well. Domestic debugging and Global and others saw sales increase by more than 15%. Segment profit increased by 15.0% due to an increase in Domestic debugging sales and an improvement in gross profit margin, generating a record-high 1H segment profit. The profit margin remained high at 21.9%.
Domestic debugging: sales 6,896 million (+15.7%). The development of new titles in the console game market has become active. Sales to console games increased significantly, up 1.5 times yoy. New titles are becoming larger, and the scale of debugging projects is rising. New large-scale projects are being steadily acquired, and the company’s market share in this field appears to be increasing. On the profit side, gross profit margins have remained high at more than 32% due to ongoing efforts to improve operational efficiency and the benefits of increased revenues.
Global and others: sales: 3,124 million yen (+16.8%). The company secured a steady stream of cross-border/global projects in a buoyant market environment. All Global, Creative, Media and others services achieved double-digit revenue growth. From now on, in addition to pursuing synergies among the DIGITAL HEARTS CROSS Group and overseas subsidiaries, the company plans to expand its business and create new value in the Asian domain by strengthening initiatives with alliance partners, including GameWith, with which it has newly formed a capital and business alliance.
◇ FY2023/3 forecasts: on target. Aiming for record-high sales and operating profit.
Q2 progress ratios were sales 49.5%, operating profit 42.0%, EBITDA 45.3% and profit ATOP (attributable to owners of the parent) 42.2% versus the company‘s full-year forecasts. Sales are expected to progress on target, as growth is expected centring around Enterprise Business from Q3 onwards, and because the benefits of M&A and other factors will kick in. As per profit, the company may well meet its full-year targets as it will likely benefit from revenue growth and curb some of the growth investments in 2H, which were extensive in 1H.
◇ Growth strategy: pursue advanced quality technology and actively use M&A to rapidly expand Enterprise Business
As mentioned repeatedly, the company’s focus for future growth is Enterprise Business. To ensure the growth of this business, the company launched AGEST in April 2022. The company made it the core Enterprise Business and concentrates the management resources. Apart from “Digital Hearts”, which has a strong brand in the debugging field, the company has invested in strengthening its business foundation and growth in the enterprise field by strengthening its branding as an “AGEST” (Advanced Quality Technology Company), reinforcing its human resources and improving its office environment. (see the previous page bottom graphic).
Developing a business foundation for future growth
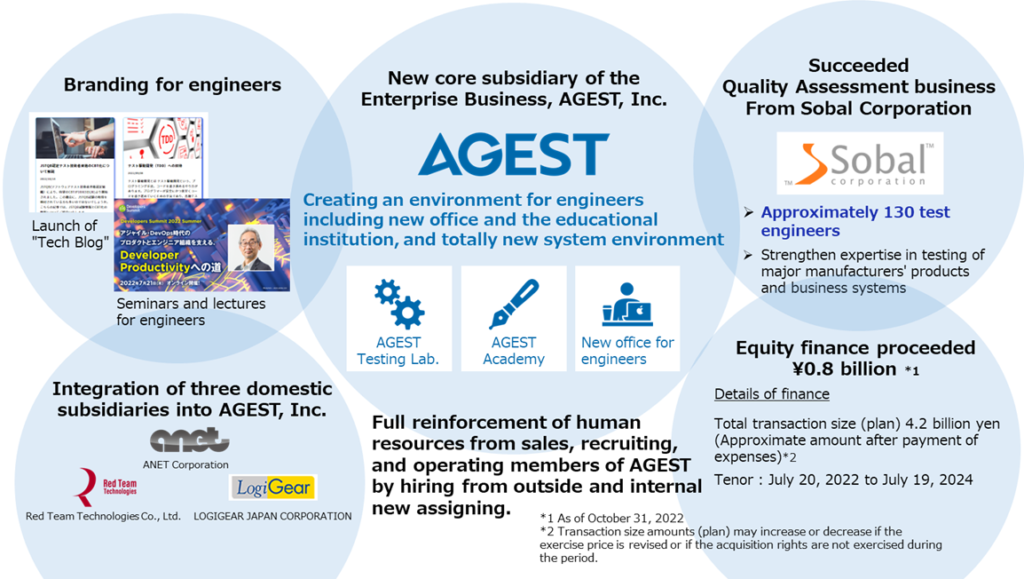
The company invested 0.32 billion yen more in AGEST in 1H (breakdown: +0.2 billion yen in personnel costs, +0.05 billion yen in office costs, +0.04 billion yen in branding enhancement and 0.04 billion yen in system-related expenses). Although this will decrease slightly in 2H, the company plans to invest +0.56 billion yen for the full-year over last year (excluding one-off costs). It aims to increase QA solution customers to 830 by the end of FY2023/3 and by more than 20% beyond this year. The company thinks it can recover the upfront investment made this year if the number of customers grows to this degree. By expanding sales while strengthening recruitment, the company aims to deliver an operating margin in the 7% range in Enterprise Business in 2H and over 10% in the medium term.
◇ Share price: scope for further upside judging from peer comparison
The company‘s share price has continued to rise over the past year, bottoming out at 1,405 yen on 24 February. The profit model is working as designed, with profits generated by the highly profitable Entertainment Business underpinning earnings while continuing to invest in growth in Enterprise Business.
On the other hand, the valuations of the shares have remained below the historical averages (following page graphic). The multiples of the peers are Pole to Win Holdings (3657, debugging only) PER: 19.13, PBR: 2.03, SHIFT (3697, enterprise 90%), PER: 77.04, PBR: 18.76 and VALTES (4442, all enterprise business) PER: 39.72, PBR: 11.86. The company’s Enterprise Business accounts for more than 40% of sales and should contribute to profits in the future. Growth expectations and the company’s valuation relative to its peers point to further upside in the share price.
Digital Hearts Holdings (3676) Share Price Trend (3Year-to-date)
Historical PER/PBR (five years)

PBR is based on LTM and therefore differs from the figures in the table in P1.
Financial data I
2020/3 |
2021/3 |
2022/3 |
2023/3 |
|||||||||||
Q1 |
Q2 |
Q3 |
Q4 |
Q1 |
Q2 |
Q3 |
Q4 |
Q1 |
Q2 |
Q3 |
Q4 |
Q1 |
Q2 |
|
[Sales by segment] |
||||||||||||||
Net sales |
4,988 |
5,234 |
5,455 |
5,460 |
5,093 |
5,437 |
5,782 |
6,355 |
6,098 |
7,400 |
7,747 |
7,932 |
8,372 |
9,190 |
YoY |
12.1% |
7.2% |
7.8% |
15.0% |
2.1% |
3.9% |
6.0% |
16.4% |
19.7% |
36.1% |
34.0% |
24.8% |
37.3% |
24.2% |
Enterprise business |
954 |
1,140 |
1,133 |
1,794 |
1,523 |
1,540 |
1,710 |
2,246 |
2,029 |
2,833 |
3,074 |
3,553 |
3,589 |
4,024 |
YoY |
46.3% |
41.5% |
32.0% |
82.5% |
59.6% |
35.1% |
50.9% |
25.2% |
33.2% |
83.9% |
79.7% |
58.2% |
76.8% |
42.0% |
Composition of sales |
19.1% |
21.8% |
20.8% |
32.9% |
29.9% |
28.3% |
29.6% |
35.3% |
33.3% |
38.3% |
39.7% |
44.8% |
42.9% |
43.8% |
New sub-segments |
||||||||||||||
QA solutions |
1,395 |
1,572 |
1,772 |
2,121 |
2,102 |
2,481 |
||||||||
YoY |
– |
– |
– |
– |
50.7% |
57.8% |
||||||||
Composition of sales |
22.9% |
21.2% |
22.9% |
26.7% |
25.1% |
27.0% |
||||||||
IT services and others |
634 |
1,260 |
1,301 |
1,432 |
1,486 |
1,543 |
||||||||
YoY |
– |
– |
– |
– |
134.3% |
22.4% |
||||||||
Composition of sales |
10.4% |
17.0% |
16.8% |
18.1% |
17.7% |
16.8% |
||||||||
Old sub-segments |
||||||||||||||
System testing |
430 |
570 |
488 |
924 |
788 |
777 |
937 |
1,078 |
1,018 |
1,144 |
1,233 |
1,558 |
– |
– |
YoY |
65.8% |
99.5% |
33.5% |
91.4% |
83.1% |
36.2% |
92.0% |
16.7% |
29.2% |
47.2% |
31.5% |
44.5% |
– |
– |
Composition of sales |
8.6% |
10.9% |
8.9% |
16.9% |
15.5% |
14.3% |
16.2% |
17.0% |
16.7% |
15.5% |
15.9% |
19.6% |
– |
– |
IT services / Security |
523 |
569 |
645 |
869 |
735 |
763 |
772 |
1,167 |
1,011 |
1,688 |
1,841 |
1,995 |
– |
– |
YoY |
33.4% |
9.5% |
30.9% |
73.9% |
40.4% |
34.1% |
19.8% |
34.3% |
37.5% |
121.2% |
138.2% |
70.9% |
– |
– |
Composition of sales |
10.5% |
10.9% |
11.8% |
15.9% |
14.4% |
14.0% |
13.4% |
18.4% |
16.6% |
22.8% |
23.8% |
25.2% |
– |
– |
Entertainment business |
4,033 |
4,093 |
4,321 |
3,666 |
3,566 |
3,900 |
4,072 |
4,109 |
4,069 |
4,566 |
4,672 |
4,378 |
4,818 |
5,201 |
YoY |
6.2% |
0.5% |
2.9% |
-5.4% |
-11.6% |
-4.7% |
-5.8% |
12.1% |
14.0% |
17.1% |
14.7% |
6.6% |
18.4% |
13.9% |
Composition of sales |
80.9% |
78.2% |
79.2% |
67.1% |
70.0% |
71.7% |
70.4% |
64.7% |
66.7% |
61.7% |
60.3% |
55.2% |
57.6% |
56.6% |
New sub-segments |
||||||||||||||
Domestic debugging |
2,681 |
2,846 |
2,953 |
3,054 |
2,931 |
3,030 |
3,149 |
3,011 |
3,334 |
3,562 |
||||
YoY |
– |
– |
– |
– |
9.3% |
6.4% |
6.7% |
-1.4% |
13.7% |
17.5% |
||||
Composition of sales |
52.7% |
52.4% |
51.1% |
48.1% |
48.1% |
41.0% |
40.7% |
38.0% |
39.8% |
38.8% |
||||
Global and others |
887 |
1,049 |
1,118 |
1,054 |
1,137 |
1,536 |
1,522 |
1,366 |
1,484 |
1,640 |
||||
YoY |
– |
– |
– |
– |
28.2% |
46.3% |
36.1% |
29.6% |
30.4% |
6.8% |
||||
Composition of sales |
17.4% |
19.3% |
19.3% |
16.6% |
18.7% |
20.8% |
19.7% |
17.2% |
17.7% |
17.8% |
||||
Old sub-segments |
||||||||||||||
Debugging |
3,444 |
3,480 |
3,730 |
3,167 |
3,023 |
3,235 |
3,375 |
3,424 |
– |
– |
– |
– |
– |
– |
YoY |
10.8% |
6.0% |
6.8% |
-1.5% |
-12.2% |
-7.0% |
-9.5% |
8.1% |
– |
– |
– |
– |
– |
– |
Composition of sales |
69.1% |
66.5% |
68.4% |
58.0% |
59.4% |
59.5% |
58.4% |
53.9% |
– |
– |
– |
– |
– |
– |
Game Consoles |
1,186 |
1,056 |
1,341 |
1,126 |
1,023 |
1,147 |
1,258 |
1,402 |
– |
– |
– |
– |
– |
– |
YoY |
21.1% |
5.4% |
15.9% |
10.7% |
-13.7% |
8.6% |
-6.2% |
24.5% |
– |
– |
– |
– |
– |
– |
Composition of sales |
23.8% |
20.2% |
24.6% |
20.6% |
20.1% |
21.1% |
21.8% |
22.1% |
– |
– |
– |
– |
– |
– |
Mobile solutions |
2,013 |
2,171 |
2,141 |
1,848 |
1,819 |
1,959 |
2,005 |
1,870 |
– |
– |
– |
– |
– |
– |
YoY |
1.0% |
1.7% |
2.0% |
-4.9% |
-9.6% |
-9.8% |
-6.4% |
1.2% |
– |
– |
– |
– |
– |
– |
Composition of sales |
40.4% |
41.5% |
39.2% |
33.8% |
35.7% |
36.0% |
34.7% |
29.4% |
– |
– |
– |
– |
– |
– |
Amusement |
245 |
253 |
248 |
193 |
179 |
130 |
111 |
153 |
– |
– |
– |
– |
– |
– |
YoY |
77.5% |
75.7% |
4.6% |
-24.3% |
-26.9% |
-48.6% |
-55.2% |
-20.7% |
– |
– |
– |
– |
– |
– |
Composition of sales |
4.9% |
4.8% |
4.5% |
3.5% |
3.5% |
2.4% |
1.9% |
2.4% |
– |
– |
– |
– |
– |
– |
Creative |
350 |
307 |
282 |
285 |
311 |
367 |
372 |
398 |
– |
– |
– |
– |
– |
– |
YoY |
-31.4% |
-45.2% |
-33.1% |
-27.6% |
-11.2% |
19.6% |
32.0% |
39.2% |
– |
– |
– |
– |
– |
– |
Composition of sales |
7.0% |
5.9% |
5.2% |
5.2% |
6.1% |
6.8% |
6.4% |
6.3% |
– |
– |
– |
– |
– |
– |
Media and others |
238 |
306 |
308 |
212 |
234 |
294 |
324 |
286 |
– |
– |
– |
– |
– |
– |
YoY |
35.5% |
32.6% |
8.7% |
-19.4% |
-1.5% |
-3.9% |
5.0% |
34.5% |
– |
– |
– |
– |
– |
– |
Composition of sales |
4.8% |
5.9% |
5.7% |
3.9% |
4.6% |
5.4% |
5.6% |
4.5% |
– |
– |
– |
– |
– |
– |
Operating profit |
189 |
328 |
547 |
327 |
158 |
369 |
655 |
725 |
636 |
733 |
753 |
577 |
639 |
742 |
YoY |
-37.2% |
-30.9% |
18.0% |
-9.9% |
-16.4% |
12.4% |
19.7% |
121.3% |
301.3% |
98.5% |
14.9% |
-20.4% |
0.5% |
1.3% |
Operating profit margin |
3.8% |
6.3% |
10.0% |
6.0% |
3.1% |
6.8% |
11.3% |
11.4% |
10.4% |
9.9% |
9.7% |
7.3% |
7.6% |
8.1% |
Enterprise business |
-184 |
2 |
14 |
100 |
-21 |
-7 |
64 |
152 |
87 |
144 |
171 |
246 |
29 |
84 |
YoY |
– |
– |
– |
– |
– |
– |
363.5% |
52.4% |
– |
– |
163.8% |
61.9% |
-66.2% |
-41.5% |
Segment profit margin |
-19.4% |
0.3% |
1.2% |
5.6% |
-1.4% |
-0.5% |
3.8% |
6.8% |
4.3% |
5.1% |
5.6% |
6.9% |
0.8% |
2.1% |
Entertainment business |
727 |
760 |
891 |
585 |
517 |
700 |
936 |
923 |
930 |
975 |
978 |
783 |
1,036 |
1,155 |
YoY |
7.3% |
-8.8% |
6.1% |
-20.3% |
-28.9% |
-8.0% |
5.0% |
57.9% |
79.9% |
39.3% |
4.5% |
-15.2% |
11.4% |
18.5% |
Segment profit margin |
18.0% |
18.6% |
20.6% |
16.0% |
14.5% |
18.0% |
23.0% |
22.5% |
22.9% |
21.4% |
20.9% |
17.9% |
21.5% |
22.2% |
Note) The sum of this table’s segment sales and operating profit may not match the consolidated results, as there are some sales and operating profit adjustments.
ource: Omega Investment, based on company data.
Financial data II
2020/3 |
2021/3 |
2022/3 |
2023/3 |
|||||||||||
Q1 |
Q2 |
Q3 |
Q4 |
Q1 |
Q2 |
Q3 |
Q4 |
Q1 |
Q2 |
Q3 |
Q4 |
Q1 |
Q2 |
|
[Statements of income] |
||||||||||||||
Net sales |
4,988 |
5,234 |
5,455 |
5,460 |
5,093 |
5,437 |
5,782 |
6,355 |
6,098 |
7,400 |
7,747 |
7,932 |
8,372 |
9,190 |
Cost of sales |
3,772 |
3,830 |
3,949 |
3,953 |
3,819 |
4,002 |
4,001 |
4,700 |
4,271 |
5,290 |
5,579 |
5,645 |
5,899 |
6,478 |
Gross profit |
1,216 |
1,403 |
1,506 |
1,507 |
1,273 |
1,437 |
1,781 |
1,655 |
1,827 |
2,109 |
2,167 |
2,287 |
2,472 |
2,713 |
SG&A expenses |
1.026 |
1,074 |
958 |
959 |
1,115 |
1,067 |
1,126 |
1,150 |
1,191 |
1,375 |
1,414 |
1,709 |
1,832 |
1,970 |
Operating profit |
189 |
328 |
547 |
327 |
158 |
369 |
655 |
725 |
636 |
733 |
753 |
577 |
639 |
742 |
Non-operating income |
3 |
2 |
1 |
1 |
38 |
10 |
24 |
5 |
38 |
31 |
12 |
30 |
5 |
1 |
Non-operating expenses |
3 |
7 |
7 |
7 |
2 |
3 |
4 |
10 |
4 |
4 |
5 |
21 |
7 |
5 |
Ordinary profit |
189 |
323 |
542 |
542 |
194 |
376 |
675 |
720 |
670 |
760 |
759 |
587 |
637 |
889 |
Extraordinary income |
0 |
0 |
0 |
19 |
32 |
|
13 |
66 |
1 |
1 |
– |
– |
||
Extraordinary expenses |
0 |
0 |
75 |
82 |
13 |
16 |
415 |
2 |
42 |
32 |
35 |
– |
– |
|
Net profit before income taxes |
189 |
323 |
542 |
240 |
113 |
381 |
691 |
318 |
681 |
785 |
730 |
552 |
637 |
882 |
Total income taxes |
77 |
159 |
162 |
99 |
38 |
122 |
224 |
145 |
189 |
281 |
233 |
38 |
201 |
306 |
Net profit attributable to owners of the parent |
112 |
165 |
375 |
139 |
99 |
256 |
438 |
180 |
487 |
429 |
445 |
417 |
416 |
533 |
[Balance Sheets] |
||||||||||||||
Current assets |
6,717 |
7,574 |
7,710 |
7,453 |
6,648 |
7,291 |
8,017 |
9,744 |
9,604 |
9,848 |
10,658 |
10,392 |
10,874 |
12,182 |
Cash and deposits |
3,650 |
3,849 |
3,882 |
3,739 |
3,027 |
3,482 |
4,085 |
5,076 |
4,911 |
5,435 |
5,746 |
5,208 |
5,573 |
6,850 |
Notes and accounts receivable |
2,677 |
3,017 |
3,013 |
2,985 |
2,889 |
3,099 |
3,201 |
4,097 |
||||||
Notes, accounts receivable andcontract assets |
4,161 |
3,872 |
4,372 |
4,411 |
4,614 |
4,672 |
||||||||
Non-current assets |
2,481 |
3,252 |
3,227 |
3,184 |
3,205 |
3,167 |
3,160 |
4,593 |
6,321 |
6,178 |
6,342 |
7,172 |
8,158 |
8,505 |
Tangible fixed assets |
545 |
646 |
627 |
579 |
560 |
549 |
565 |
598 |
602 |
623 |
621 |
693 |
1,067 |
1,077 |
Intangible fixed assets |
793 |
1,404 |
1,390 |
1,379 |
1,445 |
1,424 |
1,433 |
2,670 |
4,389 |
4,244 |
4,225 |
5,094 |
5,206 |
5,750 |
Goodwill |
491 |
1,066 |
1,033 |
1,027 |
1,032 |
991 |
950 |
2,467 |
4,175 |
4,042 |
3,945 |
4,763 |
4,812 |
5,301 |
Investments and other assets |
1,142 |
1,202 |
1,209 |
1,225 |
1,199 |
1,193 |
1,161 |
1,324 |
1,330 |
1,309 |
1,495 |
1,384 |
1,883 |
1,678 |
Total assets |
9,199 |
10,827 |
10,938 |
10,637 |
9,854 |
10,459 |
11,177 |
14,338 |
15,925 |
16,026 |
17,001 |
17,565 |
19,033 |
20,688 |
Current liabilities |
3,621 |
4,679 |
4,863 |
5,135 |
4,450 |
4,655 |
5,061 |
7,904 |
8,954 |
8,775 |
9,354 |
9,679 |
10,759 |
11,330 |
Short-term borrowings |
1,704 |
2,504 |
2,506 |
2,546 |
2,546 |
2,551 |
2,552 |
4,728 |
5,534 |
5,406 |
5,406 |
5,421 |
6,806 |
– |
Non-current liabilities |
622 |
624 |
629 |
63 |
62 |
132 |
135 |
119 |
294 |
55 |
58 |
309 |
162 |
154 |
Long-term debt |
48 |
46 |
48 |
– |
– |
66 |
65 |
63 |
236 |
– |
– |
169 |
– |
– |
Total liabilities |
4,243 |
5,304 |
5,493 |
5,198 |
4,513 |
4,788 |
5,196 |
8,024 |
9,249 |
8,830 |
9,413 |
9,989 |
10,921 |
11,485 |
Total net assets |
4,955 |
5,523 |
5,445 |
5,438 |
5,340 |
5,670 |
5,980 |
6,314 |
6,677 |
7,196 |
7,588 |
7,576 |
8,111 |
9,202 |
Shareholders’ equity |
4,734 |
5,039 |
4,919 |
4,898 |
4,841 |
5,172 |
5,460 |
5,642 |
5,983 |
6,436 |
6,719 |
6,776 |
7,030 |
7,779 |
Capital |
300 |
300 |
300 |
300 |
300 |
300 |
300 |
300 |
300 |
300 |
300 |
300 |
300 |
300 |
Legal capital reserve |
366 |
357 |
357 |
355 |
355 |
331 |
331 |
331 |
331 |
338 |
338 |
– |
– |
60 |
Retained earnings |
6,378 |
6,543 |
6,765 |
6,904 |
6,848 |
7,105 |
7,393 |
7,575 |
7,916 |
8,342 |
8,626 |
9,021 |
9,275 |
9,809 |
Treasury shares |
-2,311 |
-2,162 |
-2,503 |
-2,662 |
-2,662 |
-2,565 |
-2,565 |
-2,565 |
-2,565 |
-2,545 |
-2,546 |
-2,545 |
-2,545 |
-2,391 |
Stock acquisition right |
13 |
13 |
13 |
13 |
13 |
13 |
13 |
13 |
– |
– |
– |
– |
– |
10 |
Total liabilities and net assets |
9,199 |
10,827 |
10,938 |
10,637 |
9,854 |
10,459 |
11,177 |
14,338 |
15,925 |
16,026 |
17,001 |
17,565 |
19,033 |
20,688 |
[Statements of cash flows] |
||||||||||||||
Cash flow from operating activities |
-5 |
1,086 |
101 |
1,416 |
1,703 |
3,077 |
1,430 |
|||||||
Net profit before tax and otheradjustments |
513 |
1,296 |
494 |
1,504 |
1,466 |
2,749 |
1,520 |
|||||||
Cash flow from investing activities |
-963 |
1,018 |
-261 |
-1,813 |
-1,682 |
-2,537 |
-1,496 |
|||||||
Cash flow from financing activities |
|
637 |
|
-515 |
|
-90 |
|
1,730 |
|
316 |
-546 |
1,488 |
||
Free cash flow |
958 |
68 |
362 |
3,229 |
3,385 |
5,614 |
2,926 |
|||||||
Cash and cash equivalents at end of period |
-347 |
-458 |
-252 |
1,341 |
359 |
132 |
1,676 |
|||||||
Cash and cash equivalents at beginning of period |
4,162 |
4,162 |
3,704 |
3,704 |
5,041 |
5.041 |
5,173 |
|||||||
Cash and cash equivalents at end of period |
3,814 |
3,704 |
3,447 |
5,041 |
5,400 |
5,173 |
6,850 |
Source: Omega Investment, based on company data.