2026-07-15
Home
Japanese

Omega Investment Co., Ltd.
Itoki (Company Note – 3Q update)
| Share price (12/26) | ¥601 | Dividend Yield (22/12 CE) | 2.49 % |
| 52weeks high/low | ¥619/327 | ROE(TTM) | 7.77 % |
| Avg Vol (3 month) | 168.9 thou shrs | Operating margin (TTM) | 4.06 % |
| Market Cap | ¥27.44 bn | Beta (5Y Monthly) | 0.90 |
| Enterprise Value | ¥29.03 bn | Shares Outstanding | 45.664 mn shrs |
| PER (22/12 CE) | 5.44 X | Listed market | TSE Prime section |
| PBR (21/12 act) | 0.57 X |
| Click here for the PDF version of this page |
| PDF Version |
The company has revised up its full-year forecasts for FY12/2022, proposing a new office with the Smart Office Concept.
◇ The full-year forecasts for FY12/2022 were raised, with operating profit close to a record high.
On 23 December, Itoki announced the booking of an extraordinary profit following the transfer of fixed assets and an extraordinary loss due to the removal of fixed assets. The company also revised its full-year forecasts for FY12/2022. The extraordinary profit recorded was 6,500 million yen, while the extraordinary loss was 1,377 million yen. As a result, the sales estimate for FY2022 is unchanged from the previous guidance, but operating profit will be better by 200 million or +5%, recurring profit by 100 million yen or +2.5% and net profit attributable to owners of the parent by 2,300 million yen or +85.2% compared to the previous forecasts. However, recurring profit has already achieved the revised estimate at the end of 3Q and could further come in on the upside.
The company’s 3Q results for FY2022 are shown in the table below: sales grew by 7% yoy and operating profit by 1.4 times. By segment, the mainstay Workplace-related businesses posted sales of 63.2 billion yen (+5.1% yoy) and an operating profit of 2.4 billion yen (+66.7%), while Equipment / Public Business-related businesses performed well with sales of 25.4 billion yen (+13.0%) and operating profit of 1.2 billion (+135.3%). Both segments succeeded in winning orders for large projects. Despite the impact of higher raw material prices, this made a significant contribution to performance due to increased revenues and improved margins thanks to the increased value provided.
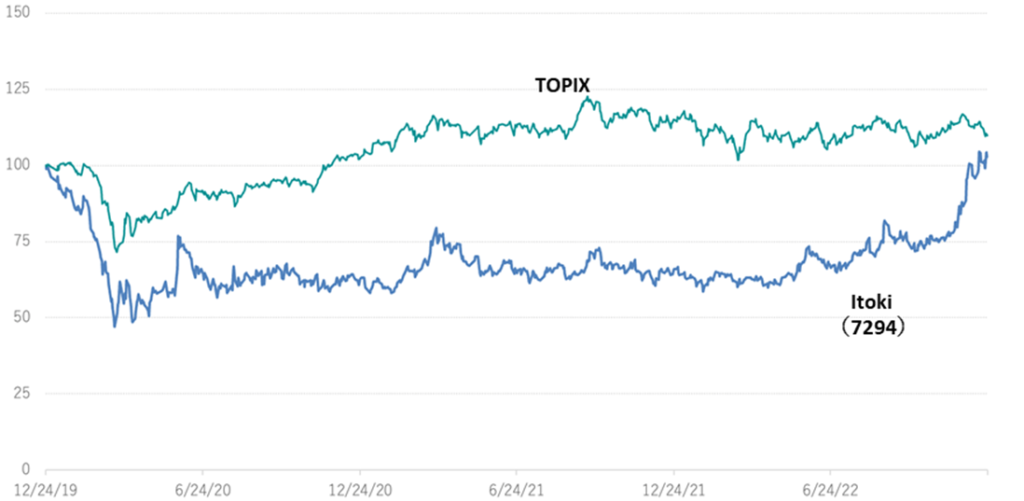
◇ Share price trend: Up 60.7% YTD, backed by robust business performance. The share price performance stands out amongst those of the peers.
The company’s share price has risen 60.7% since the beginning of the year. This compares very favourably to a performance of -16.1% to 10.0% for its peers over the same period. This is attributable to the robust demand for office furniture and the company’s ability to secure high profit margins through a more proposal-oriented sales approach in response to new office demand.
However, the company’s shares are as yet undervalued vis-a-vis its peers trading on PBR in the region of 0.5 times, despite improving trends (see chart below). The five-year average operating profit margin was 1.8%, which compares to 5.6% for Kokuyo (7984), 5.5% for Okamura (7994) and 3.0% for Uchida Yoko (8057) and indicates that the company was inferior to competitors in terms of profitability. In addition, its sales per employee were only half to two-thirds of the peers’, suggesting that it also needed to improve its productivity. While the company’s office furniture was highly acclaimed for its design, it was not fully reflected in the added value, as illustrated by these statistics.
The company advocates the Smart Office Concept, which aims to realise a new post-pandemic disease way of working through a fusion of technology and design. It seeks to create a new business model by realising office DX. If this strategy contributes to earnings, the company’s share price should be revalued further.
| JPY, mn, % | Net sales | YoY % |
Oper. profit |
YoY % |
Ord. profit |
YoY % |
Profit ATOP |
YoY % |
EPS (¥) |
DPS (¥) |
| 2019/12 | 122,174 | 2.9 | 903 | -53.1 | 945 | -60.1 | -550 | – | -12.08 | 13.00 |
| 2020/12 | 116,210 | -4.9 | 1,798 | 99.1 | 1,881 | 99.0 | -235 | – | -5.18 | 13.00 |
| 2021/12 | 115,839 | -0.3 | 2,536 | 41.0 | 2,437 | 29.5 | 1,166 | – | 25.82 | 15.00 |
| 2022/12 (old CE) | 123,000 | 6.1 | 4,000 | 56.2 | 4,000 | 64.1 | 2,700 | 131.4 | 59.63 | 15.00 |
| 2022/12 (new CE) | 123,000 | 6.1 | 4,200 | 65.6 | 4,100 | 68.2 | 5,000 | 328.8 | 110.42 | 15.00 |
| 2021/12 3Q | 84,047 | -2.5 | 1,731 | 140.7 | 1,651 | 123.4 | 850 | – | 18.82 | – |
| 2022/12 3Q | 89,961 | 7.0 | 4,086 | 136.0 | 4,125 | 149.8 | 3,517 | 313.8 | 77.73 | – |
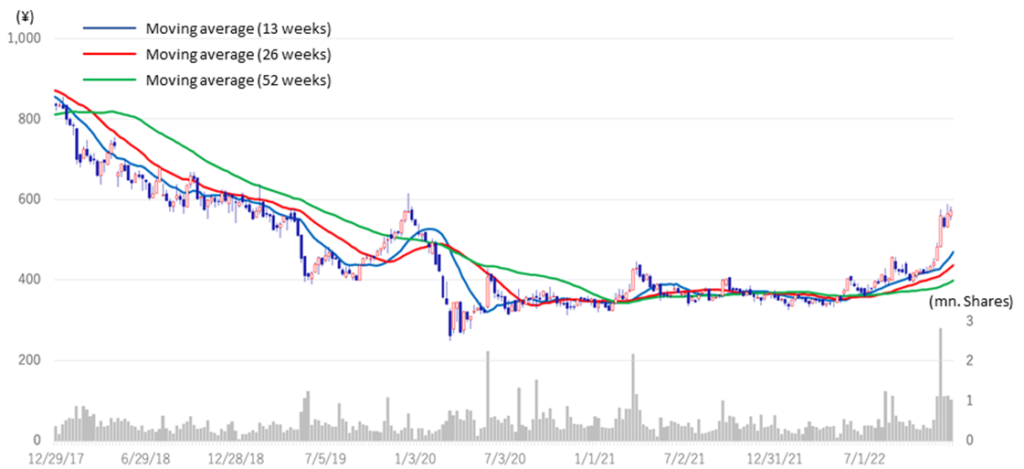
5-year stock price move
Share price compared to TOPIX (last three years)
7972: Historical PBR of Itoki and the three competitors (LTM, past five years)

Financial data (full-year basis)
| FY (¥mn) | 2012/12 | 2013/12 | 2014/12 | 2015/12 | 2016/12 | 2017/12 | 2018/12 | 2019/12 | 2020/12 | 2021/12 | 2022/9 |
| [Statements of income] | |||||||||||
| Net sales | 105,508 | 103,461 | 102,993 | 106,516 | 101,684 | 108,684 | 118,700 | 122,174 | 116,210 | 115,839 | 121,832 |
| Year-on-year basis (%) | 14.6 | -1.9 | -0.5 | 3.4 | -4.5 | 6.9 | 9.2 | 2.9 | -4.9 | -0.3 | 6.9 |
| Cost of sales | 70,027 | 67,118 | 66,797 | 68,374 | 65,021 | 69,966 | 77,436 | 80,495 | 74,322 | 74,145 | 77,063 |
| Gross profit | 35,481 | 36,343 | 36,196 | 38,142 | 36,663 | 38,718 | 41,264 | 41,679 | 41,888 | 41,694 | 44,769 |
| Gross profit ratio (%) | 33.6 | 35.1 | 35.1 | 35.8 | 36.1 | 35.6 | 34.8 | 34.1 | 36.0 | 36.0 | 36.7 |
| SG&A expenses | 32,040 | 32,203 | 33,723 | 33,836 | 33,862 | 35,761 | 39,339 | 40,776 | 40,089 | 39,158 | 39,833 |
| Operating income | 3,441 | 4,140 | 2,472 | 4,306 | 2,800 | 2,956 | 1,925 | 903 | 1,798 | 2,536 | 4,935 |
| Operating profit ratio (%) | 3.3 | 4.0 | 2.4 | 4.0 | 2.8 | 2.7 | 1.6 | 0.7 | 1.5 | 2.2 | 4.1 |
| Non-operating income | 813 | 813 | 841 | 898 | 771 | 750 | 889 | 677 | 804 | 694 | 582 |
| Non-operating expenses | 518 | 528 | 495 | 605 | 483 | 412 | 448 | 634 | 720 | 793 | 607 |
| Ordinary income | 3,735 | 4,425 | 2,818 | 4,599 | 3,087 | 3,295 | 2,365 | 945 | 1,881 | 2,437 | 4,911 |
| Extraordinary income | 269 | 685 | 615 | 171 | 97 | 228 | 919 | 27 | 1,111 | 1,554 | 1,131 |
| Extraordinary expenses | 352 | 238 | 262 | 524 | 267 | 121 | 204 | 35 | 1,716 | 2,468 | 1,620 |
| Income before income taxes | 3,653 | 4,872 | 3,171 | 4,246 | 2,918 | 3,401 | 3,081 | 938 | 1,277 | 1,523 | 4,421 |
| Total income taxes | 689 | 876 | 813 | -385 | 1,068 | 959 | 1,339 | 1,517 | 1,632 | 590 | 810 |
| Net income | 2,702 | 3,910 | 2,160 | 4,530 | 1,907 | 2,402 | 1,722 | -550 | -235 | 1,166 | 3,833 |
| Net income ratio (%) | 2.6 | 3.8 | 2.1 | 4.3 | 1.9 | 2.2 | 1.5 | -0.5 | -0.2 | 1.0 | 3.1 |
| [Balance Sheets] | |||||||||||
| Current assets | 49,294 | 52,925 | 55,714 | 56,342 | 52,410 | 58,147 | 62,143 | 58,109 | 57,183 | 57,753 | 59,873 |
| Cash and deposits | 17,441 | 19,553 | 21,211 | 21,456 | 19,839 | 19,977 | 16,229 | 17,030 | 18,246 | 17,351 | 17,138 |
| Notes and accounts receivable - trade |
24,935 | 26,234 | 25,965 | 26,138 | 23,241 | 26,869 | 33,160 | 28,244 | 26,599 | 26,783 | – |
| Notes and accounts receivable - trade, and contract assets |
– | – | – | – | – | – | – | – | – | – | 24,111 |
| Non-current assets | 39,961 | 42,335 | 41,007 | 41,832 | 43,271 | 44,073 | 46,559 | 49,955 | 47,912 | 46,144 | 48,126 |
| Property, plant and equipment | 27,928 | 28,193 | 27,041 | 26,395 | 25,322 | 24,426 | 26,362 | 27,781 | 26,206 | 24,417 | 26,932 |
| Intangible assets | 705 | 1,230 | 1,109 | 1,313 | 1,142 | 3,651 | 4,437 | 4,945 | 5,590 | 4,114 | 4,145 |
| Goodwill | 6 | 34 | 26 | 240 | 208 | 2,793 | 3,005 | 2,413 | 2,093 | 1,317 | 1,200 |
| Investments and other assets | 11,327 | 12,911 | 12,857 | 14,123 | 16,806 | 15,995 | 15,760 | 17,229 | 16,116 | 17,612 | 17,048 |
| Total assets | 89,256 | 95,261 | 96,721 | 98,175 | 95,681 | 102,221 | 108,703 | 108,778 | 105,096 | 103,898 | 108,000 |
| Current liabilities | 36,455 | 35,359 | 36,677 | 36,106 | 35,390 | 39,683 | 45,133 | 47,559 | 43,646 | 42,544 | 43,655 |
| Short-term borrowings | 8,272 | 8,257 | 8,432 | 8,496 | 9,458 | 9,604 | 9,230 | 12,769 | 10,055 | 9,682 | 10,009 |
| Non-current liabilities | 14,560 | 16,874 | 16,854 | 14,756 | 14,888 | 15,211 | 16,076 | 15,385 | 17,259 | 16,277 | 16,178 |
| Long-term borrowings | 3,816 | 4,456 | 4,447 | 4,708 | 4,963 | 5,074 | 4,933 | 6,493 | 8,408 | 7,531 | 7,266 |
| Total liabilities | 51,016 | 52,234 | 53,532 | 50,863 | 50,278 | 54,894 | 61,210 | 62,944 | 60,906 | 58,822 | 59,833 |
| Total net assets | 38,240 | 43,026 | 43,189 | 47,311 | 45,402 | 47,326 | 47,492 | 45,834 | 44,189 | 45,076 | 48,166 |
| Shareholders’ equity | 35,640 | 39,578 | 41,061 | 44,723 | 44,222 | 45,296 | 46,168 | 44,311 | 43,691 | 44,301 | 47,408 |
| Share capital | 5,277 | 5,277 | 5,277 | 5,277 | 5,277 | 5,277 | 5,277 | 5,294 | 5,294 | 5,294 | 5,294 |
| Capital surplus | 13,020 | 13,061 | 13,061 | 13,222 | 13,140 | 12,404 | 9,786 | 9,201 | 9,628 | 9,638 | 9,638 |
| Retained earnings | 18,520 | 22,073 | 23,556 | 29,223 | 30,504 | 32,315 | 31,104 | 29,862 | 28,950 | 29,530 | 32,610 |
| Treasury shares | -1,178 | -833 | -834 | -3,000 | -4,700 | -4,701 | 0 | -46 | -182 | -161 | -134 |
| Share acquisition rights | 45 | 45 | 45 | ||||||||
| Total liabilities and net assets | 89,256 | 95,261 | 96,721 | 98,175 | 95,681 | 102,221 | 108,703 | 108,778 | 105,096 | 103,898 | 108,000 |
| [Statements of cash flows] | |||||||||||
| Cash flow from operating activities | 8,259 | 3,162 | 5,715 | 4,522 | 5,072 | 3,565 | 1,384 | 3,586 | 4,561 | 2,774 | – |
| Income before income taxes | 3,653 | 4,872 | 3,171 | 4,246 | 2,918 | 3,401 | 3,081 | 938 | 1,277 | 1,523 | – |
| Cash flow from investing activities | -14 | -1,978 | -1,742 | -803 | -4,044 | -2,971 | -3,094 | -3,221 | -1,152 | -1,170 | – |
| Cash flow from financing activities | -1,652 | 51 | -2,179 | -3,807 | -2,571 | -706 | -2,463 | 0 | -2,267 | -2,658 | – |
| Free cash flow | 8,245 | 1,184 | 3,973 | 3,719 | 1,028 | 594 | -1,710 | 365 | 3,409 | 1,604 | – |
| Net increase in cash and cash equiv. | 6,601 | 1,944 | 1,814 | 184 | -1,619 | 88 | -4,031 | 952 | 1,203 | -900 | – |
| Cash and cash equiv. at beginning of period |
9,555 | 16,156 | 18,102 | 19,918 | 20,103 | 18,483 | 18,571 | 14,540 | 15,494 | 16,697 | – |
| Cash and cash equiv. at end of period | 16,156 | 18,102 | 19,918 | 20,103 | 18,483 | 18,571 | 14,540 | 15,494 | 16,697 | 15,797 | – |
Note: PL for FY9/2022 is calculated on an LTM basis.
Source: Omega Investment from Company materials.