2026-07-15
Home
Japanese

Omega Investment Co., Ltd.
Sansei Landic (Company Note 3Q update)

| Share price (12/16) | ¥851 | Dividend Yield (22/12 CE) | 3.17 % |
| 52weeks high/low | ¥921/787 | ROE(TTM) | 9.19 % |
| Avg Vol (3 month) | 11.4 thou shrs | Operating margin (22/6) | 8.66 % |
| Market Cap | ¥7.22 bn | Beta (5Y Monthly) | 0.62 |
| Enterprise Value | ¥14.69 bn | Shares Outstanding | 8.485 mn shrs |
| PER (22/12 CE) | 6.59 X | Listed market | TSE Standard |
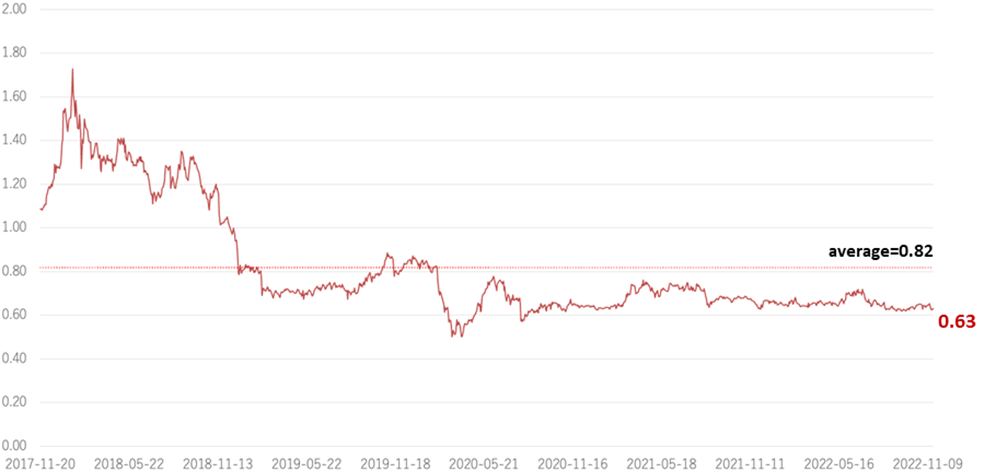
| PBR (21/12 act) | 0.64 X |
| Click here for the PDF version of this page |
| PDF Version |
Sales and profits both ahead of guidance.
Purchasing increased significantly, with inventories of real estate for sale amounting to 20.7 billion yen.
◇Sales undercut the target, but profits overachieved. Inventories reached a record high.
In the 3Q results for FY12/2022, sales of Sansei Landic fell by approximately 15% yoy but progressed better than planned. Sales of Leasehold land declined, but both Old unutilised properties and Freehold increased. Profits exceeded the plan for both Leasehold land and Old unutilised properties. Operating profit increased by 17%. On the other hand, the volume of purchases grew significantly in 3Q, with real estate for sale at the end of 3Q at an unprecedented level of 20.7 billion yen, so the earnings should increase in the next fiscal year and the following years. 3Q progress ratios were 66% for sales and 86% for operating profit versus the guidance. The company should comfortably achieve its full-year targets with 4Q earnings kicking in. The share price remains undervalued in light of the current solid business progress.
◇ 3Q FY12/2022 results: Purchases increase significantly, with real estate for sale amounting to 20.7 billion yen.
Sales were 11,261 million yen, declining 14.7% yoy. This was because the sales of leasehold land in 3Q last year were large. Sales were ahead of the company plan by 294 million yen. Profit margins for both Leasehold land and Old unutilised land were better than forecast. Operating profit registered 1.2 billion yen, rising 16.8% yoy, thanks to the solid property market and cost reductions and sales efforts.
On a three-month basis, 3Q sales were 3,095 million yen, down 24.3% yoy, while operating profit fell by 286 million yen or 15.1%. On the other hand, the operating profit margin improved by 1 pt to 9.3%.
Since the spread of COVID-19 at the beginning of 2020, the sales activities of the real estate industry, primarily a face-to-face sales business, have been severe. The company has implemented several infection control measures, including introducing a remote working system, and is now almost back to normal operating conditions. As a result, the number of deals has increased to levels exceeding those before the infection. The company’s purchases and inventories have also increased significantly, as discussed below.
The spread of COVID-19 has affected some office buildings and commercial real estate, with the introduction of remote working and curtailed outings. Still, the impact on the company’s business areas, such as Leasehold land and Old unutilised properties, has been minor. Demand has remained robust due to the strength of the property market, and sales prices are rising.
In BS, real estate for sale increased significantly due to higher-than-expected progress in purchasing. It increased by 7,474 million yen to 20,775 million yen from the end of the previous fiscal year. Interest-bearing debt increased by 4,649 million yen to 12,757 million yen due to significantly higher purchases. As a result, total assets increased by 7,457 million yen to 27,508 million yen. As liabilities increased, the equity ratio fell by 11.8 percentage points to 39.6%.
| JPY, mn | Net sales | YoY % |
Oper. profit |
YoY % |
Ord. profit |
YoY % |
Profit ATOP |
YoY % |
EPS (¥) |
DPS (¥) |
| 2019/12 | 18,020 | 7.1 | 1,860 | 5.4 | 1,758 | 7.0 | 1,158 | 15.1 | 137.08 | 23.00 |
| 2020/12 | 17,774 | -1.4 | 847 | -54.5 | 709 | -59.7 | 357 | -69.1 | 42.34 | 25.00 |
| 2021/12 | 16,836 | -5.3 | 1,117 | 31.9 | 999 | 40.9 | 609 | 70.5 | 73.56 | 26.00 |
| 2022/12 (CE) | 17,103 | 1.6 | 1,402 | 25.5 | 1,226 | 22.7 | 1,058 | 73.7 | 128.40 | 27.00 |
| 2021/12 3Q | 13,198 | 21.8 | 1,027 | 287.4 | 943 | 519.8 | 547 | 492.4 | 66.02 | – |
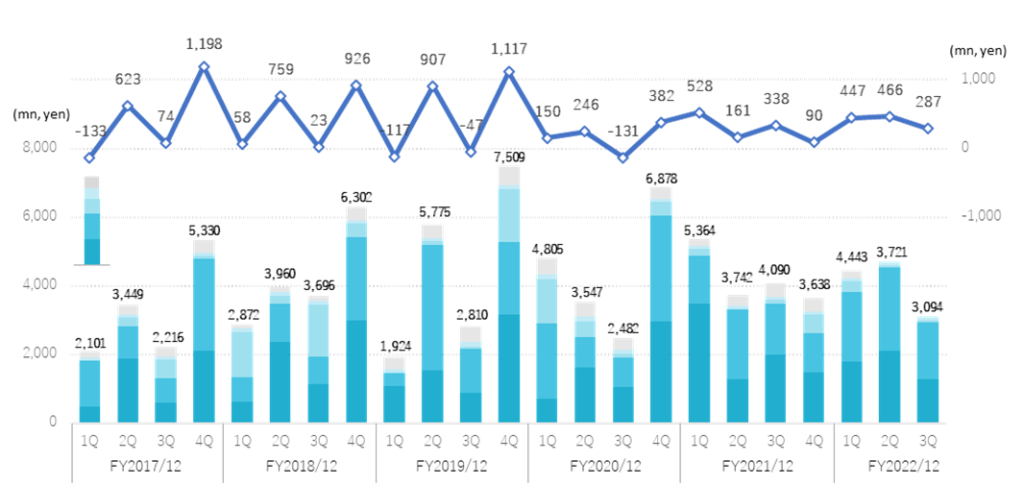
| 2022/12 3Q | 11,261 | -14.7 | 1,200 | 16.8 | 1,071 | 13.7 | 909 | 65.9 | 110.94 | – |
Quarterly sales and operating profit
- Segment trends
Sales of Real estate sales segment amounted to 11,039 million yen (-10.1%). Progress was mainly in line with plans for Leasehold, Old unutilised properties and Freehold. A yoy drop is due to the significant sales of leasehold land in the same period of the previous year. Segment profit increased by 2,200 million yen or +10.7%. Profit margins improved significantly due to sales and cost-cutting efforts in both Leasehold land and Old unutilised properties.
Leasehold land: sales of 4,871 million yen (-27.7%). Sales declined as the previous year’s results included large properties with a mix of Old unutilised properties. Versus the company plan, sales were higher by 1.0%. While sales were in line with the forecast, profit margins were higher than expected, and profits exceeded the plan.
Old unutilised properties: sales of 5,229 million yen (+6.0%). Sales were 4.3% above the plan. Both profits and profit margins were higher yoy and exceeded the plan. Sales were robust in both the Tokyo metropolitan and western Japan regions.
Freehold: 630 million yen (+86.4%). Both sales and profits were largely in line with plans. As sales were low in the same period of the previous year, sales grew significantly yoy. Sales exceeded the company plan by 2.0%.
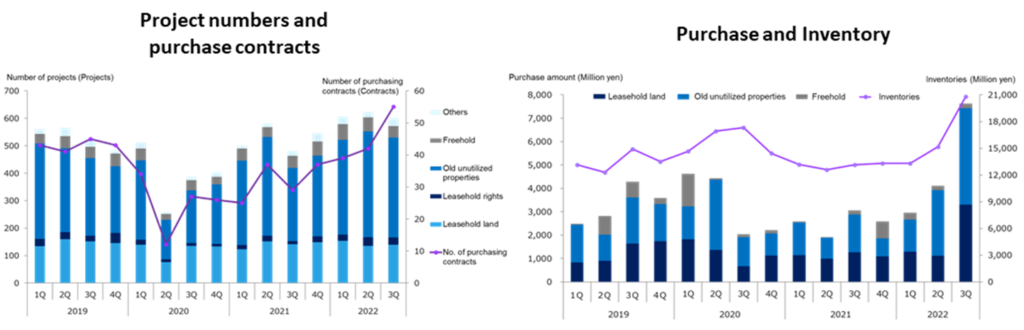
- Purchasing: progressed well above plan, with real estate inventories for sale amounting to 20.7 billion yen.
Purchases in the Real estate for sale business rose sharply by 94.8% yoy to 14,694 million yen (vs 7,544 million yen in 3Q FY2021). The breakdown is Leasehold land: 5.7 billion yen (+68.2%), Old unutilised land: 8.314billion yen (+112.4%), Freehold: 678 million yen (+182.5%), already achieving the annual purchase volume target of 13.4billion yen.
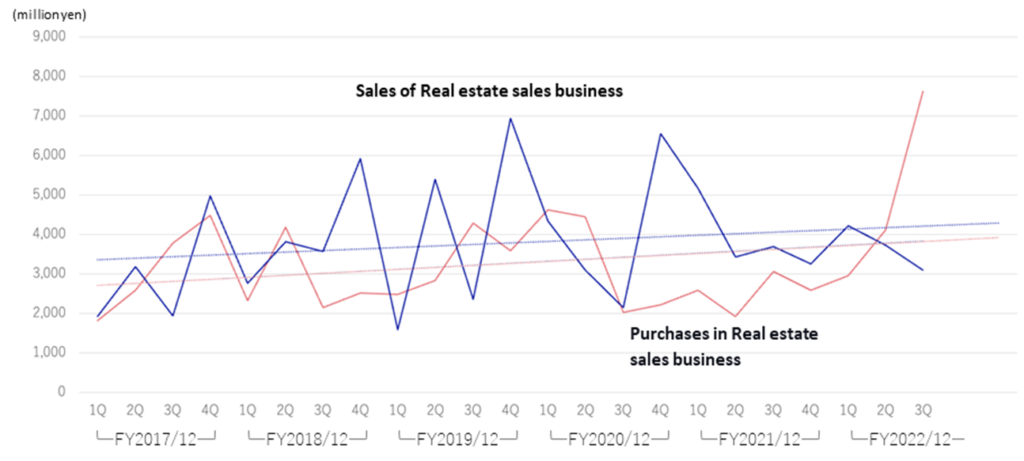
Real estate sales business sales and purchases (quarterly)
This is due to the following: 1) The robust property market. 2) The expansion of large properties that require a rights adjustment period of more than one year, managing the risks associated with market, property and so on. 3) The success of the strategic expansion of the business area has led to a significant increase in purchases.
A rapid increase in inventories raises concerns about whether the company can sell out and whether unsold items will become unprofitable stock. However, the company denies such concerns, as it continues to purchase cautiously and is increasing inventories with an eye on sales in the next financial year and beyond.
The above chart shows the trend of purchases and sales in the company’s property sales business. Before the spread of COVID-19, sales tended to increase in 2Q and 4Q and fall in 1Q and 3Q, but this has levelled off recently. Purchase volume remained low from 3Q FY2020 as sales activities stagnated due to COVID-19 but have recovered since entering FY12/2022. In particular, a significant increase in the current 3Q has ensured profit growth from the next financial year onwards.
◇ Forecast for full FY12/2022: No change in the forecast announced after 1Q results.
As of the end of 3Q, progress against the full-year guidance is 66% for sales, 86% for operating profit, 87% for recurring profit and 86% for net profit attributable to owners of the parent company. The company may well revise up its profit forecasts.
The company plans to pay a dividend of 27 yen a share for the performance of FY12/2022, the ninth consecutive year of dividend increases.
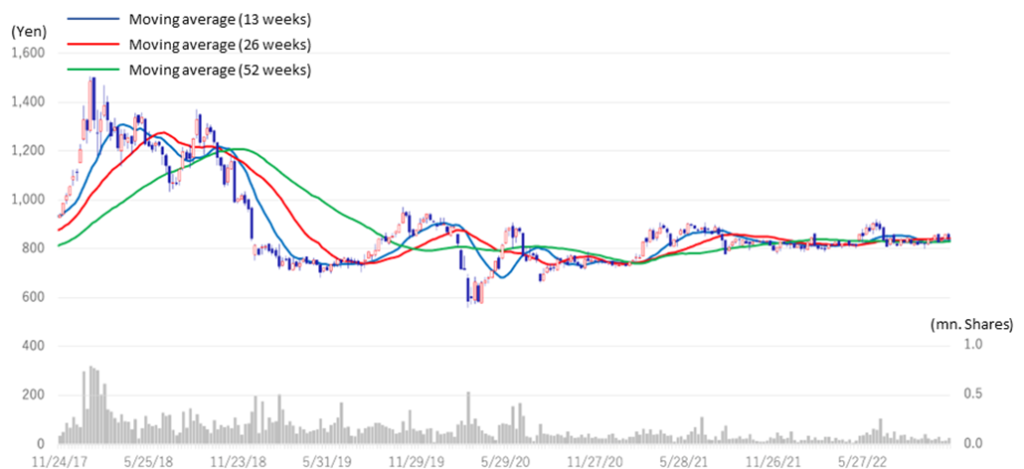
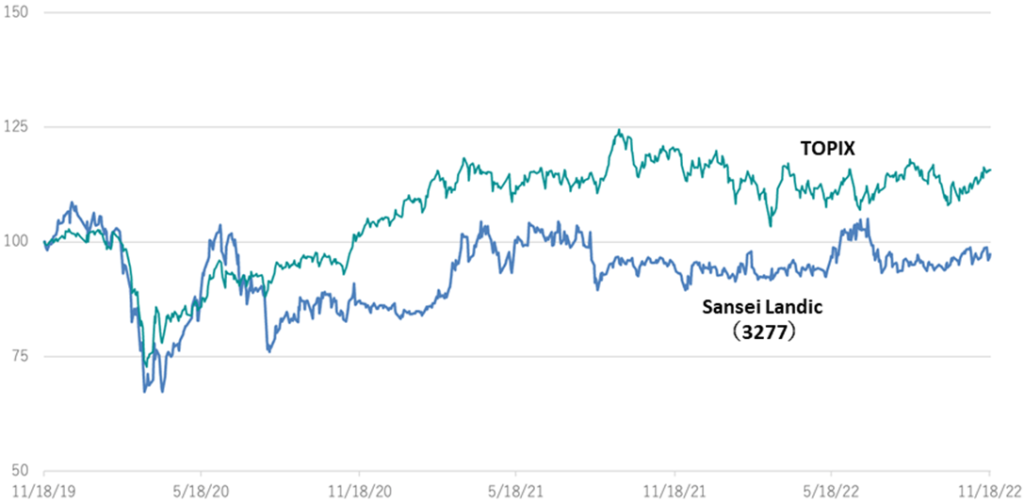
◇ Share price: remains undervalued given growth expectations for the next fiscal year and beyond.
The share price rose above 900 yen after the announcement of 1Q results but went down and bottomed out at 800 yen on 28 September, returning to the 850 yen level after the 3Q result announcement. From now on, the company’s earnings should return to a growth trajectory again, backed by the robust property market and the significant increase in purchases in the current 3Q. Given the solid business progress and the growth expectation for next year and the following years, the share price valuations suggest that the shares remain undervalued (see chart on next page).
5-year stock price move
Share price compared to TOPIX (last three years)
Historical PBR (last five years)
Financial data
| FY (¥mn) | 2019/12 | 2020/12 | 2021/12 | 2022/12 | |||||||||||
| 1Q | 2Q | 3Q | 4Q | 1Q | 2Q | 3Q | 4Q | 1Q | 2Q | 3Q | 4Q | 1Q | 2Q | 3Q | |
| [Sales by segment] | |||||||||||||||
| Net sales | 1,925 | 5,775 | 2,811 | 7,507 | 4,807 | 3,546 | 2,481 | 6,938 | 5,365 | 3,744 | 4,089 | 3,637 | 4,444 | 3,721 | 3,094 |
| Year-on-year basis | -33.0% | 45.8% | -23.9% | 15.0% | 149.7% | -38.6% | -11.7% | -7.6% | 11.6% | 5.6% | 64.8% | -47.6% | -17.2% | -0.6% | -15.9% |
| Real estate sales business | 1,576 | 5,396 | 2,353 | 6,941 | 4,339 | 3,092 | 2,137 | 6,543 | 5,171 | 3,434 | 3,679 | 3,244 | 4,222 | 3,721 | 3,094 |
| Year-on-year basis | -42.8% | 41.3% | -33.9% | 17.5% | 175.3% | -42.7% | -9.2% | -5.7% | 19.2% | 11.1% | 72.1% | -50.4% | -18.3% | 8.3% | -15.9% |
| Sales composition ratio | 81.9% | 93.4% | 83.7% | 92.5% | 90.3% | 87.2% | 86.2% | 94.3% | 96.4% | 91.7% | 90.0% | 89.2% | 95.0% | 100.0% | 100.0% |
| Leasehold land | 1,086 | 1,546 | 889 | 3,176 | 719 | 1,613 | 1,044 | 2,950 | 3,464 | 1,267 | 2,003 | 1,474 | 1,793 | 1,794 | 1,284 |
| Year-on-year basis | 77.7% | -34.2% | -21.5% | 6.1% | -33.8% | 4.3% | 17.4% | -7.1% | 381.4% | -21.5% | 91.9% | -50.0% | -48.2% | 41.6% | -35.9% |
| Sales composition ratio | 56.4% | 26.8% | 31.6% | 42.3% | 15.0% | 45.5% | 42.1% | 42.5% | 64.6% | 33.8% | 49.0% | 40.5% | 40.3% | 48.2% | 41.5% |
| Old unutilised properties | 351 | 3,657 | 1,283 | 2,108 | 2,180 | 897 | 872 | 3,101 | 1,419 | 2,025 | 1,488 | 1,151 | 2,024 | 1,556 | 1,649 |
| Year-on-year basis | -51.6% | 225.4% | 62.0% | -12.9% | 520.6% | -75.5% | -32.0% | -47.1% | -34.9% | 125.8% | 70.6% | -62.9% | 42.6% | -23.2% | 10.8% |
| Sales composition ratio | 18.2% | 63.3% | 45.6% | 28.1% | 45.4% | 25.3% | 35.1% | 44.7% | 26.4% | 54.1% | 36.4% | 31.6% | 45.5% | 41.8% | 53.3% |
| Freehold | 28 | 88 | 55 | 1,532 | 1,305 | 465 | 106 | 395 | 191 | 46 | 101 | 526 | 315 | 266 | 49 |
| Year-on-year basis | -97.9% | -60.4% | -96.4% | 290.8% | 4560.7% | 428.4% | 92.7% | -74.2% | -85.3% | -90.1% | -4.7% | 33.2% | 64.9% | 478.3% | -51.5% |
| Sales composition ratio | 1.5% | 1.5% | 2.0% | 20.4% | 27.1% | 13.1% | 4.3% | 5.7% | 3.6% | 1.2% | 2.5% | 14.5% | 7.1% | 7.1% | 1.6% |
| Others | 110 | 104 | 126 | 126 | 133 | 117 | 116 | 97 | 96 | 95 | 88 | 94 | 89 | 105 | 112 |
| Year-on-year basis | 11.1% | -14.8% | 5.0% | 21.2% | 21.5% | 12.5% | -7.9% | -23.0% | -28.3% | -18.8% | -24.1% | -3.1% | -7.3% | 10.5% | 27.3% |
| Sales composition ratio | 5.7% | 1.8% | 4.5% | 1.7% | 2.8% | 3.3% | 4.7% | 1.4% | 1.8% | 2.5% | 2.2% | 2.6% | 2.0% | 2.8% | 3.6% |
| Construction business | 349 | 379 | 457 | 566 | 468 | 455 | 343 | 395 | 194 | 309 | 409 | 392 | 222 | – | – |
| Year-on-year basis | 202.6% | 166.5% | 246.1% | 44.0% | 34.1% | 19.8% | -24.9% | -30.1% | -58.4% | -32.1% | 19.3% | -0.8% | 14.0% | – | – |
| Sales composition ratio | 18.1% | 6.6% | 16.3% | 7.5% | 9.7% | 12.8% | 13.8% | 5.7% | 3.6% | 8.3% | 10.0% | 10.8% | 5.0% | – | – |
| [Statements of income] | |||||||||||||||
| Net sales | 1,925 | 5,775 | 2,811 | 7,507 | 4,807 | 3,546 | 2,481 | 6,938 | 5,365 | 3,744 | 4,089 | 3,637 | 4,444 | 3,721 | 3,096 |
| Cost of sales | 1,346 | 4,014 | 2,076 | 5,466 | 3,865 | 2,557 | 1,934 | 5,431 | 4,020 | 2,756 | 2,945 | 2,745 | 3,146 | 2,310 | 1,963 |
| Gross profit | 579 | 1,762 | 736 | 2,042 | 942 | 989 | 548 | 1,507 | 1,344 | 986 | 1,143 | 892 | 1,297 | 1,411 | 1,132 |
| SG&A expenses | 696 | 855 | 783 | 924 | 792 | 744 | 678 | 925 | 816 | 826 | 805 | 802 | 850 | 946 | 845 |
| Operating income | -117 | 907 | -47 | 1,117 | 150 | 245 | -131 | 382 | 528 | 160 | 338 | 90 | 447 | 466 | 287 |
| Non-operating income | 4 | 28 | 5 | 5 | 9 | 5 | 51 | 5 | 12 | 8 | 8 | 6 | 7 | 7 | 6 |
| Non-operating expenses | 34 | 38 | 32 | 40 | 55 | 63 | 60 | 10 | 37 | 40 | 34 | 39 | 39 | 55 | 54 |
| Ordinary income | -147 | 898 | -75 | 1,083 | 103 | 188 | -140 | 298 | 502 | 128 | 311 | 56 | 415 | 417 | 239 |
| Extraordinary income | 0 | 0 | 0 | 0 | 0 | 0 | 0 | 3 | 0 | 0 | 0 | 19 | 0 | 0 | |
| Extraordinary expenses | 0 | 0 | 0 | 0 | 0 | 0 | 0 | 0 | 0 | 8 | |||||
| Loss before income taxes | -147 | 898 | -75 | 1,083 | 103 | 188 | -140 | 298 | 506 | 128 | 311 | 56 | 435 | 399 | 231 |
| Total income taxes | -35 | 312 | -26 | 349 | 36 | 72 | -49 | 295 | 183 | 48 | 166 | -4 | 59 | 60 | 36 |
| Net income | -112 | 585 | -48 | 734 | 67 | 114 | -90 | 176 | 323 | 79 | 145 | 61 | 375 | 338 | 196 |
| [Balance Sheets] | |||||||||||||||
| Current assets | 16,007 | 15,596 | 17,458 | 18,095 | 18,816 | 20,798 | 20,577 | 19,040 | 17,554 | 17,371 | 18,769 | 18,968 | 19.018 | 21,579 | 26379 |
| Property for sale | 13,129 | 12,290 | 14,890 | 13,493 | 14,655 | 16,923 | 17,312 | 14,424 | 13,493 | 12,586 | 13,134 | 13,301 | 13,304 | 15,152 | 20,775 |
| Non-current assets | 1,230 | 1,206 | 1,229 | 1,199 | 1,188 | 1,164 | 1,197 | 1,030 | 951 | 1,054 | 1,081 | 1,082 | 1,124 | 1,099 | 1,129 |
| Tangible assets | 469 | 471 | 462 | 456 | 451 | 449 | 443 | 306 | 291 | 290 | 293 | 301 | 317 | 313 | 314 |
| Investments and other assets | 694 | 666 | 689 | 669 | 668 | 653 | 691 | 655 | 595 | 703 | 732 | 730 | 761 | 743 | 769 |
| Total assets | 17,236 | 16,802 | 18,686 | 19,294 | 20,004 | 21,962 | 21,774 | 20,071 | 18,505 | 18,425 | 19,849 | 20,051 | 20,134 | 22,678 | 27,508 |
| Current liabilities | 6,904 | 6,996 | 9,135 | 9,047 | 9,883 | 7,767 | 7,699 | 5,772 | 5,517 | 7,540 | 8,633 | 8,731 | 8,153 | 8,871 | 11,168 |
| Short-term borrowings | 5,645 | 5,360 | 7,702 | 7,203 | 7,729 | 6,352 | 6,676 | 4,463 | 4,272 | 6,105 | 7,171 | 7,367 | 5,025 | 5,057 | 6,960 |
| Non-current liabilities | 1,714 | 602 | 389 | 351 | 345 | 4,303 | 4,274 | 4,232 | 2,919 | 792 | 976 | 1,017 | 1,525 | 3,114 | 5,453 |
| Long-Term Borrowings | 1,347 | 222 | 3,958 | 3,929 | 3,879 | 2,570 | 483 | 683 | 740 | 1,260 | 2,827 | 5,153 | |||
| Total liabilities | 8,618 | 7,598 | 9,524 | 9,399 | 10,228 | 12,071 | 11,973 | 10,004 | 8,436 | 8,332 | 9,609 | 9,749 | 9.679 | 11,968 | 16,622 |
| Total net assets | 8,618 | 9,204 | 9,162 | 9,895 | 9,776 | 9,891 | 9,801 | 10,067 | 10,070 | 10,093 | 10,240 | 10,301 | 10,463 | 10,692 | 10,886 |
| Total shareholders’ equity | 8,618 | 9,204 | 9,162 | 9,895 | 9,776 | 9,891 | 9,801 | 10,067 | 10,070 | 10,093 | 10,240 | 10,297 | 10,459 | 10,688 | 10,882 |
| Capital stock | 811 | 811 | 814 | 814 | 818 | 818 | 818 | 818 | 818 | 820 | 820 | 820 | 821 | 822 | 824 |
| Legal capital reserve | 772 | 772 | 775 | 775 | 779 | 779 | 779 | 779 | 779 | 781 | 781 | 781 | 782 | 785 | 786 |
| Retained earnings | 7,031 | 7,616 | 7,568 | 8,302 | 8,174 | 8,289 | 8,200 | 8,465 | 8,577 | 8,656 | 8,802 | 8,863 | 9,023 | 9,362 | 9,557 |
| Stock acquisition right | 4 | 4 | 4 | 4 | 4 | 4 | 4 | 4 | 4 | 4 | 4 | 4 | 4 | 3 | 3 |
| Total liabilities and net assets | 17,236 | 16,802 | 18,686 | 19,294 | 20,004 | 21,962 | 21,774 | 20,071 | 18,505 | 18,425 | 19,849 | 20,051 | 20,134 | 22,678 | 27,508 |
| [Statements of cash flows] | |||||||||||||||
| Cash flow from operating activities | -286 | -419 | -3,683 | -916 | 2,110 | 1,704 | 1,184 | ||||||||
| Loss before income taxes | 750 | 1,758 | 291 | 712 | 635 | 1,003 | 833 | ||||||||
| Cash flow from investing activities | -27 | -70 | -9 | -287 | -26 | -51 | -205 | ||||||||
| Cash flow from financing activities | -446 | 984 | 3,021 | 952 | -2,129 | -608 | -559 | ||||||||
| Net increase in cash and cash equiv. | -760 | 493 | -671 | -251 | -46 | 1,045 | 420 | ||||||||
| Cash and cash equiv. at beginning of period | 3,465 | 3,465 | 3,958 | 3,958 | 3,707 | 3,707 | 4,752 | ||||||||
| Cash and cash equiv. at end of period | 2,704 | 3,958 | 3,287 | 3,707 | 3,661 | 4,752 | 5,173 | ||||||||
Source: Omega Investment from Company materials.