2026-07-15
Home
Japanese

Omega Investment Co., Ltd.
Kidswell Bio (Company Note – 3Q update)

| Share price (2/10) | ¥280 | Dividend Yield (23/3 CE) | – % |
| 52weeks high/low | ¥483/200 | ROE(TTM) | -32.17 % |
| Avg Vol (3 month) | 576.6 thou shrs | Operating margin (TTM) | -58.57 % |
| Market Cap | ¥8.9 bn | Beta (5Y Monthly) | 1.13 |
| Enterprise Value | ¥9.5 bn | Shares Outstanding | 32.046 mn shrs |
| PER (23/3 CE) | – X | Listed market | TSE Growth |
| PBR (22/3 act) | 5.74 X |
| Click here for the PDF version of this page |
| PDF Version |
Sales of biosimilar GBS-007 are strong.
Also, the SHED project is progressing as planned.
◇Summary of 3Q results for FY2023/3
In the 3Q results for FY2023/3, Kidswell Bio’s biosimilar (BS) business, including GBS-007, performed well, recording sales of 1.72bn yen. Following the completion of Master Cell Bank (MCB) for SHED (Stem cell from Human Exfoliated Deciduous teeth) in 2Q, joint research with academia is steadily progressing towards practical applications. MCB is a crucial technological development for the company’s future business using SHED, and further acceleration of various development activities is expected. In 4Q, sales and R&D costs are expected to grow further, so the company has not changed its full-year forecast. However, there is likely to be an upward swing in profits (smaller losses).
In order to further expand its SHED (regenerative medicine) business, the company plans to invest aggressively in developing second-generation and first-generation SHED to further overseas development. From now on, financing for this will be on the agenda.
◇ A view on share price
The company’s share price has adjusted sharply since the full-year results announcement for FY2022/3 in May 2022. Although recovering slightly in November 2022, it has yet to recover to its previous level. As a result, the shares’ PBR remains at 5.22, below the three-year average (LTM) of 8.44x. In its new medium-term term strategic plan (KWB 2.0), the company plans to achieve sales of 3 billion yen and an operating profit of 1 billion yen in FY2025 by securing solid earnings from its BS business. At the same time, the company has stated its intention to accelerate business development with an eye on the global market through continued investment in SHED. As mentioned above, steady progress has been made in the first-generation SHED, with some products entering the clinical preparation stage. It will be interesting to see whether the share price will be revalued in light of this progress.
◇ Results for 3Q FY2023/3: Steady growth in sales of BS GBS-007
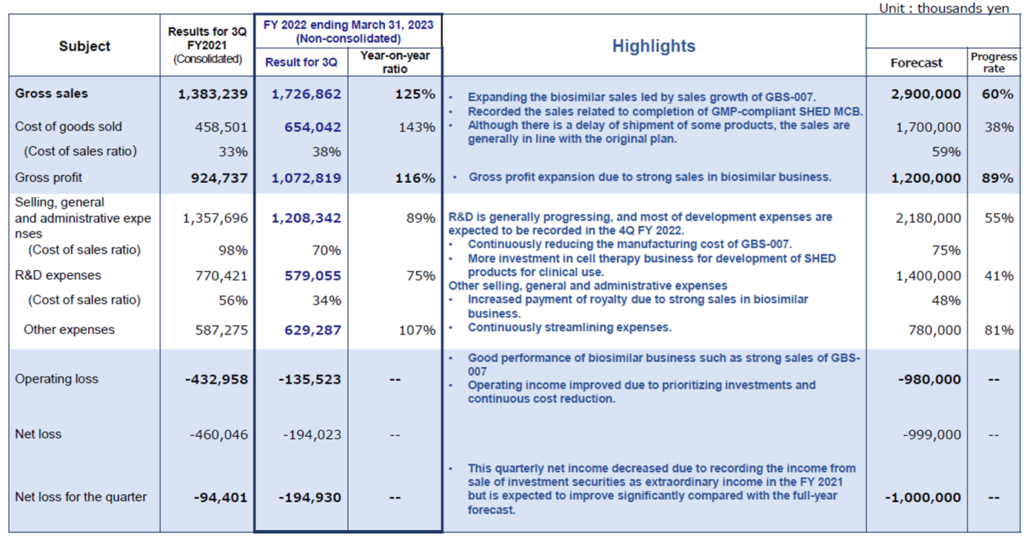
The company’s 3Q results for FY2023/3 showed sales of 1,726 million yen, an operating loss of 135 million yen and a net loss of 194 million yen. The company has shifted to non-consolidated reporting from the current term, so simple year-on-year comparisons are impossible (consolidated sales in 3Q FY2022/3 were 1,383 million). Still, profitability is steadily improving.
In terms of sales, the BS business, including the third BS product GBS-007, continued to perform well in 3Q. Although there were some timing delays in shipments of some products, progress was generally in line with plans. In 2Q, the company recorded sales from the completion of MCB and milestone revenues from the fourth BS product.
In terms of profit, the company recorded an operating profit of 11 million yen in 2Q, but this was the result of curbing R&D investment until the completion of the MCB, as noted in the previous year’s report. In 3Q, the increase in research and development costs resulted in an operating loss for the nine months, as described above. The operating loss has improved YoY due to a review of investment priorities and ongoing cost reductions.
| JPY, mn, % | Net sales |
YoY % |
Oper. profit |
YoY % |
Ord. profit |
YoY % |
Profit ATOP |
YoY % |
EPS (¥) |
| 2019/3 | 1,021 | -3.6 | -805 | – | -816 | – | -856 | – | -43.84 |
| 2020/3 | 1,077 | – | -1,161 | – | -1,187 | – | -7,316 | – | -264.65 |
| 2021/3 | 996 | -7.5 | -969 | – | -991 | – | -1,001 | – | -34.79 |
| 2022/3 | 1,569 | 57.7 | -919 | – | -952 | – | -535 | – | -17.35 |
| 2023/3 (CE) | 2,900 | – | -980 | – | -999 | – | -1,000 | – | -31.80 |
| 2022/3 3Q* | – | – | – | – | – | – | – | – | – |
| 2023/3 3Q | 1,726 | – | -135 | – | -194 | – | -194 | – | -6.18 |
* The company’s financial results are on a consolidated basis until FY2022/3; FY2023/3 is on a non-consolidated basis. Therefore, figures for the same period of the previous year and YoY comparisons are not shown.
Results for 3Q FY2023/3 (PL)
As previously reported, a bank loan of 1 billion yen was taken out at the end of June to secure working capital in line with the increase in sales of GBS-007. As a result of the interest paid (23 million yen) and commission paid (30 million yen), which were recorded as non-operating expenses, recurring profit resulted in a loss of 194 million yen.
On the balance sheet, cash and deposits at the end of 3Q stood at 1.49 billion yen due to the execution of bank loans and the issue of the 4th unsecured convertible bond with acquisition rights. Meanwhile, the corresponding non-current liabilities increased to 1.70 billion yen. As a result, total assets at the end of 3Q stood at 4.17 billion yen, an increase of 0.70 billion yen from the end of FY2022/3.
◆Cell therapy business (regenerative medicine): various collaborations have progressed with completing the SHED MCB
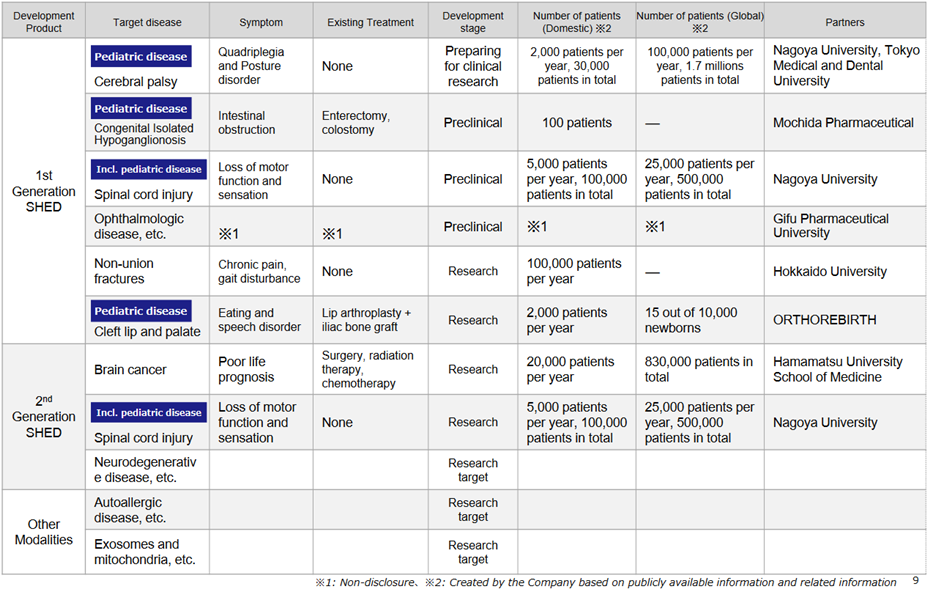
*Progress in the pipeline: see the figure above on the next page for the company’s cell therapy business pipeline.
In first-generation SHED, although the development status is at the non-clinical stage, collaboration with Nagoya University and other academia is progressing. In October 2022, the company filed a patent application jointly with Nagoya University for the treatment of cerebral palsy using SHED. On January 30, it was announced that the University’s Certified Special Committee for Regenerative Medicine had deliberated on the clinical research plan “Clinical trial to examine the safety and tolerability of a single administration of autologous SHED for children with cerebral palsy”, which was being carried out concerning this application, and that the committee had decided to continue the deliberations. This indicates progress in specific research results on first-generation SHEDs.
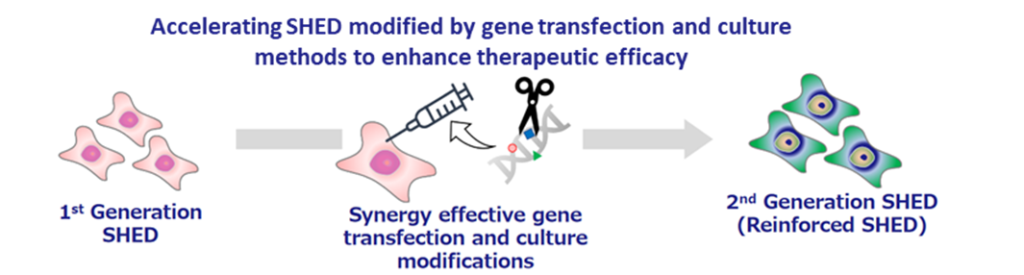
The development status of second-generation SHED is still in the research and exploratory phase, but the company continues to focus on it. As an example, in a joint research project with Hamamatsu University School of Medicine, it was confirmed that brain tumours disappeared after the administration of thymidine kinase-guided SHED. Second-generation SHED is positioned as a critical element in the company’s future overseas expansion, and the company intends to continue to focus on this area.
Second generation SHED: an image of development process for ‘designer cells’
Pipeline Highlights: Cell therapy business (Regenerative medicine)
The company is looking at creating other modalities based on the MCB-based system S-Quatre® as the next step in second-generation SHED. It is already in ongoing discussions with many potential partners for the application of SHED as a raw material for other modalities.
Business development of S-Quatre®: an image of the application of S-Quatre® in other modalities

◆Biosimilars business: strong sales of GBS-007 and approval for additional indications
*Ranibizumab (GBS-007): on December 9, 2021, the third product in the BS business, ranibizumab BS, an anti-VEGF antibody drug for age-related macular degeneration, was launched by development partner Senju Pharmaceutical. As the first BS in the ophthalmology field, this has attracted a lot of attention and sales have been strong, with orders exceeding initial forecasts. The company has raised funds to support increased production.
Furthermore, on January 13, the company announced the approval of an additional indication for GBS-007: in addition to the existing indications of ‘age-related macular degeneration with subcentral choroidal neovascularisation’ and ‘choroidal neovascularisation in pathological myopia’, ‘diabetic macular edema’ was newly added. This is expected to broaden the drug treatment options for these diseases and reduce the economic burden on patients. The approval of the additional indications is due to the patent expiry for the existing drugs. Although this will only have a negligible impact on the company’s performance, it is a positive step in enhancing corporate value by strengthening the BS business.
*Filgrastim (GBS-001): BS, which a partner has already launched. GBS-001 has also been subject to cost-cutting, which should improve profitability. Mochida Pharmaceutical has decided to discontinue sales of GBS-001, but Kidswell Bio has already reflected this in its forecasts.
◆New biologics business: Patent application for anti-RAMP2 antibody (GND-004)
*Anti-RAMP2 antibodies to address unmet needs in retinopathy of prematurity: The anti-RAMP2 antibody is a novel antibody created in collaboration with the research group of Professor Takayuki Shindo of Shinshu University School of Medicine and is being developed under the company development code GND-004. The patent application states that the anti-RAMP2 antibody binds to the RAMP2 (Receptor Activity-Modifying Protein 2)/CRLR (Calcitonin Receptor-Like Receptor) complex. This inhibits the promotion of pathological angiogenesis. As a result, it is expected to be clinically applicable for retinopathy of prematurity. Anti-VEGF drugs are already known as angiogenesis inhibitors, but the anti-RAMP2 antibody acts via a different pathway to anti-VEGF. The company intends to promote licensing activities for anti-RAMP2 antibodies while differentiating them from existing drugs.
◇ Outlook for FY2023/3: Guidance is unchanged from initial estimates, but operating loss may narrow
The company has left its FY2023/3 forecasts of 2.9 billion yen in sales, 0.98 billion yen of operating loss and a net loss of 1.0 billion yen unchanged from the initial estimates. As of the end of 3Q, sales are approximately 60% of the full-year forecast. However, as sales of GBS-007 and other BS are expected to continue to be strong, the full-year sales plan is within the achievable target range of the company. On the other hand, the company has set a forecast of 1.4 billion yen for R&D expenses for the full year, but the actual amount as of 3Q was 580 million yen, a progress rate of 41%. The company has set 4Q as the period for booking major development costs. But as the remaining 800 million yen of R&D investment in 4Q alone is unrealistic, the full-year operating loss will likely be smaller than forecast.
◇ Share price trend: A rebound on good results and progress on SHED
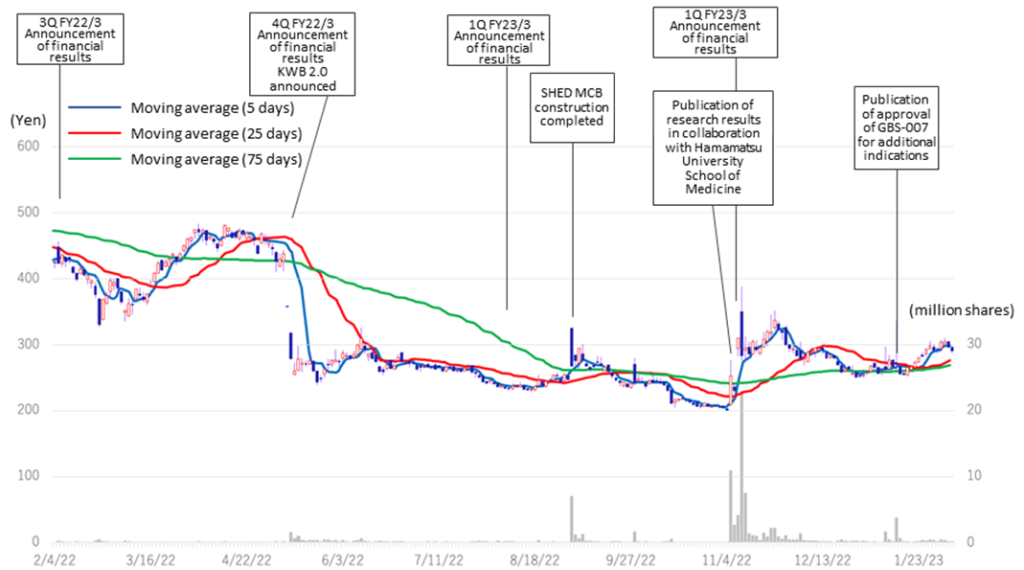
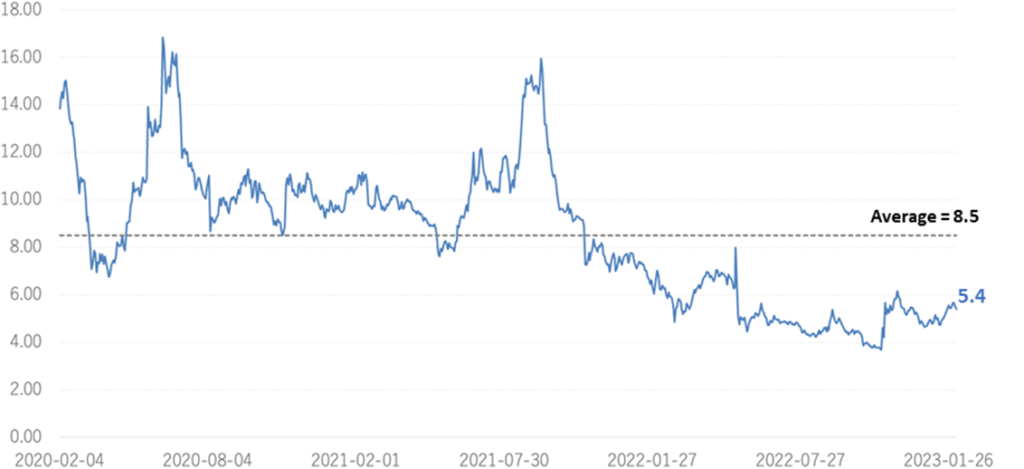
The company’s share price fell sharply in May 2022 when it announced its FY2022/3 results due to the postponement of its return to profitability in FY2023. Subsequently, on November 7, 2022, the share price rebounded significantly following the publication of a paper on the results of research conducted in collaboration with Hamamatsu University School of Medicine. On the following day, November 8, the company announced an operating surplus in its 2Q results, which led to further growth and a volume record rarely seen in recent years. However, since then, the share price has remained at around 300 yen to below 300 yen and has not recovered to its previous level. As a result, the company’s PBR remains below the three-year average (LTM) of 8.44x, staying at 5.22x (see chart on next page). In its new medium-term strategic plan (KWB 2.0), the company plans to achieve sales of 3 billion yen and an operating profit of 1 billion yen in FY2025 by securing solid earnings from the BS business. At the same time, the company has stated its intention to accelerate business development with an eye on the global market through continued investment in SHED. These plans are to move away from business development almost exclusively centered on the domestic market and to expand overseas in one stroke with SHED as a pillar, so the investment is expected to be enormous. The recent progress of the first-generation SHED into the clinical preparation stage, the patent grant for the anti-RAMP2 antibody and the addition of the indication for GBS-007 are examples of the company’s steady progress in its medium-term strategic plan. It will be interesting to see whether the share price will be revalued, reflecting these positive developments.
Kidswell Bio (4584) Share price and events over the past year
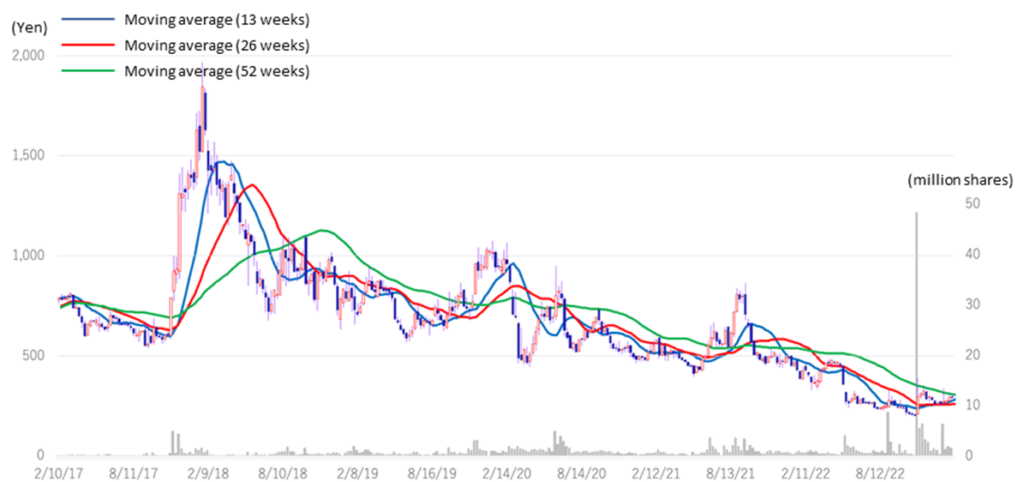
Stock price transition (last 6 years)
Historical PBR(4584, last three years, LTM)
Financial data
| FY (¥mn) | 2020/3 | 2021/3 | 2022/3 | 2023/3 | |||||||||||
| 1Q | 2Q | 3Q | 4Q | 1Q | 2Q | 3Q | 4Q | 1Q | 2Q | 3Q | 4Q | 1Q | 2Q | 3Q | |
| [Statements of income] | |||||||||||||||
| Net sales | 284 | 30 | 419 | 345 | 121 | 53 | 547 | 276 | 303 | 438 | 642 | 186 | 610 | 505 | 610 |
| Cost of sales | 77 | 8 | 359 | 209 | 5 | 35 | 46 | 34 | 122 | 154 | 183 | 91 | 292 | 128 | 233 |
| Gross profit | 207 | 22 | 60 | 136 | 116 | 19 | 500 | 242 | 182 | 283 | 460 | 94 | 318 | 377 | 377 |
| SG&A expenses | 417 | 423 | 381 | 365 | 354 | 463 | 465 | 565 | 491 | 425 | 442 | 580 | 356 | 328 | 524 |
| R&D expenses | 235 | 249 | 201 | 213 | 138 | 265 | 198 | 363 | 297 | 236 | 237 | 380 | 105 | 147 | 327 |
| Operating profit (loss) | -210 | -401 | -321 | -229 | -238 | -445 | 36 | -323 | -309 | -142 | 18 | -486 | -37 | 49 | -146 |
| Non-operating income | 0 | 0 | 1 | 0 | 0 | 1 | 1 | 1 | 2 | 0 | 0 | 1 | 0 | 2 | 0 |
| Non-operating expenses | 2 | 1 | 20 | 4 | 7 | 5 | 4 | 8 | 6 | 8 | 15 | 7 | 43 | 13 | 5 |
| Ordinary profit (loss) | -212 | -402 | -340 | -233 | -244 | -450 | 33 | -330 | -314 | -150 | 4 | -493 | -80 | 39 | -151 |
| Extraordinary income | 4 | 0 | 0 | 2 | 418 | 0 | – | – | – | ||||||
| Extraordinary expenses | 5,939 | 0 | 0 | 194 | 0 | 1 | 8 | 0 | – | – | – | ||||
| Profit (loss) before income taxes | -6,147 | -402 | -340 | -425 | -244 | -451 | 26 | -331 | -314 | -148 | 421 | -493 | -80 | 39 | -151 |
| Total income taxes | 1 | 0 | 3 | -2 | 1 | 0 | 0 | 1 | 0 | 1 | 52 | -51 | 0 | 1 | 0 |
| Net profit (loss) | -6,147 | -403 | -342 | -424 | -245 | -451 | 25 | -330 | -314 | -149 | 369 | -441 | -80 | 38 | -152 |
| [Balance Sheets] | |||||||||||||||
| Current assets | 2,761 | 2,390 | 3,238 | 3,322 | 3,573 | 3,218 | 3,329 | 3,346 | 2,794 | 3,203 | 3,722 | 3,326 | 4,079 | 4,035 | 3,948 |
| Cash equivalents and short-term securities |
1,654 | 1,602 | 2,482 | 2,033 | 2,658 | 2,502 | 1,830 | 1,461 | 874 | 974 | 1,253 | 1,187 | 1,532 | 1,874 | 1,499 |
| Non-current assets | 330 | 427 | 418 | 270 | 379 | 393 | 340 | 588 | 728 | 656 | 178 | 177 | 225 | 224 | 224 |
| Tangible assets | 2 | 2 | 2 | 2 | 2 | 2 | 2 | 3 | 3 | 2 | 2 | 2 | 1 | 1 | 1 |
| Investments and other assets | 328 | 425 | 416 | 268 | 374 | 389 | 336 | 582 | 722 | 651 | 173 | 173 | 220 | 220 | 220 |
| Total assets | 3,091 | 2,817 | 3,656 | 3,592 | 3,952 | 3,611 | 3,670 | 3,934 | 3,522 | 3,859 | 3,901 | 3,503 | 4,304 | 4,259 | 4,173 |
| Current liabilities | 421 | 550 | 529 | 881 | 772 | 858 | 925 | 1,114 | 823 | 1,034 | 1,045 | 1,129 | 1,175 | 651 | 780 |
| Short-term borrowings | 25 | 25 | 25 | 25 | 25 | ||||||||||
| Long-term debts to be repaid within one year | 75 | 250 | 300 | 400 | |||||||||||
| Non-current liabilities | 25 | 24 | 1,224 | 1,224 | 1,384 | 1,287 | 1,231 | 1,209 | 1,051 | 826 | 718 | 656 | 1,485 | 1,908 | 1,704 |
| Long-term debt | 1,200 | 1,200 | 1,340 | 1,240 | 1,200 | 1,100 | 900 | 700 | 700 | 625 | 1,450 | 1,875 | 2,275 | ||
| Long-term borrowing | 600 | 600 | 600 | 600 | 600 | 600 | 600 | 600 | 600 | 525 | 1,350 | 1,275 | 1,175 | ||
| Convertible bonds | 600 | 600 | 740 | 640 | 600 | 500 | 300 | 100 | 100 | 100 | 100 | ||||
| Total liabilities | 446 | 573 | 1,752 | 2,105 | 2,156 | 2,145 | 2,156 | 2,324 | 1,873 | 1,860 | 1,763 | 1,785 | 2,661 | 2,560 | 2,485 |
| Total net assets | 2,644 | 2,244 | 1,904 | 1,487 | 1,796 | 1,466 | 1,514 | 1,610 | 1,648 | 1,999 | 2,138 | 1,719 | 1,643 | 1,699 | 1,688 |
| Total shareholders’ equity | 2,644 | 2,244 | 1,904 | 1,487 | 1,796 | 1,466 | 1,514 | 1,610 | 1,648 | 1,999 | 2,138 | 1,719 | 1,444 | 1,500 | 1,490 |
| Capital | 612 | 612 | 612 | 612 | 842 | 892 | 912 | 1,032 | 1,150 | 1,420 | 1,420 | 1,421 | 1,424 | 1,433 | 1,504 |
| Legal capital reserve | 9,917 | 9,917 | 9,917 | 9,917 | 10,147 | 10,197 | 10,217 | 10,338 | 10,456 | 10,725 | 10,726 | 10,727 | 10,730 | 10,739 | 10,810 |
| Retained earnings | -7,908 | -8,311 | -8,653 | -9,077 | -9,322 | -9,773 | -9,748 | -10,079 | -10,393 | -10,542 | -10,173 | -10,614 | -10,710 | -10,672 | -1,0824 |
| Stock acquisition right | 38 | 43 | 51 | 57 | 70 | 82 | 101 | 116 | 134 | 145 | 165 | 185 | 199 | 199 | 197 |
| Total liabilities and net assets | 3,091 | 2,817 | 3,656 | 3,592 | 3,952 | 3,611 | 3,670 | 3,934 | 3,522 | 3,859 | 3,901 | 3,503 | 4,304 | 4,259 | 4,173 |
| [Statements of cash flows] | |||||||||||||||
| Cash flow from operating activities | -604 | -1,325 | -104 | -1,267 | -857 | -1,169 | -709 | ||||||||
| Loss before income taxes | -6,548 | -7,314 | -695 | -999 | -462 | -533 | -42 | ||||||||
| Cash flow from investing activities | -106 | -137 | -5 | -22 | – | 526 | -23 | ||||||||
| Expenditure on acquisition of intangiblefixed assets |
– | – | -3 | -3 | – | -1 | – | ||||||||
| Purchase of investment securities | -100 | -100 | – | – | – | – | -50 | ||||||||
| Sales of investment securities | – | – | – | – | – | 526 | – | ||||||||
| Cash flow from financing activities | 40 | 1,221 | 579 | 718 | 370 | 369 | 1,446 | ||||||||
| Income from the issuance of convertible bond-type bonds with stock acquisition rights |
970 | ||||||||||||||
| Income from issuance of shares by exercising stock acquisition rights |
– | 599 | 599 | 599 | – | – | 499 | ||||||||
| Income from issuance of stock acquisition rights |
40 | 40 | – | 138 | 370 | 369 | – | ||||||||
| Proceeds from issuance of new shares | – | 3 | 4 | 4 | – | – | – | ||||||||
| Net increase in cash and cash equiv. | -670 | -240 | 468 | -571 | -486 | -273 | 713 | ||||||||
| Cash and cash equiv. at beginning of period | 2,009 | 2,009 | 2,032 | 2,032 | 1,461 | 1,462 | 1,160 | ||||||||
| Cash and cash equiv. at end of period | 1,602 | 2,032 | 2,501 | 1,461 | 974 | 1,187 | 1,874 |
Note: Consolidated basis until FY2022/3; non-consolidated basis from 1Q FY2023/3. For the statement of cash flows, the figures for 2Q are the cumulative figures for the period from 1Q to 2Q, and the figures for 4Q are the cumulative figures for the period from 1Q to 4Q. Therefore, the opening balance is also the balance at the beginning of each quarter.
Source: Omega Investment from company materials.