2026-07-27
Home
Japanese

Omega Investment Co., Ltd.
Chiome Bioscience (Company Note – 4Q update)

| Share price (3/3) | ¥189 | Dividend Yield (23/12 CE) | – % |
| 52weeks high/low | ¥217/135 | ROE(TTM) | -67.48 % |
| Avg Vol (3 month) | 1,728 thou shrs | Operating margin (TTM) | -199.53 % |
| Market Cap | ¥9.1 bn | Beta (5Y Monthly) | 1.00 |
| Enterprise Value | ¥7.1 bn | Shares Outstanding | 48.423 mn shrs |
| PER (23/12 CE) | – X | Listed market | TSE Growth |
| PBR (22/12 act) | 5.15 X |
| Click here for the PDF version of this page |
| PDF Version |
Full-year results for FY12/2022 came in broadly in line with the company forecasts
The existing pipeline is progressing well
◇Full-year results for FY12/2022 were in line with the company’s expectations. The share price is on a recovery trend
Chiome Bioscience’s (hereafter referred to as ‘the company’) full-year results for FY2022/12 were in line with the company’s forecasts. Phase I clinical trials of in-house developed products progressed smoothly in the company’s core drug discovery and development business. Several out-licensing candidates and drug discovery projects are also underway.
The share price has risen since bottoming out at 136 yen on 28 September 2022. On 15 February, the day after the announcement of the full-year results (15 February), the share price was up 8.5% over the previous day. This indicates that the company’s business is progressing steadily in line with investors’ expectations. The company is expected to out-licence new drugs from FY12/2023 onwards, with the possibility of an upfront payment being recorded. The company will continue to monitor the progress of drug discovery projects.
◇ Full-year results for FY12/2022
The company posted sales of 630 million yen (-11.5%), an operating loss of 1,258 million yen (previous year: operating loss of 1,334 million yen) and a net loss of 1,242 million yen (last year: net loss of 1,479 million yen) in FY12/2022. In the previous FY12/2021, an upfront payment of 103 million yen was recorded for out-licensing the drug discovery and development business to Henlius in 1Q. This year’s main reason for the sales decline was that only sales from the Drug Discovery Support Business were recorded.
See the chart on the next page for the progress of each pipeline in the drug discovery and development business. Each pipeline progresses well, but sales have yet to be recorded during FY12/2022. R&D costs of 1,135 million yen were recorded due to progress in clinical development, a decrease of 176 million yen from the previous year due to lower CMC costs. As a result, the segment’s loss was 1,135 million yen (last year: loss of 1,209 million yen).
The Drug Discovery Support Business provides research support for biopharmaceuticals, mainly to major domestic pharmaceutical companies, by contracting the company’s antibody creation and protein preparation services. Stable revenues from this business help to secure research and development expenditure for the drug discovery and development business. The business has steadily increased the number of transactions and projects. Sales were 630 million yen (up 20 million yen YoY), and segment profit was 348 million yen (up 29 million yen). The segment profit margin was 55.3%, meeting the company target of 50%.
In BS, total assets at end-December 2022 amounted to 2,215 million yen. This is a decrease of 124 million yen compared to end-December 2021, changing little. Cash and deposits amounted to 1,727 million yen (1,790 million yen at end-December 2021). Others in current assets decreased by 61 million yen due to the reversal of advance payment and recording it as an expense in the current period, following the completion of the manufacturing of the CBA-1535 investigational medicinal product. Total net assets amounted to 1,790 million yen, a decrease of 102 million yen from the end of the previous year. This was due to an increase in capital stock and capital reserve of 582 million yen each due to the exercise of subscription rights, with a worsening of negative retained earnings by 1,243 million due to the net loss for the year.
As for the cash flows, cash and cash equivalents at the end of December 2022 amounted to 1,727 million, a decrease of 63 million yen YoY. Cash flow from operation decreased by 1,208 million yen due to a net loss before tax of 1,237 million yen. On the other hand, net cash provided by financing activities amounted to 1,126 million yen, mainly due to the issue of shares upon the exercise of subscription rights.
Note: In this report, the current term refers to FY12/2022, and the previous term refers to FY12/2021.
| JPY, mn, % | Net sales | YoY % |
Oper. profit |
YoY % |
Ord. profit |
YoY % |
Profit ATOP |
YoY % |
EPS (¥) |
| 2018/12 | 212 | -18.1 | -1,539 | – | -1,533 | – | -1,533 | – | -57.26 |
| 2019/12 | 447 | 110.3 | -1,401 | – | -1,410 | – | -1,403 | – | -44.61 |
| 2020/12 | 480 | 7.4 | -1,283 | – | -1,291 | – | -1,293 | – | -36.06 |
| 2021/12 | 712 | 48.3 | -1,334 | – | -1,329 | – | -1,479 | – | -36.74 |
| 2022/12 | 630 | -11.5 | -1,258 | – | -1,243 | – | -1,242 | – | -28.26 |
| 2023/12 (CE) | – | – | – | – | – | – | – | – | – |
Note: The company discloses only the estimates for the Drug Discovery Support business (sales of 640 million yen), as it is difficult to make reasonable forecasts for the drug discovery and development business.
Drug discovery and development business – pipeline
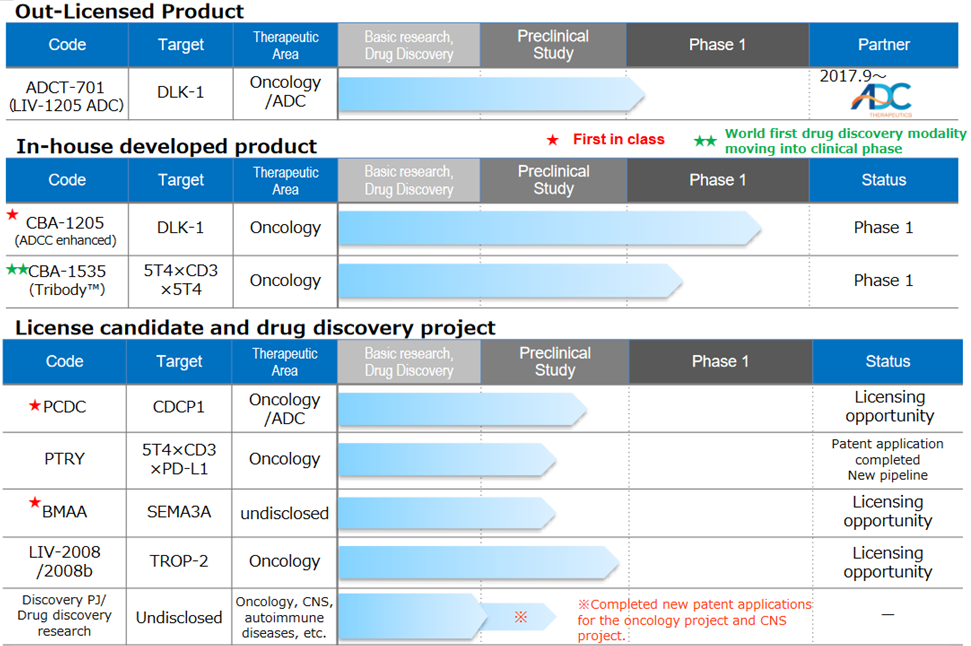
Source: Company materials
◇Progress in the pipeline:
<In-house developed products>
*CBA–1205;Phase I clinical trials continue to progress
The first half of Phase I clinical trials for patients with solid tumours conducted at the National Cancer Centre has already been completed. The final results of the first half of the trial have shown a high level of safety and tolerability. However, It is necessary to wait for all analyses to be completed. SD (stable disease) assessments continued in patients who were refractory to standard treatment during treatment, with patient remaining on treatment for up to 18 months or longer identified. The drug is expected to have some benefits with continued treatment. In 2022 it will enter the second part of the Phase 1 trial, administered to patients with hepatocellular carcinoma.
Based on the progress of the second part of the Phase 1 trial, CBA-1205 is expected to be licensed out at some stage during 2023-2025. As for the potential out-licensing partners, the company is considering two groups of companies: those that want to expand the development pipeline as soon as possible and those that focus on business feasibility and probability of success. The upfront payment for out-licensing varies depending on the timing of out-licensing, but the company is considering a variety of potential out-licensing partners. The company aims to make a profit in a single year by 2023 at the earliest and by 2025 at the latest by receiving an upfront payment for out-licensing.
*CBA–1535;First half of Phase I clinical trials (single agent)
The company submitted a clinical trial plan notification to the PMDA in February 2022. It started Phase I clinical trials at the National Cancer Centre Hospital and Shizuoka Cancer Centre from the end of June. In the first half of Phase I clinical trial, safety and efficacy signals were evaluated in patients with solid tumours. The drug will be administered in stages, starting from a low volume to find the maximum dose that can be safely administered and to assess the initial drug effect signal. The second part will assess efficient drug efficacy with cancer immunotherapy drugs. The first part is scheduled to continue until the first half of 2024. The second part will be conducted in parallel starting in mid-2023, with a development plan to confirm safety and efficacy as quickly as possible.
Potential applications for TribodyTM
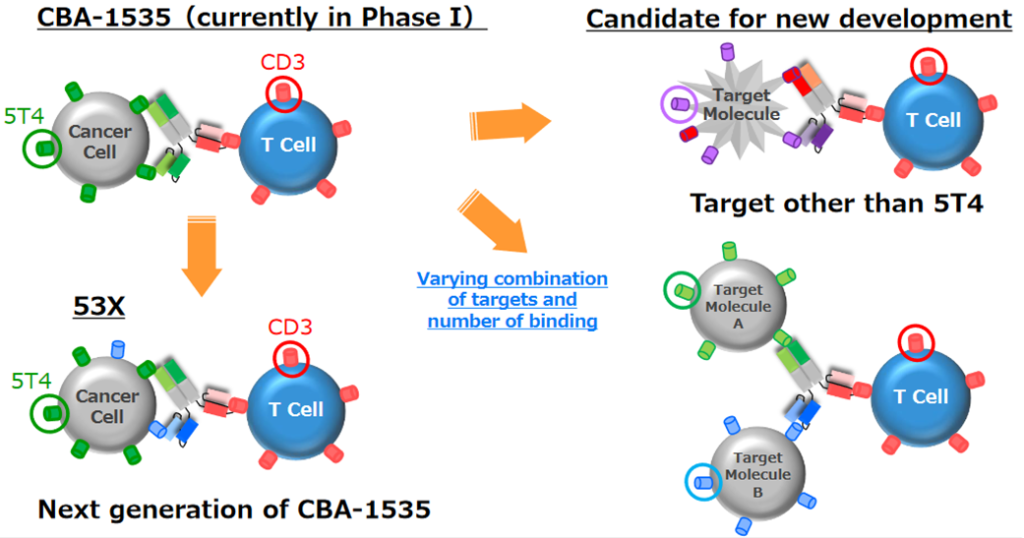
CBA-1535 is the world’s first clinical trial for TribodyTM and, if the concept is confirmed, will expand the applicability of TribodyTM to many cancer antigens (see above). Combining the number of binding targets and the number of moves to which they bind is expected to provide benefits beyond conventional antibodies. Through the combined administration of multiple drugs, multiple medicinal effects can be expected from administering only one drug, which is expected to improve a patient’s quality of life and provide health economics benefits.
<Out-llicenced products>
*LIV-1205;LIV-1205; Out-licensed to ADC Therapeutics, Switzerland, for ADC use only. ADCT, in collaboration with the National Cancer Institute (NCI), is preparing for clinical trials in neuroendocrine cancer and is expected to enter the clinical trial in 2023.
<Out-licensing candidates>
*PCDC;Promoting out-licensing activities focusing on ADC applications and accumulating animal study data and contacting pharmaceutical companies that want to expand their pipelines as ADCs and pharmaceutical companies that want antibodies for ADCs with proprietary ADC technologies as out-licensing strategies and targets at conferences in Japan and abroad.
*PTRY;A new pipeline. Creation of highly active TribodyTM antibodies by new molecule combination. The new pipeline of PTRY targeting 5T4xCD3xPD-L1. Results of joint research on cancer immunotherapy conducted with the Italian public research institute Ceinge-Biotechnologie Avanzate were published in the Journal of Experimental & Clinical Cancer Research, an international journal. A patent application has been completed for the results obtained through this collaboration. In vivo efficacy data in lung cancer models have confirmed that it exerts a strong tumour growth inhibitory effect.
*BMAA;Completed joint research with overseas research institutes targeting diseases involving semaphorin 3A. The company plans to use the semaphorin 3A data acquired to date and data from the exploratory investigation into the semaphorin family in its future business development activities.
*LIV-2008;In January 2021, the company concluded a licence agreement with Shanghai Henlius Biotech, Inc (headquartered in Shanghai, China), but on 17 January 2023, the company announced that the licence agreement had ended. This was a business strategy decision, considering the development status of earlier products. The company plans to develop new out-licensing partners for LIV-2008 and other drug discovery pipelines.
◇Progress in Drug Discovery Support Business: Contract agreement concluded with ROHTO Pharmaceutical Co.
The Drug Discovery Support Business recorded sales of 630 million yen in FY12/2022. This is an increase of 20 million yen YoY and came in at 10 million yen above the company forecast, so the business is growing steadily. The company has received high praise from domestic pharmaceutical companies for its technical service capabilities, and trade with existing customers is steadily increasing. It also expands business with new clients, such as the new outsourcing agreement with ROHTO Pharmaceutical Co. on 11 July 2022 to create therapeutic antibodies with option rights.
◇ Core technology: Evolving and deepening the use and improvement of the ADLib®︎ system/TribodyTM.
The company continues to utilise and improve its core technology, the ADLib®︎ system, through participation in projects funded by the Japan Agency for Medical Research and Development (AMED). The company also received patent applications for the ADLib®︎ system in Japan and Europe. By continuing to advance these studies, the company intends to improve the technology related to the Drug Discovery Support Business and also use it to strengthen its in-house drug discovery pipeline.
◇ Financing trends: is the company looking at financing during the current financial year?
On 15 December 2021, the company issued its 18th series of warrants (with a clause to amend the exercise price) through a third-party allotment to invest in the development of CBA-1205 and CBA-1535 and capital investment in the Drug Discovery Support Business. The exercise of these warrants was completed on 26 December 2022. The amount of funds raised was 1,208 million yen. As a drug discovery venture, the company must invest over 1 billion yen in research and development annually. As mentioned, the Drug Discovery Support Business generates a profit of over 300 million yen, which is insufficient to cover the annual research and development costs. The company has a cash and cash equivalents balance of 1.73 billion yen at the end of December 2022. New financing is likely on the agenda if no out-licensing fees are expected soon in the drug discovery and development business.
◇Full-year forecast for FY12/2023: Revenues from the Drug Discovery Support Business are expected to be 640 million yen
For FY12/2023, the company has announced forecasts for revenues of 640 million yen from the Drug Discovery Support Business alone, which is expected to generate ongoing revenues. In terms of costs, R&D investment will continue to be in the region of 1 billion per year, as clinical trial and investigational drug manufacturing costs will increase in line with the progress of each pipeline as in the past. A commensurate loss will likely be incurred if the drug discovery and development business is not expected to generate upfront licensing payments or other income.
◇Share price:
The company’s share price bottomed out at 136 yen on 28 September 2022 and has been increasing. On 15 February, the day after the announcement of full-year results, the share price went up 8.5%. This reflects investors’ appreciation that the company’s business is progressing steadily in line with its expectations. The positive news is continually coming out of the company, such as clinical trial applications and patent filings. The company has several drug discovery projects in its pipeline, and clinical trials for CBA-1205 and CBA-1535 are progressing steadily, with new out-licensing expected from FY12/2023 onwards. At this time, the company may record an upfront payment for out-licensing agreements. The progress of drug discovery projects should continue to be monitored closely.
The share price has recently returned to around 200 yen, but further upside can be expected considering these points.
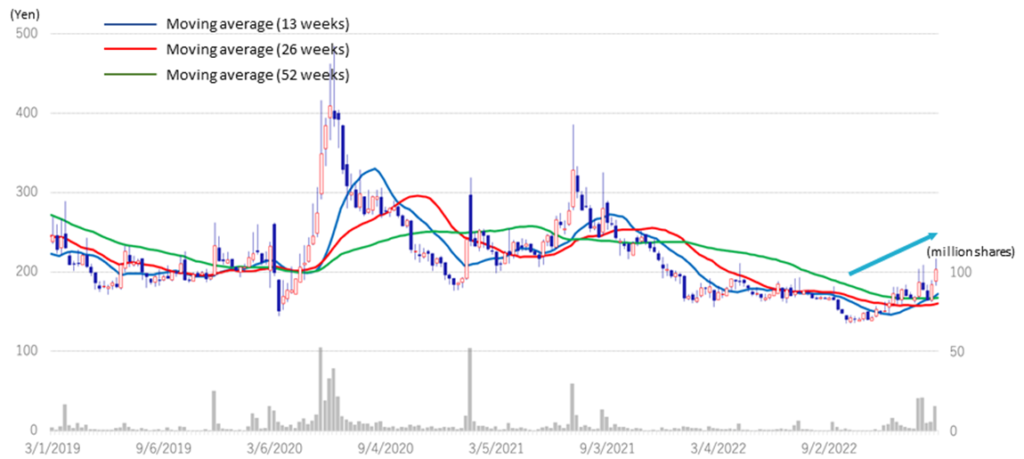
Stock price (4 years)
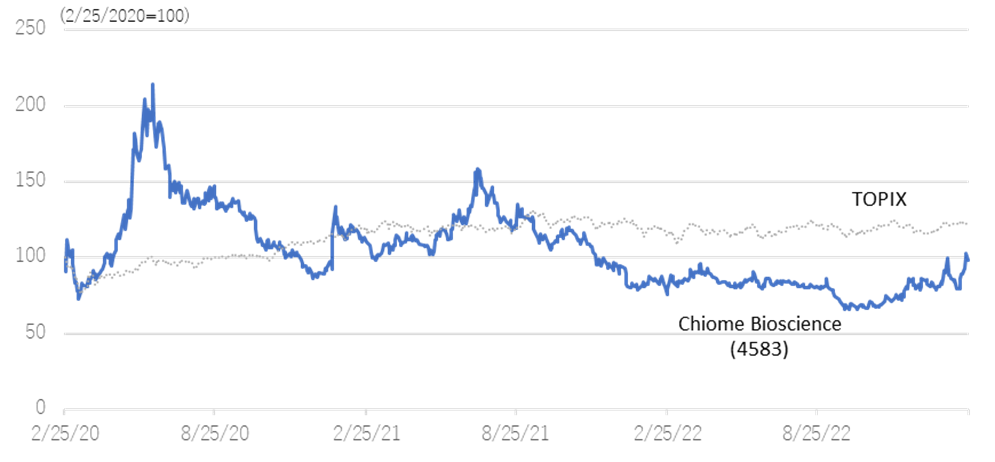
Relative chart; Chiome Bioscience (4583) and TOPIX (3 years)
Financial data
| FY (¥mn) | 2019/12 | 2020/12 | 2021/12 | 2022/12 | ||||||||||||
| 1Q | 2Q | 3Q | 4Q | 1Q | 2Q | 3Q | 4Q | 1Q | 2Q | 3Q | 4Q | 1Q | 2Q | 3Q | 4Q | |
| [Statements of income] | ||||||||||||||||
| Net sales | 64 | 77 | 142 | 165 | 91 | 82 | 139 | 169 | 246 | 139 | 157 | 171 | 128 | 149 | 156 | 197 |
| Drug Discovery and Development Business |
0 | 1 | 1 | 28 | 1 | 1 | 0 | 1 | 103 | 0 | 0 | 0 | 0 | 0 | 0 | 0 |
| Drug Discovery Support Business | 63 | 76 | 142 | 137 | 90 | 82 | 138 | 168 | 143 | 138 | 157 | 171 | 128 | 149 | 156 | 197 |
| Cost of sales | 27 | 26 | 58 | 52 | 61 | 46 | 59 | 70 | 64 | 62 | 78 | 86 | 57 | 69 | 72 | 83 |
| Gross profit | 37 | 51 | 84 | 113 | 30 | 36 | 80 | 99 | 182 | 77 | 79 | 84 | 70 | 80 | 84 | 114 |
| SG&A expenses | 464 | 374 | 503 | 346 | 456 | 346 | 424 | 303 | 337 | 337 | 515 | 568 | 557 | 373 | 344 | 334 |
| R&D expenses | 363 | 273 | 407 | 256 | 343 | 266 | 342 | 206 | 216 | 243 | 401 | 451 | 446 | 245 | 225 | 219 |
| Operating profit | -426 | -324 | -419 | -233 | -426 | -310 | -344 | -204 | -155 | -260 | -436 | -483 | -486 | -292 | -260 | -220 |
| Non-operating income | 0 | 1 | 4 | 0 | 2 | 0 | 3 | 0 | 7 | 0 | 2 | 4 | 0 | 16 | 0 | 5 |
| Non-operating expenses | 6 | 4 | 4 | 0 | 0 | 2 | 10 | 1 | 1 | 0 | 1 | 6 | 4 | 1 | 1 | -1 |
| Ordinary profit | -432 | -327 | -418 | -233 | -425 | -311 | -351 | -205 | -150 | -259 | -434 | -486 | -491 | -278 | -261 | -214 |
| Extraordinary income | 2 | 1 | 6 | 0 | 0 | 0 | 0 | 6 | 0 | |||||||
| Extraordinary expenses | ||||||||||||||||
| Loss before income taxes | -430 | -326 | -412 | -233 | -425 | -310 | -351 | -205 | -149 | -247 | -433 | -636 | -491 | -278 | -255 | -214 |
| Total income taxes | 1 | 0 | 1 | 0 | 1 | 0 | 1 | 1 | 11 | 1 | 1 | 0 | 1 | 2 | 1 | 1 |
| Net income | -431 | -326 | -413 | -234 | -425 | -311 | -352 | -206 | -161 | -248 | -434 | -637 | -492 | -279 | -257 | -215 |
| [Balance Sheets] | ||||||||||||||||
| Current assets | 3,048 | 3,206 | 2,807 | 2,561 | 2,309 | 2,805 | 3,316 | 3,249 | 3,294 | 3,088 | 2,675 | 2,216 | 2,005 | 1,792 | 1,955 | 2,092 |
| Cash and deposits | 2,776 | 2,899 | 2,469 | 2,106 | 1,967 | 2,472 | 2,881 | 2,686 | 2,580 | 2,302 | 2,071 | 1,790 | 1,744 | 1,471 | 1,592 | 1,727 |
| Non-current assets | 219 | 217 | 242 | 247 | 247 | 249 | 249 | 246 | 244 | 241 | 274 | 122 | 121 | 128 | 126 | 123 |
| Tangible assets | 15 | 14 | 12 | 11 | 10 | 9 | 8 | 7 | 6 | 6 | 4 | 4 | 3 | 3 | 2 | 2 |
| Investments and other assets | 204 | 204 | 230 | 236 | 237 | 240 | 241 | 238 | 237 | 235 | 269 | 118 | 117 | 124 | 122 | 120 |
| Total assets | 3,267 | 3,423 | 3,049 | 2,808 | 2,556 | 3,054 | 3,566 | 3,495 | 3,537 | 3,329 | 2,950 | 2,339 | 2,126 | 1,920 | 2,081 | 2,215 |
| Current liabilities | 177 | 207 | 154 | 145 | 315 | 427 | 378 | 343 | 378 | 428 | 468 | 392 | 419 | 390 | 376 | 370 |
| Short-term borrowings | 142 | 199 | 199 | 180 | 180 | 190 | 199 | 183 | 183 | 188 | 188 | 184 | ||||
| Non-current liabilities | 41 | 41 | 41 | 41 | 42 | 42 | 42 | 42 | 42 | 42 | 53 | 53 | 53 | 54 | 54 | 54 |
| Total liabilities | 219 | 248 | 196 | 187 | 357 | 469 | 420 | 385 | 420 | 470 | 522 | 446 | 473 | 444 | 431 | 424 |
| Total net assets | 3,048 | 3,175 | 2,853 | 2,622 | 2,199 | 2,585 | 3,146 | 3,110 | 3,118 | 2,859 | 2,428 | 1,893 | 1,653 | 1,476 | 1,650 | 1,790 |
| Total shareholders’ equity | 3,048 | 3,175 | 2,853 | 2,622 | 2,199 | 2,585 | 3,146 | 3,110 | 3,118 | 2,859 | 2,428 | 1,857 | 1,621 | 1,445 | 1,631 | 1,777 |
| Capital stock | 5,856 | 6,084 | 6,132 | 6,132 | 6,133 | 846 | 1,303 | 1,388 | 1,471 | 1,471 | 1,472 | 1,515 | 1,642 | 1,695 | 1,916 | 2,097 |
| Legal capital reserve | 5,846 | 6,074 | 6,122 | 6,122 | 6,123 | 2,446 | 2,903 | 2,987 | 3,071 | 3,071 | 3,072 | 3,115 | 3,242 | 3,295 | 3,516 | 3,696 |
| Retained earnings | -8,682 | -9,008 | -9,421 | -9,655 | -10,080 | -736 | -1,088 | -1,294 | -1,455 | -1,703 | -2,136 | -2,773 | -3,262 | -3,544 | -3,801 | -4,016 |
| Subscription rights to shares | 28 | 26 | 20 | 22 | 24 | 30 | 28 | 29 | 30 | 19 | 19 | 35 | 31 | 30 | 18 | 13 |
| Total liabilities and net assets | 3,267 | 3,423 | 3,049 | 2,808 | 2,556 | 3,054 | 3,566 | 3,495 | 3,537 | 3,329 | 2,950 | 2,339 | 2,126 | 1,920 | 2,081 | 2,215 |
| [Statements of cash flows] | ||||||||||||||||
| Cash flow from operating activities | -677 | -1,537 | -528 | -1,361 | -560 | -1,131 | -660 | -1,191 | ||||||||
| Loss before income taxes | -755 | -1,401 | -734 | -1,290 | -396 | -1,466 | -768 | -1,237 | ||||||||
| Cash flow from investing activities | – | -26 | – | 3 | – | -35 | – | – | ||||||||
| Purchase of investment securities | – | – | – | – | – | – | – | – | ||||||||
| Cash flow from financing activities | 1,248 | 1,341 | 894 | 1,944 | 176 | 271 | 341 | 1,127 | ||||||||
| Proceeds from issuance of common shares |
1,249 | 1,345 | 697 | 1,769 | 166 | 253 | 336 | 1,126 | ||||||||
| Net increase in cash and cash equiv. | 570 | -222 | 366 | 580 | -384 | -895 | -319 | -63 | ||||||||
| Cash and cash equiv. at beginning of period |
2,328 | 2,328 | 2,105 | 2,105 | 2,686 | 2,686 | 1,790 | 1,790 | ||||||||
| Cash and cash equiv. at end of period | 2,899 | 2,105 | 2,472 | 2,686 | 2,301 | 1,790 | 1,471 | 1,727 | ||||||||
Note) For the cash flow statement, Q2 is the cumulative of Q1 to Q2, and Q4 is the cumulative of Q1 to Q4. Therefore, the beginning balance will be the beginning balance of Q4 for both Q2 and Q4.
Source: Omega Investment from Company materials.