2026-07-15
Home
Japanese

Omega Investment Co., Ltd.
Digital Hearts Holdings (Company Note Q3 update)

| Share price (3/14) | ¥1,438 | Dividend Yield (23/3 CE) | 1.46 % |
| 52weeks high/low | ¥2,053 / 1,402 | ROE(TTM) | 22.54 % |
| Avg Vol (3 month) | 77.1 thou shrs | Operating margin (TTM) | 7.81 % |
| Market Cap | ¥34.3 bn | Beta (5Y Monthly) | 0.88 |
| Enterprise Value | ¥32.1 bn | Shares Outstanding | 23.890 mn shrs |
| PER (23/3 CE) | 13.9 X | Listed market | TSE Prime section |
| PBR (22/3 act) | 3.33 X |
| Click here for the PDF version of this page |
| PDF Version |
Despite strategic investments, profit growth continues
The share price is under adjustment, but the growth story remains intact
◇ Summary of financial results: 27% YoY increase in sales and significant growth in EBITDA, partly due to M&A benefits.
Enterprise Business, the company’s focus, continued to grow at a high rate, with sales up 50% YoY, with a tailwind of accelerating DX. Also, Entertainment Business posted double-digit revenue growth due to robust sales of debugging for console games. Despite strategic investments in the first half of the year mainly in Enterprise Business, operating profit increased thanks to the effect of increased sales for domestic debugging. On an EBITDA basis, excluding the impact of goodwill amortisation and other factors, profits increased by 16.2% YoY.
AGEST, the core company of Enterprise Business, has gradually established a tech-related brand and is expanding the number of clients placing orders and hiring of engineers. Meanwhile, in Entertainment Business, the company is reinforcing its business base globally, such as by bolstering the marketing business in South Korea.
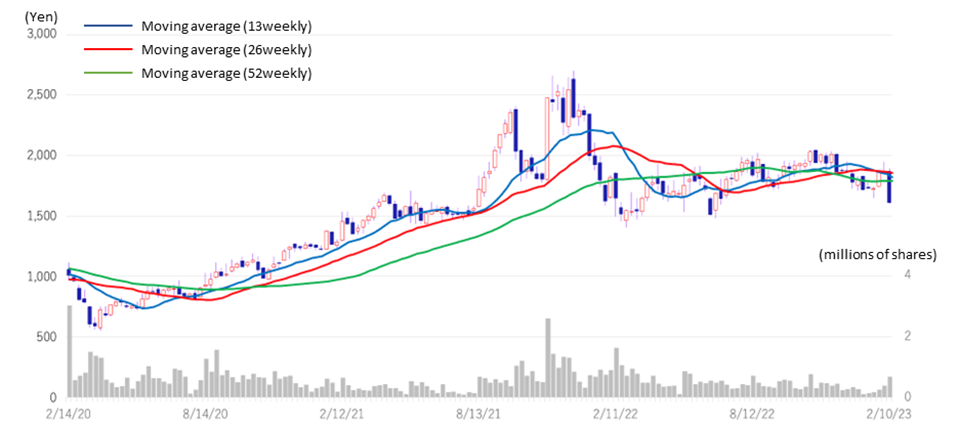
◇ Share price trend: Adjustment after the result announcement, but revaluation is expected
On February 10, the day after the February 9 result announcement, the company’s share price fell 11.4% over the previous day. The adjustment has continued since then. Various factors are conceivable, but the share price almost returned to the level of a year ago. In the first half of the current fiscal year, strategic investments in line with the start-up of AGEST weighed on profits. Still, investment benefits are steadily beginning to materialise in the short term. We expect the share price to be revalued as the market reaffirms that the company is well on track for its medium-term growth story.
◇ Results for the first nine months of FY2023/3: Both businesses performed well, and profits increased despite strategic investments.
Digital Hearts Holdings reported double-digit YoY sales growth in Enterprise Business and Entertainment Business in the cumulative Q3 results for FY2023/3. Enterprise Business saw a turnaround in profit growth in Q3 alone, despite strategic investments in AGEST. In Entertainment Business, both Domestic debugging and Global and others posted double-digit revenue growth, generating segment profit of 3.2 billion yen. As a result, the company’s cumulative Q3 sales were 26,879 million yen (+26.5%), operating profit was 2,140 million yen (+0.8%), and EBITDA increased to 2,984 million yen or +16.2%. Non-operating/extraordinary gains and losses were recorded concerning exchange rate fluctuations and the liquidation of overseas operations.
By segment, sales in Enterprise Business increased by 52.0%, due to continued double-digit sales growth in the existing business and the benefits of M&As. The segment profit declined by 22.1% due to aggressive strategic investment, but the segment managed a 2.8% YoY increase in profit for Q3 alone. EBITDA grew significantly by 29.6%, partly supported by M&A benefits. Meanwhile, in Entertainment Business, sales of debugging for console games were strong. Global and others also recorded double-digit sales growth, resulting in a 12.2% rise in segment sales and an 11.1% increase in profit.
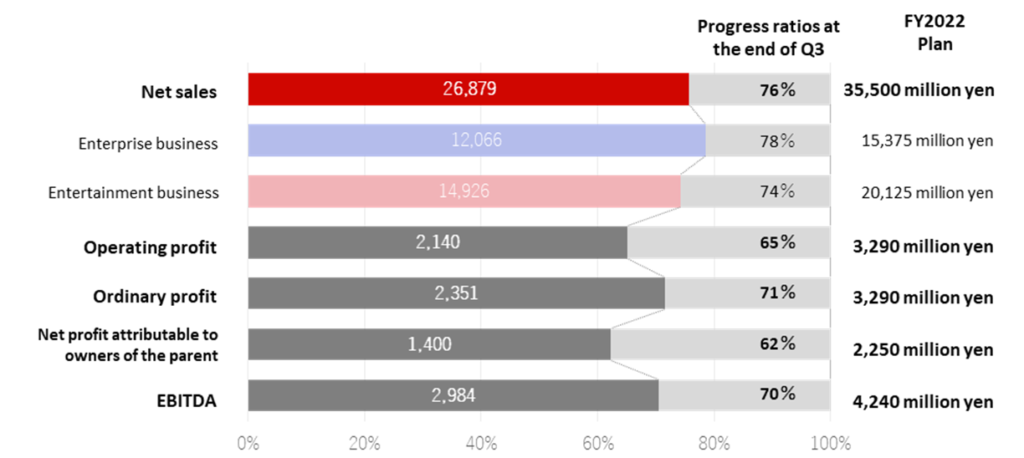
◇ Progress during FY2023/3: No change in the initial guidance. Sales could swing upward.
The progress ratio at the end of Q3 against the company’s full-year forecast was 76% for sales, 65% for operating profit and 70% for EBITDA. Although profit is behind, it aims to achieve its full-year targets by boosting sales above forecasts.
| JPY, mn, % | Net sales | YoY % |
Oper. profit |
YoY % |
Ord. profit |
YoY % |
Profit ATOP |
YoY % |
EPS (¥) |
DPS (¥) |
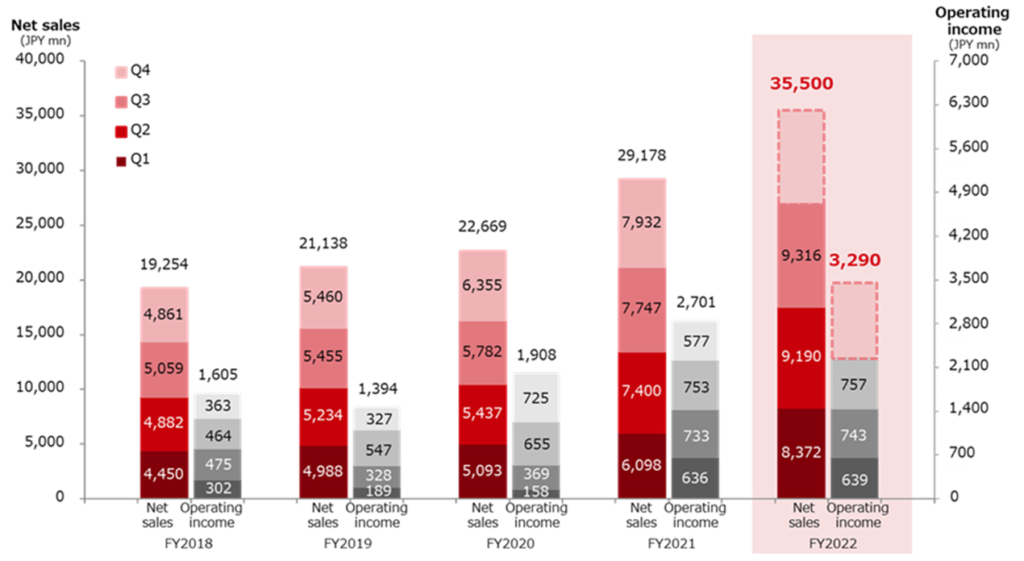
| 2019/3 | 19,254 | 11.0 | 1,605 | -7.5 | 1,651 | -7.4 | 1,575 | 31.3 | 72.13 | 13.00 |
| 2020/3 | 21,138 | 9.8 | 1,394 | -13.2 | 1,372 | -16.9 | 792 | -49.7 | 36.31 | 14.00 |
| 2021/3 | 22,669 | 7.2 | 1,908 | 36.9 | 1,975 | 43.9 | 974 | 23.0 | 45.15 | 14.00 |
| 2022/3 | 29,178 | 28.7 | 2,701 | 41.5 | 2,778 | 40.7 | 1,780 | 82.7 | 82.35 | 15.00 |
| 2023/3 (CE) | 35,500 | 21.7 | 3,290 | 21.8 | 3,290 | 18.4 | 2,250 | 26.4 | 104.02 | 21.00 |
| 2022/3 Q3 (cumulative) | 21,246 | 30.2 | 2,123 | 79.5 | 2,192 | 76.0 | 1,363 | 71.6 | 63.05 | 7.50 |
| 2023/3 Q3 (cumulative) | 26,879 | 26.5 | 2,140 | 0.8 | 2,351 | 7.3 | 1,400 | 2.7 | 64.26 | 10.50 |
Full year consolidated sales / operating profit trend
◇Trends by segment: (See also a graph on p.3 and table on p.6)
1) Enterprise Business: sales up 52.0% (12,066 million yen), EBITDA up 29.6%
Strategic investment has been exercised to strengthen the growth foundation of this business, centred on AGEST, which was formed as the core company of Enterprise Business following the reorganisation of the corporate group in April 2022. The company focused on establishing a ‘tech’ brand by securing the engineers needed for business expansion, developing an exclusively-set environment for engineers and holding various IT seminars. The effect of this investment led to a steady increase in the number of customers placing orders. Since Q1, sales have grown at +10% QoQ. As a result, in Q3 alone, Enterprise Business grew by almost half to 47.8% of all company sales. On top of the existing businesses continuing to record double-digit sales growth, driven by the progress of DX and the expansion of test outsourcing needs, the benefits of the recent M&As kicked in and the overall segment sales increased by over 50%. On the other hand, the gross profit margin in Q3 alone declined, affected by deterioration due to sales declines at overseas subsidiaries in Q3. Segment profit was 313 million yen, or -22.1%, but EBITDA increased by 29.6% to 835 million yen.
QA Solution: sales of 7,314 million yen (+54.3%). The scale of transactions per company was raised by strengthening cross-selling in areas such as security testing and test automation, based on manual software testing, where the company’s strength lies. In addition, the company is expanding services that utilise its specialist knowledge, such as mutation testing*, while increasing the number of test engineers in the QA business it succeeded from Sobal Corporation. The performance of CEGB, acquired through M&A, has contributed from Q1. Sales growth of 32.7% was achieved, even excluding the impact of newly consolidated subsidiaries such as CEGB.
Sales fell at overseas subsidiaries due to a temporary drop in orders. This inflicted profits negatively, resulting in a lower gross profit margin in Q3 (Q1 32.2% → Q2 35.3% → Q3 30.1%). The company aims to maintain a gross profit margin of around 32% and expects it to improve in Q4 as sales increase due to the busy season and other factors.
The number of customers** with orders at the end of Q3 was 693 (target for the end of Q4 FY2023/3: 830. However, when the numbers for subsidiaries operating for less than 12 months are included, approximately 800). The number of engineers at the end of Q3 was 993 (Q4 target 1,100; while the number of engineers decreased at the Vietnamese subsidiary to improve operating efficiency and utilization ratio, the number of engineers in Japan is steadily expanding). Advanced test and next-generation QA accounted for 35.1% (Q4 target 45.0%) of sales.
IT services and others: sales: 4,751 million yen (+48.6%); the number of registered engineers at identity Inc., which became a subsidiary in June 2021, grew to 25,000, contributing to sales growth. Security monitoring services are also expanding steadily against the introduction of remote working following the spread of COVID-19.
*Mutation testing: a method of visualising test code quality by artificially inserting error codes into source code using tools. In cases where there are no problems, the test will fail if a bug is planted, but in cases where there are problems, the test will succeed even though a bug is planted.
** Number of customers and the average order value per customer is calculated based on the most recent 12 months. Subsidiaries that have been consolidated for less than 12 months are excluded.
Note: Notation of quarterly figures; in this report, the financial figures are basically the cumulative total of the quarters. The cumulative Q3 means the total for the first three quarters. Wherever events and figures for the third quarter only are referred to, they are shown as Q3 or Q3 alone.
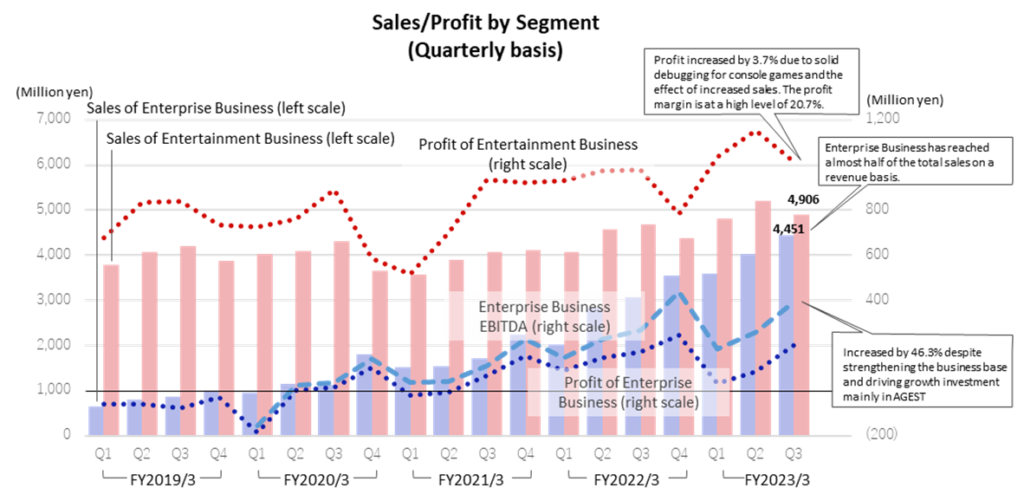
2) Entertainment Business: 12.2% increase in sales (14,926 million yen) and 11.1% increase in segment profit
The company steadily captured increasing demand, which is being driven by the booming console games market and accelerated overseas development of content. Sales of both Domestic debugging and Global and others increased by more than 10%. Segment profit increased by 11.1% thanks to higher Domestic debugging sales and improved gross margins. The profit margin remained high at 21.5%.
Domestic debugging: sales: 10,116 million yen (+11.1%). The development of new titles in the console game market has been active. Sales to console games increased significantly, up 1.4 times YoY. New titles are becoming larger in size, and the scale of debugging projects is therefore expanding. In Q3, sales remained high, despite the backlash from the busy first half of the year. Gross profit margins also remained above 30%, despite the impact of minimum wage increases. The company plans to increase the hourly rate of part-timers by 100 yen from April 2023, which is aimed at attracting the best talent in an inflationary environment. It intends to realise price increases by improving service quality through recruitment and minimising the impact of lower profits due to higher costs.
Global and others: sales: 4,809 million yen (+14.6%). The outlook for the Asian gaming market is becoming increasingly uncertain, particularly in China. Despite this environment, the company grew revenue in Global, Creative, Media and others services by strengthening group cooperation. Overall, the company achieved a 14.6% increase in revenue. In addition to pursuing synergies amongst DIGITAL HEARTS CROSS group and overseas subsidiaries, the company plans to expand its business in Asia and create new value by strengthening initiatives with alliance partners, including GameWith, with whom the company has newly formed a capital and business alliance.
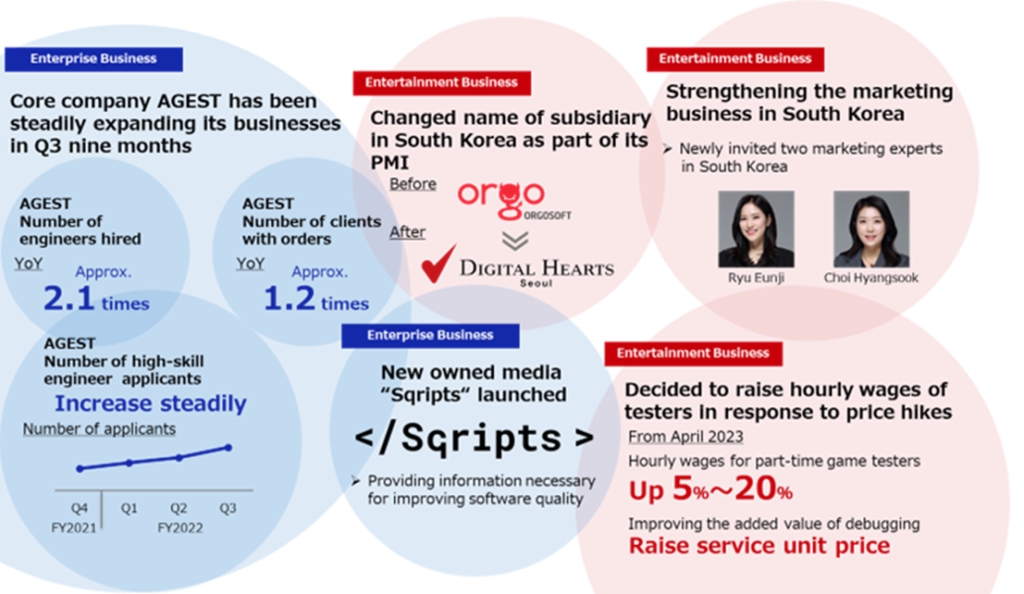
◇ Topics in Q3 FY2023/3
See the chart on the next page for Q3 topics.
Firstly, in Enterprise Business, which will drive the company’s growth, strategic investment was concentrated in the 1H of the year to establish the business foundation of AGEST. The results of the effort are showing up in profits. In addition to the “Digital Hearts” brand, which is well established in the debugging market, the company is also aiming to firmly build up the “AGEST” brand in the field of software testing as well. In recent years it appears to have positively affected the hiring of high-skilled engineers.
Meanwhile, in Entertainment Business, the company continues to promote strengthening its business base, particularly in the global market. In addition to changing the trade name of its Korean subsidiary, the company has invited Ms Ryu Eunji and Ms Choi Hyangsook, who have extensive experience and achievements in the field, to strengthen its marketing business in South Korea.
In the domestic debugging business, in response to the current inflationary trend, an increase in hourly wages for part-time workers is scheduled to be implemented in April 2023. On an hourly wage basis, the company plans to increase the hourly wage by 100 yen for some of part-time game testers and 50 yen up as a minimum raise. The company intends to absorb the cost increase by raising the unit price of orders by proposing plans to optimise operational efficiency and costs for the entire project and by increasing the added value of services through the continued employment of excellent testers.
Topics in Q3 FY2023/3
◇ FY2023/3 full-year forecasts: initial guidance is left unchanged.
The progress ratios against the full-year company forecast as at the end of Q3 are shown in the chart below; Sales 76%, operating profit 65%, net profit attributable to owners of the parent 62%, EBITDA 70%. Progress of sales in Enterprise Business is 78%, and as solid growth is expected to continue in Q4, sales are likely to come in on the upside.
SG&A expenses have risen due to an increase in the number of newly consolidated subsidiaries as a consequence of M&As and strategic investments made in Enterprise Business. However, in 2H, while strategic investments will continue in AGEST, rigid cost control is planned in other subsidiaries. Furthermore, an improvement in profit margins is expected in line with the increase in sales. The sales shortfall at overseas subsidiaries in Q3 is considered temporary, and recovery is anticipated from Q4 onwards. With all these factors, although operating profit in the cumulative Q3 appears to have been slightly weaker than the initial forecasts, there is still potential for improving profitability in Q4, partly due to sales expansion in the solid domestic Enterprise Business. Against this background, the company appears to have left its initial full-year forecasts unchanged.
Progress ratios against the FY2022 targets
◇ Share price: Under adjustment, but a reappraisal is expected
On February 10, the day after the February 9 results announcement, the company‘s share price fell 11.4%. The share price subsequently continued to adjust, reaching the level almost a year ago. The share price adjustment is thought to have been caused by the fact that the progress in operating profit was not as good as other indicators and that the profit margin on Enterprise Business was only 4.5% (Q3 alone). These were below market expectations.
However, as per the medium to long term, in Enterprise Business, a growth driver, sales are growing consistently, mainly in the core domestic market, so the measures implemented in the current fiscal year are steadily producing results. In light of this, the current share price level should be attractive for investors with a medium- to long-term stance, as shown below.
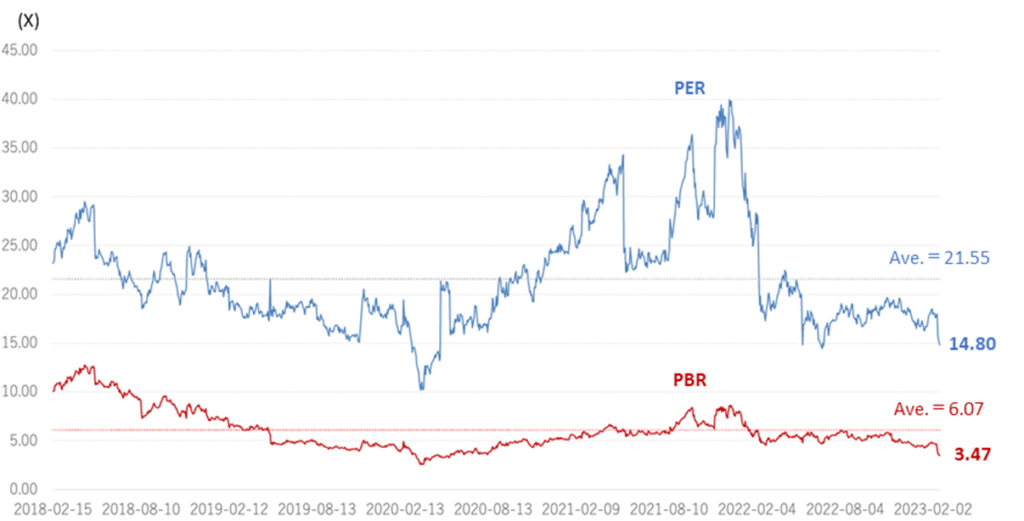
As we have seen, valuations of the company’s shares remain below the historical average (see chart below). As mentioned, the company’s Enterprise Business has grown to almost 50% of sales in Q3, and the business transformation that the company has been undertaking over the past few years is showing clear results. The business is also making a noticeable contribution to profits, and the company’s earnings power is expected to increase further. Hence, we expect the share price to be revalued.
Digital Hearts Holdings (3676) Share Price Trend (3Year-to-date)
Historical PER/PBR (five years)
Financial data I
2020/3 |
2021/3 |
2022/3 |
2023/3 |
||||||||||||
1Q |
2Q |
3Q |
4Q |
1Q |
2Q |
3Q |
4Q |
1Q |
2Q |
3Q |
4Q |
1Q |
2Q |
3Q |
|
[Sales by segment] |
|||||||||||||||
Net sales |
4,988 |
5,234 |
5,455 |
5,460 |
5,093 |
5,437 |
5,782 |
6,355 |
6,098 |
7,400 |
7,747 |
7,932 |
8,372 |
9,190 |
9,316 |
YoY |
12.1% |
7.2% |
7.8% |
15.0% |
2.1% |
3.9% |
6.0% |
16.4% |
19.7% |
36.1% |
34.0% |
24.8% |
37.3% |
24.2% |
20.3% |
Enterprise business |
954 |
1,140 |
1,133 |
1,794 |
1,523 |
1,540 |
1,710 |
2,246 |
2,029 |
2,833 |
3,074 |
3,553 |
3,589 |
4,025 |
4,451 |
YoY |
46.3% |
41.5% |
32.0% |
82.5% |
59.6% |
35.1% |
50.9% |
25.2% |
33.2% |
83.9% |
79.7% |
58.2% |
76.8% |
42.0% |
44.8% |
Composition of sales |
19.1% |
21.8% |
20.8% |
32.9% |
29.9% |
28.3% |
29.6% |
35.3% |
33.3% |
38.3% |
39.7% |
44.8% |
42.9% |
43.8% |
47.8% |
New sub-segments |
|||||||||||||||
QA solutions |
1,129 |
1,127 |
1,267 |
1,633 |
1,395 |
1,572 |
1,772 |
2,121 |
2,102 |
2,481 |
2,730 |
||||
YoY |
– |
– |
– |
– |
23.6% |
39.5% |
39.9% |
29.9% |
50.7% |
57.8% |
54.1% |
||||
Composition of sales |
22.2% |
20.7% |
21.9% |
25.7% |
22.9% |
21.2% |
22.9% |
26.7% |
25.1% |
27.0% |
29.3% |
||||
IT services and others |
393 |
413 |
442 |
613 |
634 |
1,260 |
1,301 |
1,432 |
1,486 |
1,543 |
1,721 |
||||
YoY |
– |
– |
– |
– |
61.3% |
205.1% |
194.3% |
133.6% |
134.3% |
22.4% |
32.3% |
||||
Composition of sales |
7.7% |
7.6% |
7.6% |
9.6% |
10.4% |
17.0% |
16.8% |
18.1% |
17.7% |
16.8% |
18.5% |
||||
Old sub-segments |
|||||||||||||||
System testing |
430 |
570 |
488 |
924 |
788 |
777 |
937 |
1,078 |
1,018 |
1,144 |
1,233 |
1,558 |
– |
– |
– |
YoY |
65.8% |
99.5% |
33.5% |
91.4% |
83.1% |
36.2% |
92.0% |
16.7% |
29.2% |
47.2% |
31.5% |
44.5% |
– |
– |
– |
Composition of sales |
8.6% |
10.9% |
8.9% |
16.9% |
15.5% |
14.3% |
16.2% |
17.0% |
16.7% |
15.5% |
15.9% |
19.6% |
– |
– |
– |
IT services / Security |
523 |
569 |
645 |
869 |
735 |
763 |
772 |
1,167 |
1,011 |
1,688 |
1,841 |
1,995 |
– |
– |
– |
YoY |
33.4% |
9.5% |
30.9% |
73.9% |
40.4% |
34.1% |
19.8% |
34.3% |
37.5% |
121.2% |
138.2% |
70.9% |
– |
– |
– |
Composition of sales |
10.5% |
10.9% |
11.8% |
15.9% |
14.4% |
14.0% |
13.4% |
18.4% |
16.6% |
22.8% |
23.8% |
25.2% |
– |
– |
– |
Entertainment business |
4,033 |
4,093 |
4,321 |
3,666 |
3,566 |
3,900 |
4,072 |
4,109 |
4,069 |
4,566 |
4,672 |
4,378 |
4,818 |
5,201 |
4,906 |
YoY |
6.2% |
0.5% |
2.9% |
-5.4% |
-11.6% |
-4.7% |
-5.8% |
12.1% |
14.0% |
17.1% |
14.7% |
6.6% |
18.4% |
13.9% |
5.0% |
Composition of sales |
80.9% |
78.2% |
79.2% |
67.1% |
70.0% |
71.7% |
70.4% |
64.7% |
66.7% |
61.7% |
60.3% |
55.2% |
57.6% |
56.6% |
52.7% |
New sub-segments |
|||||||||||||||
Domestic debugging |
2,681 |
2,846 |
2,953 |
3,054 |
2,931 |
3,030 |
3,149 |
3,011 |
3,334 |
3,561 |
3,220 |
||||
YoY |
– |
– |
– |
– |
9.3% |
6.4% |
6.7% |
-1.4% |
13.7% |
17.5% |
2.2% |
||||
Composition of sales |
52.7% |
52.4% |
51.1% |
48.1% |
48.1% |
41.0% |
40.7% |
38.0% |
39.8% |
38.8% |
34.6% |
||||
Global and others |
887 |
1,050 |
1,118 |
1,054 |
1,137 |
1,536 |
1,522 |
1,366 |
1,484 |
1,640 |
1,685 |
||||
YoY |
– |
– |
– |
– |
28.2% |
46.3% |
36.1% |
29.6% |
30.4% |
6.8% |
10.7% |
||||
Composition of sales |
17.4% |
19.3% |
19.3% |
16.6% |
18.7% |
20.8% |
19.7% |
17.2% |
17.7% |
17.8% |
18.1% |
||||
Old sub-segments |
|||||||||||||||
Debugging |
3,444 |
3,480 |
3,730 |
3,167 |
3,023 |
3,235 |
3,375 |
3,424 |
– |
– |
– |
– |
– |
– |
– |
YoY |
10.8% |
6.0% |
6.8% |
-1.5% |
-12.2% |
-7.0% |
-9.5% |
8.1% |
– |
– |
– |
– |
– |
– |
– |
Composition of sales |
69.1% |
66.5% |
68.4% |
58.0% |
59.4% |
59.5% |
58.4% |
53.9% |
– |
– |
– |
– |
– |
– |
– |
Game Consoles |
1,186 |
1,056 |
1,341 |
1,126 |
1,023 |
1,147 |
1,258 |
1,402 |
– |
– |
– |
– |
– |
– |
– |
YoY |
21.1% |
5.4% |
15.9% |
10.7% |
-13.7% |
8.6% |
-6.2% |
24.5% |
– |
– |
– |
– |
– |
– |
– |
Composition of sales |
23.8% |
20.2% |
24.6% |
20.6% |
20.1% |
21.1% |
21.8% |
22.1% |
– |
– |
– |
– |
– |
– |
– |
Mobile solutions |
2,013 |
2,171 |
2,141 |
1,848 |
1,819 |
1,959 |
2,005 |
1,870 |
– |
– |
– |
– |
– |
– |
– |
YoY |
1.0% |
1.7% |
2.0% |
-4.9% |
-9.6% |
-9.8% |
-6.4% |
1.2% |
– |
– |
– |
– |
– |
– |
– |
Composition of sales |
40.4% |
41.5% |
39.2% |
33.8% |
35.7% |
36.0% |
34.7% |
29.4% |
– |
– |
– |
– |
– |
– |
– |
Amusement |
245 |
253 |
248 |
193 |
179 |
130 |
111 |
153 |
– |
– |
– |
– |
– |
– |
– |
YoY |
77.5% |
75.7% |
4.6% |
-24.3% |
-26.9% |
-48.6% |
-55.2% |
-20.7% |
– |
– |
– |
– |
– |
– |
– |
Composition of sales |
4.9% |
4.8% |
4.5% |
3.5% |
3.5% |
2.4% |
1.9% |
2.4% |
– |
– |
– |
– |
– |
– |
– |
Creative |
350 |
307 |
282 |
285 |
311 |
367 |
372 |
398 |
– |
– |
– |
– |
– |
– |
– |
YoY |
-31.4% |
-45.2% |
-33.1% |
-27.6% |
-11.2% |
19.6% |
32.0% |
39.2% |
– |
– |
– |
– |
– |
– |
– |
Composition of sales |
7.0% |
5.9% |
5.2% |
5.2% |
6.1% |
6.8% |
6.4% |
6.3% |
– |
– |
– |
– |
– |
– |
– |
Media and others |
238 |
306 |
308 |
212 |
234 |
294 |
324 |
286 |
– |
– |
– |
– |
– |
– |
– |
YoY |
35.5% |
32.6% |
8.7% |
-19.4% |
-1.5% |
-3.9% |
5.0% |
34.5% |
– |
– |
– |
– |
– |
– |
– |
Composition of sales |
4.8% |
5.9% |
5.7% |
3.9% |
4.6% |
5.4% |
5.6% |
4.5% |
– |
– |
– |
– |
– |
– |
– |
Operating profit |
189 |
328 |
547 |
327 |
158 |
369 |
655 |
725 |
636 |
733 |
753 |
577 |
639 |
743 |
757 |
YoY |
-37.2% |
-30.9% |
18.0% |
-9.9% |
-16.4% |
12.4% |
19.7% |
121.3% |
301.3% |
98.5% |
14.9% |
-20.4% |
0.5% |
1.3% |
0.6% |
Operating profit margin |
3.8% |
6.3% |
10.0% |
6.0% |
3.1% |
6.8% |
11.3% |
11.4% |
10.4% |
9.9% |
9.7% |
7.3% |
7.6% |
8.1% |
8.1% |
Enterprise business |
-184 |
2 |
14 |
100 |
-21 |
-7 |
64 |
152 |
87 |
144 |
171 |
246 |
29 |
84 |
199 |
YoY |
– |
– |
– |
– |
– |
– |
363.5% |
52.4% |
– |
– |
163.8% |
61.9% |
-66.2% |
-41.5% |
16.8% |
Segment profit margin |
-19.4% |
0.3% |
1.2% |
5.6% |
-1.4% |
-0.5% |
3.8% |
6.8% |
4.3% |
5.1% |
5.6% |
6.9% |
0.8% |
2.1% |
4.5% |
Entertainment business |
727 |
760 |
891 |
585 |
517 |
700 |
936 |
923 |
930 |
975 |
978 |
783 |
1,036 |
1,155 |
1,014 |
YoY |
7.3% |
-8.8% |
6.1% |
-20.3% |
-28.9% |
-8.0% |
5.0% |
57.9% |
79.9% |
39.3% |
4.5% |
-15.2% |
11.4% |
18.5% |
3.7% |
Segment profit margin |
18.0% |
18.6% |
20.6% |
16.0% |
14.5% |
18.0% |
23.0% |
22.5% |
22.9% |
21.4% |
20.9% |
17.9% |
21.5% |
22.2% |
20.7% |
Note) The sum of this table’s segment sales and operating profit may not match the consolidated results, as there are some sales and operating profit adjustments.
ource: Omega Investment, based on company data.
Financial data II
2020/3 |
2021/3 |
2022/3 |
2023/3 |
||||||||||||
1Q |
2Q |
3Q |
4Q |
1Q |
2Q |
3Q |
4Q |
1Q |
2Q |
3Q |
4Q |
1Q |
2Q |
3Q |
|
[Statements of income] |
|||||||||||||||
Net sales |
4,988 |
5,234 |
5,455 |
5,460 |
5,093 |
5,437 |
5,782 |
6,355 |
6,098 |
7,400 |
7,747 |
7,932 |
8,372 |
9,190 |
9,316 |
Cost of sales |
3,772 |
3,830 |
3,949 |
3,953 |
3,819 |
4,002 |
4,001 |
4,700 |
4,271 |
5,290 |
5,579 |
5,645 |
5,899 |
6,478 |
6,690 |
Gross profit |
1,216 |
1,403 |
1,506 |
1,507 |
1,273 |
1,437 |
1,781 |
1,655 |
1,827 |
2,109 |
2,167 |
2,287 |
2,472 |
2,713 |
2,625 |
SG&A expenses |
1.026 |
1,074 |
958 |
959 |
1,115 |
1,067 |
1,126 |
1,150 |
1,191 |
1,375 |
1,414 |
1,709 |
1,832 |
1,970 |
1,868 |
Operating profit |
189 |
328 |
547 |
327 |
158 |
369 |
655 |
725 |
636 |
733 |
753 |
577 |
639 |
743 |
757 |
Non-operating income |
3 |
2 |
1 |
1 |
38 |
10 |
24 |
5 |
38 |
31 |
12 |
30 |
5 |
150 |
78 |
Non-operating expenses |
3 |
7 |
7 |
7 |
2 |
3 |
4 |
10 |
4 |
4 |
5 |
21 |
7 |
4 |
11 |
Ordinary profit |
189 |
323 |
542 |
542 |
194 |
376 |
675 |
720 |
670 |
760 |
759 |
587 |
637 |
889 |
824 |
Extraordinary income |
0 |
0 |
0 |
19 |
32 |
|
13 |
66 |
1 |
1 |
– |
– |
41 |
||
Extraordinary expenses |
0 |
0 |
75 |
82 |
13 |
16 |
415 |
2 |
42 |
32 |
35 |
– |
6 |
171 |
|
Net profit before income taxes |
189 |
323 |
542 |
240 |
113 |
381 |
691 |
318 |
681 |
785 |
730 |
552 |
637 |
882 |
694 |
Total income taxes |
77 |
159 |
162 |
99 |
38 |
122 |
224 |
145 |
189 |
281 |
233 |
38 |
201 |
306 |
216 |
Net profit attributable to owners
|
112 |
165 |
375 |
139 |
99 |
256 |
438 |
180 |
487 |
429 |
445 |
417 |
416 |
533 |
450 |
[Balance Sheets] |
|||||||||||||||
Current assets |
6,717 |
7,574 |
7,710 |
7,453 |
6,648 |
7,291 |
8,017 |
9,744 |
9,604 |
9,848 |
10,658 |
10,392 |
10,874 |
12,182 |
11,569 |
Cash and deposits |
3,650 |
3,849 |
3,882 |
3,739 |
3,027 |
3,482 |
4,085 |
5,076 |
4,911 |
5,435 |
5,746 |
5,208 |
5,573 |
6,850 |
5,948 |
Notes and accounts receivable |
2,677 |
3,017 |
3,013 |
2,985 |
2,889 |
3,099 |
3,201 |
4,097 |
|||||||
Notes, accounts receivable andcontract assets |
4,161 |
3,872 |
4,372 |
4,411 |
4,614 |
4,672 |
4,930 |
||||||||
Non-current assets |
2,481 |
3,252 |
3,227 |
3,184 |
3,205 |
3,167 |
3,160 |
4,593 |
6,321 |
6,178 |
6,342 |
7,172 |
8,158 |
8,505 |
8,343 |
Tangible fixed assets |
545 |
646 |
627 |
579 |
560 |
549 |
565 |
598 |
602 |
623 |
621 |
693 |
1,067 |
1,077 |
1,100 |
Intangible fixed assets |
793 |
1,404 |
1,390 |
1,379 |
1,445 |
1,424 |
1,433 |
2,670 |
4,389 |
4,244 |
4,225 |
5,094 |
5,206 |
5,750 |
5,593 |
Goodwill |
491 |
1,066 |
1,033 |
1,027 |
1,032 |
991 |
950 |
2,467 |
4,175 |
4,042 |
3,945 |
4,763 |
4,812 |
5,301 |
5,082 |
Investments and other assets |
1,142 |
1,202 |
1,209 |
1,225 |
1,199 |
1,193 |
1,161 |
1,324 |
1,330 |
1,309 |
1,495 |
1,384 |
1,883 |
1,678 |
1,649 |
Total assets |
9,199 |
10,827 |
10,938 |
10,637 |
9,854 |
10,459 |
11,177 |
14,338 |
15,925 |
16,026 |
17,001 |
17,565 |
19,033 |
20,688 |
19,913 |
Current liabilities |
3,621 |
4,679 |
4,863 |
5,135 |
4,450 |
4,655 |
5,061 |
7,904 |
8,954 |
8,775 |
9,354 |
9,679 |
10,759 |
11,330 |
9,495 |
Short-term borrowings |
1,704 |
2,504 |
2,506 |
2,546 |
2,546 |
2,551 |
2,552 |
4,728 |
5,534 |
5,406 |
5,406 |
5,421 |
6,806 |
– |
5,106 |
Non-current liabilities |
622 |
624 |
629 |
63 |
62 |
132 |
135 |
119 |
294 |
55 |
58 |
309 |
162 |
154 |
113 |
Long-term debt |
48 |
46 |
48 |
– |
– |
66 |
65 |
63 |
236 |
– |
– |
169 |
– |
– |
– |
Total liabilities |
4,243 |
5,304 |
5,493 |
5,198 |
4,513 |
4,788 |
5,196 |
8,024 |
9,249 |
8,830 |
9,413 |
9,989 |
10,921 |
11,485 |
9,608 |
Total net assets |
4,955 |
5,523 |
5,445 |
5,438 |
5,340 |
5,670 |
5,980 |
6,314 |
6,677 |
7,196 |
7,588 |
7,576 |
8,111 |
9,202 |
10,304 |
Shareholders’ equity |
4,734 |
5,039 |
4,919 |
4,898 |
4,841 |
5,172 |
5,460 |
5,642 |
5,983 |
6,436 |
6,719 |
6,776 |
7,030 |
7,779 |
8,838 |
Capital |
300 |
300 |
300 |
300 |
300 |
300 |
300 |
300 |
300 |
300 |
300 |
300 |
300 |
300 |
300 |
Legal capital reserve |
366 |
357 |
357 |
355 |
355 |
331 |
331 |
331 |
331 |
338 |
338 |
– |
– |
60 |
375 |
Retained earnings |
6,378 |
6,543 |
6,765 |
6,904 |
6,848 |
7,105 |
7,393 |
7,575 |
7,916 |
8,342 |
8,626 |
9,021 |
9,275 |
9,809 |
10,031 |
Treasury shares |
-2,311 |
-2,162 |
-2,503 |
-2,662 |
-2,662 |
-2,565 |
-2,565 |
-2,565 |
-2,565 |
-2,545 |
-2,546 |
-2,545 |
-2,545 |
-2,391 |
-1,868 |
Stock acquisition right |
13 |
13 |
13 |
13 |
13 |
13 |
13 |
13 |
– |
– |
– |
– |
– |
10 |
6 |
Total liabilities and net assets |
9,199 |
10,827 |
10,938 |
10,637 |
9,854 |
10,459 |
11,177 |
14,338 |
15,925 |
16,026 |
17,001 |
17,565 |
19,033 |
20,688 |
19,913 |
[Statements of cash flows] |
|||||||||||||||
Cash flow from operating activities |
-5 |
1,086 |
101 |
1,416 |
1,703 |
3,077 |
1,430 |
||||||||
Net profit before tax and otheradjustments |
513 |
1,296 |
494 |
1,504 |
1,466 |
2,749 |
1,520 |
||||||||
Cash flow from investing activities |
-963 |
1,018 |
-261 |
-1,813 |
-1,682 |
-2,537 |
-1,496 |
||||||||
Cash flow from financing activities |
|
637 |
|
-515 |
|
-90 |
|
1,730 |
|
316 |
-546 |
1,488 |
|||
Free cash flow |
958 |
68 |
362 |
3,229 |
3,385 |
5,614 |
2,926 |
||||||||
Net increase (decrease) in cash and
|
-347 |
-458 |
-252 |
1,341 |
359 |
132 |
1,676 |
||||||||
Cash and cash equivalents at beginning
|
4,162 |
4,162 |
3,704 |
3,704 |
5,041 |
5.041 |
5,173 |
||||||||
Cash and cash equivalents at end of
|
3,814 |
3,704 |
3,447 |
5,041 |
5,400 |
5,173 |
6,850 |
Source: Omega Investment, based on company data.