2026-07-15
Home
Japanese

Omega Investment Co., Ltd.
Sansei Landic (Company Note 4Q update)

| Share price (3/14) | ¥821 | Dividend Yield (23/12 CE) | 3.53 % |
| 52weeks high/low | ¥921/800 | ROE(TTM) | 9.93 % |
| Avg Vol (3 month) | 12.9 thou shrs | Operating margin (22/9) | 9.46 % |
| Market Cap | ¥6.99 bn | Beta (5Y Monthly) | 0.55 |
| Enterprise Value | ¥14.68 bn | Shares Outstanding | 8.520 mn shrs |
| PER (23/12 CE) | 8.00 X | Listed market | TSE Standard |
| PBR (22/12 act) | 0.61 X |
| Click here for the PDF version of this page |
| PDF Version |
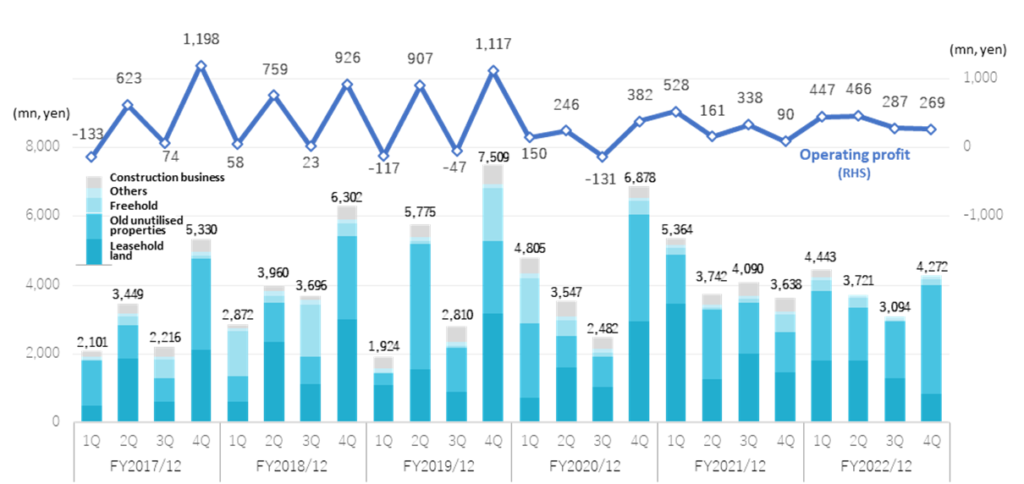
Despite a decline in sales, profits increased as profit margins improved. The real estate inventory for sale reached an unprecedented level due to a significant increase in the purchase.
◇Operating profit increased by 30% due to improved profit margins despite a fall in sales. Inventory volume hit a record high
In FY12/2022, Sansei Landic’s sales declined by 8% YoY, but operating profit increased by 32% as the profit margin exceeded expectations thanks to the robust property market and cost reductions. Sales of Leasehold land, Old unutilised properties and Freehold fell short of the company estimates, but sales of Old unutilised properties went up by 40% YoY, a significant increase. In addition, there was a significant increase in the purchase of real estate for sale, particularly for old unutlised properties. Real estate for sale at the end of FY12/2022 reached an unprecedented level of 23.6 billion yen, further confirming the sales growth from FY12/2023 onwards.
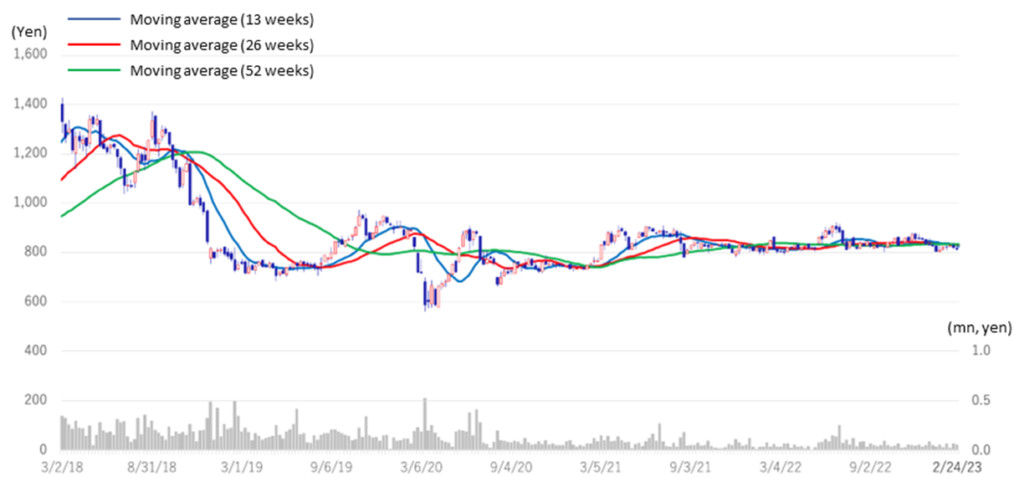
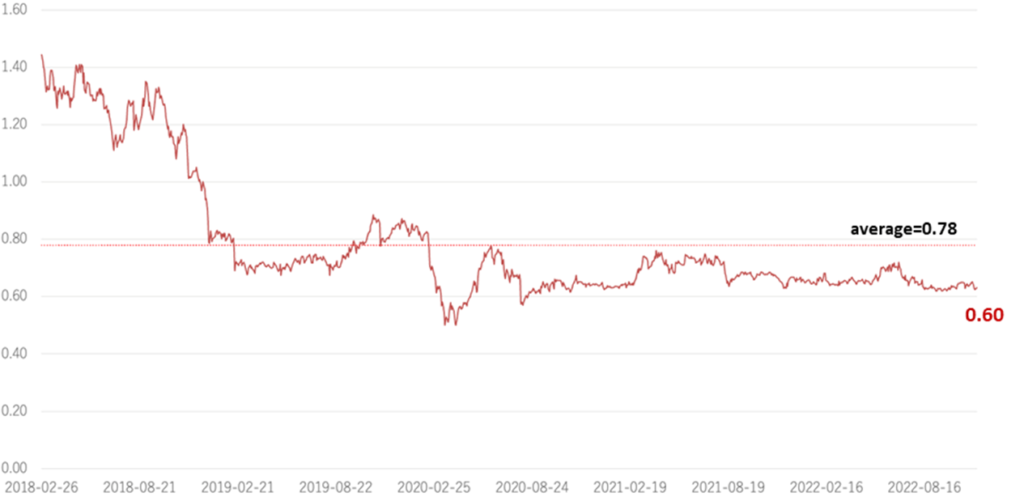
In the meantime, the company’s share price has remained in the 800-900 yen range for the past few years. Solid earnings growth is expected from FY12/2023 onwards, driven by a strong property market and a high inventory of real estate for sale. Given the low price to book, the shares look attractive.
◇Results for FY12/2022: Decrease in sales and profit; real estate inventories for sale at 23.6 billion yen
The company’s full-year results for FY12/2022 show sales of 15,533 million yen, a decrease of 7.7% YoY. As previously reported, the company transferred its construction business at the end of March 2022, and sales from that business are excluded for the April-December period (sales for the construction business during April-December of FY2021/12 were about 1.1 billion yen). Excluding this effect, sales in the real estate business alone were almost flat YoY, and in line with the revised company forecasts revealed on 16 January 2023. Regarding profits, the profit margins of both Leasehold land and Old unutilised properties came in higher than anticipated. Operating profit increased by 31.5% to 1,469 million yen thanks to the robust real estate market, cost reductions and marketing efforts. Net profit ATOP (attributable to owners of parent) increased significantly as corporate income tax decreased by more than 200 million yen due to the above-mentioned transfer of shares of the construction business subsidiary.
The real estate industry, which is focused on face-to-face sales, was significantly affected by the outbreak of COVID-19 at the beginning of 2020. The company has taken many measures to combat the infection, including introducing a remote working system, and has almost returned to normal business conditions. As a result, the number of projects has recovered to levels above pre-infection levels. Consequently, the purchase and inventory of real estate for sale have increased significantly.
In the past, the company’s sales tended to be higher in the 2Q and 4Q (see chart above), but since FY2021/12, sales have levelled off each quarter.
In the BS, real estate for sale has increased significantly by 10,356 million to 23,657 million yen since the end of FY2021/12. Interest-bearing debt increased by 8,291 million yen to 16,399 million yen due to a significant increase in purchases. As a result, total assets increased by 8,926 million yen to 28,976 million yen. The liability increase resulted in a 13.3 percentage point fall in the equity ratio to 38.1%.
| JPY, mn | Net sales | YoY % |
Oper. profit |
YoY % |
Ord. profit |
YoY % |
Profit ATOP |
YoY % |
EPS (¥) |
DPS (¥) |
| 2018/12 | 16,833 | 28.5 | 1,765 | 0.2 | 1,642 | 7.0 | 1,006 | -9.4 | 119.62 | 21.00 |
| 2019/12 | 18,020 | 7.1 | 1,860 | 5.4 | 1,758 | 7.0 | 1,158 | 15.1 | 137.08 | 23.00 |
| 2020/12 | 17,774 | -1.4 | 847 | -54.5 | 709 | -59.7 | 357 | -69.1 | 42.34 | 25.00 |
| 2021/12 | 16,836 | -5.3 | 1,117 | 31.9 | 999 | 40.9 | 609 | 70.5 | 73.56 | 26.00 |
| 2022/12 | 15,513 | -7.7 | 1,469 | 31.5 | 1,283 | 28.4 | 1,060 | 73.9 | 129.61 | 28.00 |
| 2023/12 (CE) | 17,119 | 10.2 | 1,594 | 8.5 | 1,305 | 1.7 | 836 | -21.1 | 102.68 | 29.00 |
Quarterly sales and operating profit
- Segment trends
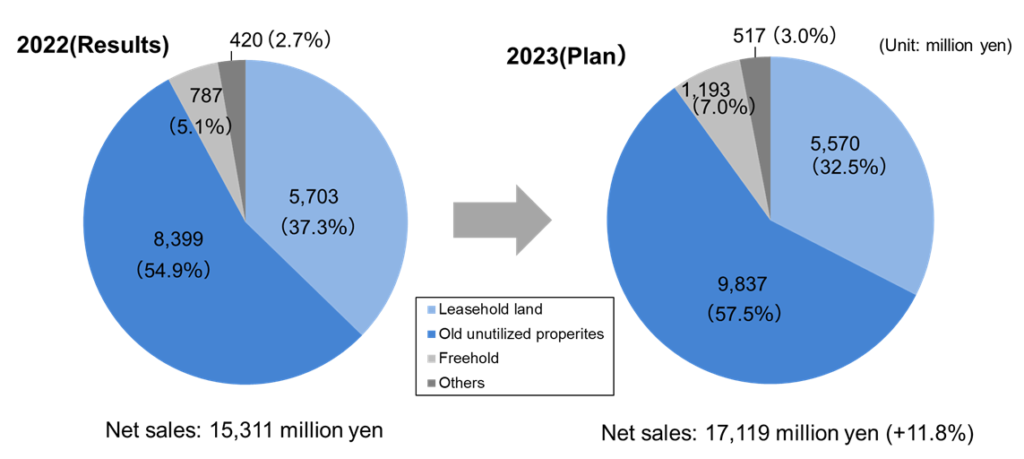
Sales in the Real estate sales business were 15,311 million yen (-1.4%). Sales of Leasehold land and Freehold fell YoY and were below the company estimates. Although sales of Old unutilised properties also undercut the company forecast, they were significantly higher YoY. The company’s business model includes some large-scale deals, which take time to close, so sales fluctuate due to delays in sales booking and other factors. Therefore, the underachievement vis-a-vis the company plan should be considered a minor concern. Segment profit increased by 19.9% to 2,797 million yen. Profit margins are improving against the backdrop of a solid property market.
Leasehold land: Sales were 5,703 million yen (-30.5%). Last year’s results included a large property mixed with old unutilised properties, which led to a significant decrease. Sales were 9.6% below the company’s forecasts. The number of deals decreased by 14.5% to 294. The profit margin exceeded expectations, and profits were way higher than anticipated.
Old unutilised properties: Sales recorded 8,399 million yen (+38.1%). Sales rose YoY but were 10.3% below the company plan. The number of deals counted 42, declining 26.3% YoY. In addition to Greater Tokyo, the development of new projects for old unutilised properties progressed in Western Japan. This has been reflected in the recent strong performance of Old unutilised properties business.
Freehold: Sales were 787 million yen (-8.9%). Profits were largely in line with expectations, although sales came in 8.9% below the company estimate. The number of deals more than doubled to 18.
- Purchase of real estate for sales: Large increases in each segment, reaching a record high
The purchase for the Real estate sales business increased significantly by 104.0% to 20,636 million (10,118 million last year). The breakdown is 7,274 million yen (+62.6%) for Leasehold land business, 11,979 million yen (+155.5%) for Old unutilised properties business and 1,383 million yen (+44.8%) for Freehold business.
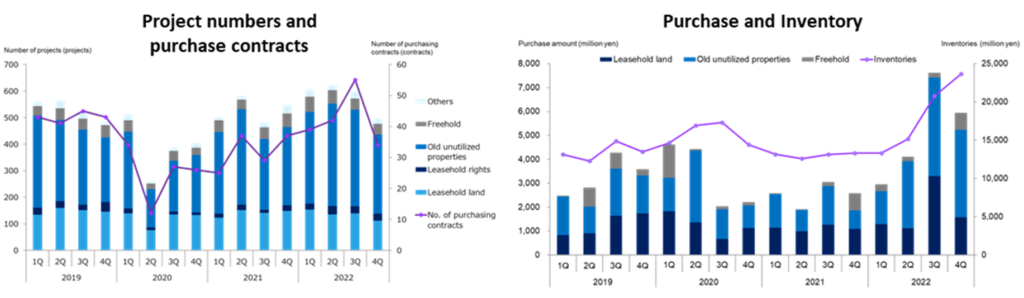
On top of the robust property market, the company has expanded the number of large properties requiring a rights adjustment period of more than one-year with managing risk. And it has been successful in the strategic broadening of business areas. These have resulted in a significant increase in purchases.
A sudden increase in inventories raises concerns over whether the company has the sales capacity to sell out and whether unsold items will become bad stock. However, the company states that it has no such concerns as it is proceeding cautiously with purchases and is increasing inventories in anticipation of sales in the next fiscal year and beyond. More than 80% of the properties were purchased less than a year ago, and the portfolio is regionally diversified with the metropolitan area (40%, composition at the end of December 2022), Western Japan (25%), Central Japan (26%) and Northern Japan (9%).
The above right-hand chart shows the trend of the company’s Real estate sales business in terms of sales and purchases. The purchase has been low since 3Q FY2020 due to a slowdown in sales activities caused by COVID-19. However, it has been recovering since FY2022. Purchasing has been particularly strong in the current 3Q, suggesting the company has secured the foundations for earnings growth in the coming years and beyond.
◇Forecasts for FY12/2023: 10% rise in sales and 8.5% increase in operating profit
For FY12/2023, the company forecasts a 10.2% increase in sales to 17,119 million yen, an 8.5% increase in operating profit to 1,594 million yen and a 21.1% decrease in net profit ATOP to 836 million yen. The decreasing net income is a reversal of the significant increase in net income in FY2022/12 due to a decrease in corporate tax, as mentioned. Excluding this impact, profit will grow YoY. Given the current high property inventories, this forecast looks conservative. The company plans to pay a dividend of 29 yen a share at the end of FY12/2023, the 10th consecutive year of a dividend hike.
Real estate sales business – sales forecast by business segment
Progress of the Medium-term Plan (2022 – 2024)
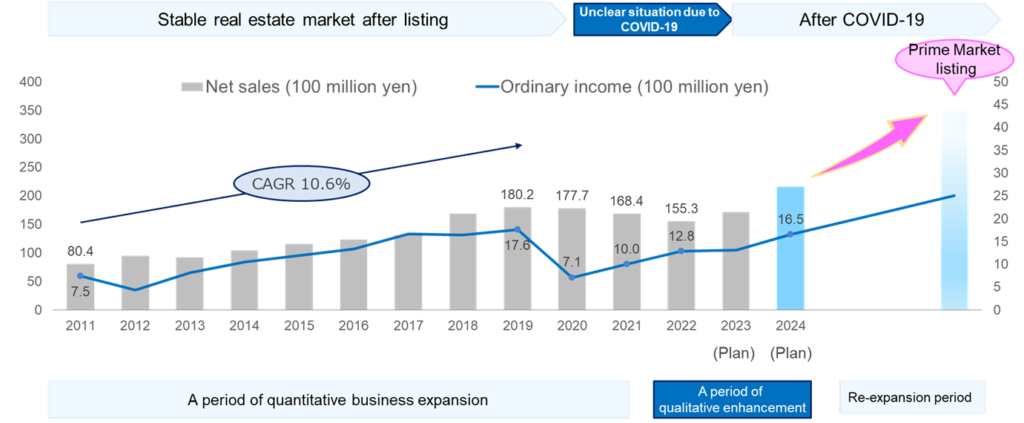
◇ Progress of the Medium-term Plan (2022 – 2024)
On 14 February 2022, the company announced its new medium-term plan (2022-2024), ‘Transformation to 2024’. The plan reviews the previous medium-term plan and reveals the company’s targets for 2024 and the direction of the company’s future. The company has achieved sales growth at a CAGR of 10.6% between 2011 and 2019, but due to COVID-19, sales continued to decline in 2020 and 2021. In the new medium-term plan, the company has set the period 2022-2024 as a period of qualitative reinforcement after the temporary stagnation caused by the pandemic disease. It has set an operating profit target of 1.8 billion yen for FY2024 (FY2022 actual: 1.47 billion yen). In addition, the company intends to realise new growth by strengthening its financial base and accelerating up-front investment to list in the TSE Prime market.
Specifically, the company plans to: 1) expand existing businesses, 2) expand its business domains, and 3) strengthen its management foundation. For each of these three, the company has stated the following.
(1) Concerning expanding existing businesses, the company will build a stable organisation-led sales infrastructure from an individual-led one and promote the structuring of sales activities through data analysis and sales management. A new sales structure will be established for the post-pandemic period.
(2) To expand business domains, in addition to working on new schemes in existing businesses, the company aims to pursue regional redevelopment projects, M&A and alliances actively.
(3) Strengthening the management base will be achieved by strengthening the governance, reviewing the back-office structure, reinforcing the financial base and reforming human resource management.
The company also clarified its ROE policy, with a target of 9.0% or more for FY12/2024. The company’s ROE for FY12/2022 was 7.8%, normalising corporate taxation. However, the company has achieved above 10% in the past and should be able to achieve a much higher ROE.
◇ Share price: Remains cheap, considering growth expectations for the next fiscal year and beyond
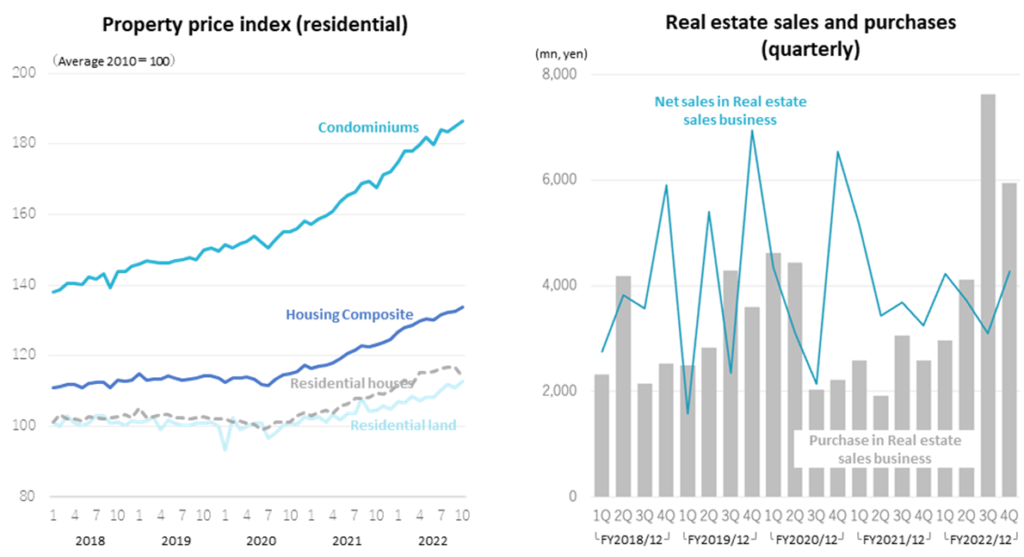
The company’s share price has been in a box of 800-900 yen for the past few years. This is because it was difficult to see the next growth story due to the stagnant periods caused by the pandemic disease. However, with a new medium-term plan, the currently robust property market, and current inventory levels, we expect the company’s earnings to return to a growth trajectory. Price-to-book is cheap (see the next page, the chart below), so the shares look attractive.
5-year stock price move
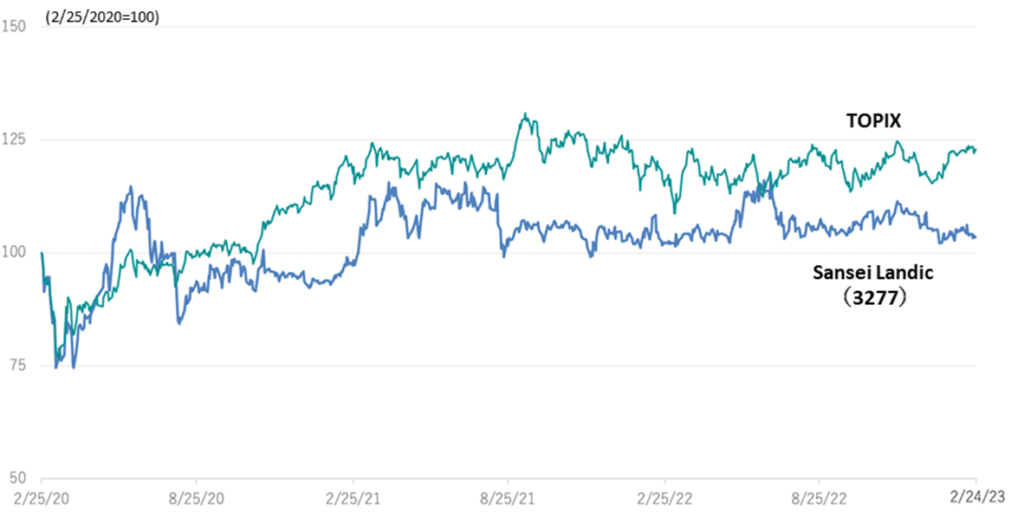
Share price compared to TOPIX (last three years)
Historical PBR (last five years)
Financial data (quarterly)
FY (¥mn) |
2019/12 |
2020/12 |
2021/12 |
2022/12 |
||||||||||||
1Q |
2Q |
3Q |
4Q |
1Q |
2Q |
3Q |
4Q |
1Q |
2Q |
3Q |
4Q |
1Q |
2Q |
3Q |
4Q |
|
[Sales by segment] |
||||||||||||||||
Net sales |
1,925 |
5,775 |
2,811 |
7,507 |
4,807 |
3,546 |
2,481 |
6,938 |
5,365 |
3,744 |
4,089 |
3,637 |
4,444 |
3,721 |
3,094 |
4,272 |
Year-on-year basis |
-33.0% |
45.8% |
-23.9% |
15.0% |
149.7% |
-38.6% |
-11.7% |
-7.6% |
11.6% |
5.6% |
64.8% |
-47.6% |
-17.2% |
-0.6% |
-24.3% |
17.4% |
Real estate sales business |
1,576 |
5,396 |
2,353 |
6,941 |
4,339 |
3,092 |
2,137 |
6,543 |
5,171 |
3,434 |
3,679 |
3,244 |
4,222 |
3,721 |
3,094 |
4,272 |
Year-on-year basis |
-42.8% |
41.3% |
-33.9% |
17.5% |
175.3% |
-42.7% |
-9.2% |
-5.7% |
19.2% |
11.1% |
72.1% |
-50.4% |
-18.3% |
8.3% |
-15.9% |
31.7% |
Sales composition ratio |
81.9% |
93.4% |
83.7% |
92.5% |
90.3% |
87.2% |
86.2% |
94.3% |
96.4% |
91.7% |
90.0% |
89.2% |
95.0% |
100.0% |
100.0% |
100.0% |
Leasehold land |
1,086 |
1,546 |
889 |
3,176 |
719 |
1,613 |
1,044 |
2,950 |
3,464 |
1,267 |
2,003 |
1,474 |
1,793 |
1,794 |
1,284 |
832 |
Year-on-year basis |
77.7% |
-34.2% |
-21.5% |
6.1% |
-33.8% |
4.3% |
17.4% |
-7.1% |
381.4% |
-21.5% |
91.9% |
-50.0% |
-48.2% |
41.6% |
-35.9% |
-43.6% |
Sales composition ratio |
56.4% |
26.8% |
31.6% |
42.3% |
15.0% |
45.5% |
42.1% |
42.5% |
64.6% |
33.8% |
49.0% |
40.5% |
40.3% |
48.2% |
41.5% |
19.5% |
Old unutilised properties |
351 |
3,657 |
1,283 |
2,108 |
2,180 |
897 |
872 |
3,101 |
1,419 |
2,025 |
1,488 |
1,151 |
2,024 |
1,556 |
1,649 |
3,170 |
Year-on-year basis |
-51.6% |
225.4% |
62.0% |
-12.9% |
520.6% |
-75.5% |
-32.0% |
-47.1% |
-34.9% |
125.8% |
70.6% |
-62.9% |
42.6% |
-23.2% |
10.8% |
175.4% |
Sales composition ratio |
18.2% |
63.3% |
45.6% |
28.1% |
45.4% |
25.3% |
35.1% |
44.7% |
26.4% |
54.1% |
36.4% |
31.6% |
45.5% |
41.8% |
53.3% |
74.2% |
Freehold |
28 |
88 |
55 |
1,532 |
1,305 |
465 |
106 |
395 |
191 |
46 |
101 |
526 |
315 |
266 |
49 |
157 |
Year-on-year basis |
-97.9% |
-60.4% |
-96.4% |
290.8% |
4560.7% |
428.4% |
92.7% |
-74.2% |
-85.3% |
-90.1% |
-4.7% |
33.2% |
64.9% |
478.3% |
-51.5% |
-70.2% |
Sales composition ratio |
1.5% |
1.5% |
2.0% |
20.4% |
27.1% |
13.1% |
4.3% |
5.7% |
3.6% |
1.2% |
2.5% |
14.5% |
7.1% |
7.1% |
1.6% |
3.7% |
Others |
110 |
104 |
126 |
126 |
133 |
117 |
116 |
97 |
96 |
95 |
88 |
94 |
89 |
105 |
112 |
114 |
Year-on-year basis |
11.1% |
-14.8% |
5.0% |
21.2% |
21.5% |
12.5% |
-7.9% |
-23.0% |
-28.3% |
-18.8% |
-24.1% |
-3.1% |
-7.3% |
10.5% |
27.3% |
21.3% |
Sales composition ratio |
5.7% |
1.8% |
4.5% |
1.7% |
2.8% |
3.3% |
4.7% |
1.4% |
1.8% |
2.5% |
2.2% |
2.6% |
2.0% |
2.8% |
3.6% |
2.7% |
Construction business |
349 |
379 |
457 |
566 |
468 |
455 |
343 |
395 |
194 |
309 |
409 |
392 |
222 |
– |
– |
– |
Year-on-year basis |
202.6% |
166.5% |
246.1% |
44.0% |
34.1% |
19.8% |
-24.9% |
-30.1% |
-58.4% |
-32.1% |
19.3% |
-0.8% |
14.0% |
– |
– |
– |
Sales composition ratio |
18.1% |
6.6% |
16.3% |
7.5% |
9.7% |
12.8% |
13.8% |
5.7% |
3.6% |
8.3% |
10.0% |
10.8% |
5.0% |
– |
– |
– |
[Statements of income] |
||||||||||||||||
Net sales |
1,925 |
5,775 |
2,811 |
7,507 |
4,807 |
3,546 |
2,481 |
6,938 |
5,365 |
3,744 |
4,089 |
3,637 |
4,444 |
3,721 |
3,096 |
4,272 |
Cost of sales |
1,346 |
4,014 |
2,076 |
5,466 |
3,865 |
2,557 |
1,934 |
5,431 |
4,020 |
2,756 |
2,945 |
2,745 |
3,146 |
2,310 |
1,963 |
3,066 |
Gross profit |
579 |
1,762 |
736 |
2,042 |
942 |
989 |
548 |
1,507 |
1,344 |
986 |
1,143 |
892 |
1,297 |
1,411 |
1,132 |
1,206 |
SG&A expenses |
696 |
855 |
783 |
924 |
792 |
744 |
678 |
925 |
816 |
826 |
805 |
802 |
850 |
946 |
845 |
937 |
Operating income |
-117 |
907 |
-47 |
1,117 |
150 |
245 |
-131 |
382 |
528 |
160 |
338 |
90 |
447 |
466 |
287 |
269 |
Non-operating income |
4 |
28 |
5 |
5 |
9 |
5 |
51 |
5 |
12 |
8 |
8 |
6 |
7 |
7 |
6 |
7 |
Non-operating expenses |
34 |
38 |
32 |
40 |
55 |
63 |
60 |
10 |
37 |
40 |
34 |
39 |
39 |
55 |
54 |
64 |
Ordinary income |
-147 |
898 |
-75 |
1,083 |
103 |
188 |
-140 |
298 |
502 |
128 |
311 |
56 |
415 |
417 |
239 |
212 |
Extraordinary income |
0 |
0 |
0 |
0 |
0 |
0 |
0 |
|
3 |
0 |
0 |
0 |
19 |
0 |
0 |
1 |
Extraordinary expenses |
0 |
0 |
0 |
0 |
0 |
0 |
0 |
|
0 |
0 |
8 |
7 |
||||
Loss before income taxes |
-147 |
898 |
-75 |
1,083 |
103 |
188 |
-140 |
298 |
506 |
128 |
311 |
56 |
435 |
399 |
231 |
205 |
Total income taxes |
-35 |
312 |
-26 |
349 |
36 |
72 |
-49 |
295 |
183 |
48 |
166 |
-4 |
59 |
60 |
36 |
54 |
Net income |
-112 |
585 |
-48 |
734 |
67 |
114 |
-90 |
176 |
323 |
79 |
145 |
61 |
375 |
338 |
196 |
151 |
[Balance Sheets] |
||||||||||||||||
Current assets |
16,007 |
15,596 |
17,458 |
18,095 |
18,816 |
20,798 |
20,577 |
19,040 |
17,554 |
17,371 |
18,769 |
18,968 |
19.018 |
21,579 |
26,379 |
27,929 |
Property for sale |
13,129 |
12,290 |
14,890 |
13,493 |
14,655 |
16,923 |
17,312 |
14,424 |
13,493 |
12,586 |
13,134 |
13,301 |
13,304 |
15,152 |
20,775 |
23,657 |
Non-current assets |
1,230 |
1,206 |
1,229 |
1,199 |
1,188 |
1,164 |
1,197 |
1,030 |
951 |
1,054 |
1,081 |
1,082 |
1,124 |
1,099 |
1,129 |
1,047 |
Tangible assets |
469 |
471 |
462 |
456 |
451 |
449 |
443 |
306 |
291 |
290 |
293 |
301 |
317 |
313 |
314 |
299 |
Investments and other assets |
694 |
666 |
689 |
669 |
668 |
653 |
691 |
655 |
595 |
703 |
732 |
730 |
761 |
743 |
769 |
701 |
Total assets |
17,236 |
16,802 |
18,686 |
19,294 |
20,004 |
21,962 |
21,774 |
20,071 |
18,505 |
18,425 |
19,849 |
20,051 |
20,134 |
22,678 |
27,508 |
28,976 |
Current liabilities |
6,904 |
6,996 |
9,135 |
9,047 |
9,883 |
7,767 |
7,699 |
5,772 |
5,517 |
7,540 |
8,633 |
8,731 |
8,153 |
8,871 |
11,168 |
12,606 |
Short-term borrowings |
5,645 |
5,360 |
7,702 |
7,203 |
7,729 |
6,352 |
6,676 |
4,463 |
4,272 |
6,105 |
7,171 |
7,367 |
5,025 |
5,057 |
6,960 |
10,192 |
Non-current liabilities |
1,714 |
602 |
389 |
351 |
345 |
4,303 |
4,274 |
4,232 |
2,919 |
792 |
976 |
1,017 |
1,525 |
3,114 |
5,453 |
5,314 |
Long-Term Borrowings |
1,347 |
222 |
|
|
|
3,958 |
3,929 |
3,879 |
2,570 |
483 |
683 |
740 |
1,260 |
2,827 |
5,153 |
5,033 |
Total liabilities |
8,618 |
7,598 |
9,524 |
9,399 |
10,228 |
12,071 |
11,973 |
10,004 |
8,436 |
8,332 |
9,609 |
9,749 |
9.679 |
11,968 |
16,622 |
17,920 |
Total net assets |
8,618 |
9,204 |
9,162 |
9,895 |
9,776 |
9,891 |
9,801 |
10,067 |
10,070 |
10,093 |
10,240 |
10,301 |
10,463 |
10,692 |
10,886 |
11,056 |
Total shareholders’ equity |
8,618 |
9,204 |
9,162 |
9,895 |
9,776 |
9,891 |
9,801 |
10,067 |
10,070 |
10,093 |
10,240 |
10,297 |
10,459 |
10,688 |
10,882 |
11,052 |
Capital stock |
811 |
811 |
814 |
814 |
818 |
818 |
818 |
818 |
818 |
820 |
820 |
820 |
821 |
822 |
824 |
833 |
Legal capital reserve |
772 |
772 |
775 |
775 |
779 |
779 |
779 |
779 |
779 |
781 |
781 |
781 |
782 |
785 |
786 |
796 |
Retained earnings |
7,031 |
7,616 |
7,568 |
8,302 |
8,174 |
8,289 |
8,200 |
8,465 |
8,577 |
8,656 |
8,802 |
8,863 |
9,023 |
9,362 |
9,557 |
9,708 |
Stock acquisition right |
4 |
4 |
4 |
4 |
4 |
4 |
4 |
4 |
4 |
4 |
4 |
4 |
4 |
3 |
3 |
3 |
Total liabilities and net assets |
17,236 |
16,802 |
18,686 |
19,294 |
20,004 |
21,962 |
21,774 |
20,071 |
18,505 |
18,425 |
19,849 |
20,051 |
20,134 |
22,678 |
27,508 |
28,976 |
[Statements of cash flows] |
||||||||||||||||
Cash flow from operating activities |
-286 |
-419 |
-3,683 |
-916 |
2,110 |
1,704 |
1,184 |
-9,267 |
||||||||
Loss before income taxes |
750 |
1,758 |
291 |
712 |
635 |
1,003 |
833 |
1,269 |
||||||||
Cash flow from investing activities |
-27 |
-70 |
-9 |
-287 |
-26 |
-51 |
-205 |
-266 |
||||||||
Cash flow from financing activities |
|
-446 |
|
984 |
|
3,021 |
|
952 |
|
-2,129 |
-608 |
-559 |
7,971 |
|||
Net increase in cash and cash equiv. |
-760 |
493 |
-671 |
-251 |
-46 |
1,045 |
420 |
-1,563 |
||||||||
Cash and cash equiv. at beginning
|
3,465 |
3,465 |
3,958 |
3,958 |
3,707 |
3,707 |
4,752 |
4,752 |
||||||||
Cash and cash equiv. at end of
|
2,704 |
3,958 |
3,287 |
3,707 |
3,661 |
4,752 |
5,173 |
3,188 |
||||||||
Source: Omega Investment from Company materials.
Financial data
| FY (¥mn) | 2011/12 | 2012/12 | 2013/12 | 2014/12 | 2015/12 | 2016/12 | 2017/12 | 2018/12 | 2019/12 | 2020/12 | 2021/12 | 2022/12 |
| [Statements of income] | ||||||||||||
| Net sales | 8,042 | 9,475 | 9,187 | 10,443 | 11,567 | 12,300 | 13,098 | 16,833 | 18,020 | 17,774 | 16,836 | 15,533 |
| Cost of sales | 5,557 | 7,061 | 6,254 | 7,055 | 7,798 | 8,344 | 8,566 | 12,028 | 12,902 | 13,788 | 12,467 | 10,485 |
| Gross profit | 2,485 | 2,415 | 2,934 | 3,389 | 3,769 | 3,957 | 4,532 | 4,805 | 5,119 | 3,986 | 4,368 | 5,047 |
| SG&A expenses | 1,735 | 1,898 | 2,014 | 2,184 | 2,470 | 2,510 | 2,770 | 3,039 | 3,258 | 3,139 | 3,250 | 3,578 |
| Operating income | 750 | 517 | 920 | 1,205 | 1,300 | 1,446 | 1,762 | 1,766 | 1,861 | 847 | 1,117 | 1,469 |
| Non-operating income | 135 | 5 | 12 | 14 | 15 | 15 | 12 | 28 | 42 | 88 | 34 | 26 |
| Non-operating expenses | 138 | 85 | 122 | 174 | 118 | 133 | 106 | 150 | 144 | 226 | 152 | 212 |
| Ordinary income | 747 | 437 | 810 | 1,044 | 1,196 | 1,329 | 1,669 | 1,643 | 1,759 | 709 | 999 | 1,283 |
| Extraordinary income | 54 | 23 | 97 | 32 | 3 | 20 | ||||||
| Extraordinary expenses | 4 | 17 | 94 | 104 | 29 | 33 | ||||||
| Loss before income taxes | 797 | 443 | 810 | 1,044 | 1,196 | 1,329 | 1,672 | 1,539 | 1,759 | 712 | 1,003 | 1,269 |
| Total income taxes | 353 | 209 | 354 | 418 | 472 | 475 | 561 | 533 | 600 | 355 | 394 | 209 |
| Net income | 444 | 233 | 456 | 626 | 724 | 854 | 1,111 | 1,007 | 1,159 | 358 | 609 | 1,060 |
| [Balance Sheets] | ||||||||||||
| Current assets | 5,251 | 6,257 | 8,023 | 7,836 | 10,366 | 9,749 | 15,874 | 15,745 | 18,094 | 19,040 | 18,968 | 27,929 |
| Property for sale | 3,698 | 4,834 | 6,346 | 5,166 | 7,699 | 6,877 | 11,863 | 11,678 | 13,493 | 14,424 | 13,301 | 23,657 |
| Non-current assets | 834 | 836 | 895 | 957 | 1,031 | 1,083 | 1,042 | 1,032 | 1,199 | 1,030 | 1,082 | 1,047 |
| Tangible assets | 136 | 135 | 569 | 603 | 572 | 591 | 467 | 458 | 456 | 306 | 301 | 299 |
| Investments and other assets | 612 | 622 | 226 | 258 | 383 | 405 | 494 | 505 | 669 | 655 | 730 | 701 |
| Total assets | 6,085 | 7,093 | 8,919 | 8,793 | 11,398 | 10,833 | 16,916 | 16,777 | 19,294 | 20,071 | 20,050 | 28,976 |
| Current liabilities | 2,663 | 3,098 | 4,587 | 3,165 | 4,910 | 3,751 | 8,430 | 6,160 | 9,047 | 5,772 | 8,731 | 12,606 |
| Short-term borrowings | 1,733 | 2,095 | 3,362 | 2,094 | 3,778 | 2,624 | 7,076 | 4,728 | 7,203 | 4,462 | 5,544 | 10,192 |
| Non-current liabilities | 181 | 562 | 465 | 367 | 453 | 226 | 479 | 1,710 | 351 | 4,232 | 1,017 | 5,314 |
| Long-Term Borrowings | 147 | 526 | 419 | 320 | 180 | 88 | 364 | 1,320 | 3,879 | 740 | 5,033 | |
| Total liabilities | 2,845 | 3,660 | 5,051 | 3,531 | 5,363 | 3,977 | 8,909 | 7,869 | 9,399 | 10,004 | 9,748 | 17,920 |
| Total net assets | 3,241 | 3,433 | 3,868 | 5,262 | 6,034 | 6,856 | 8,006 | 8,908 | 9,894 | 10,066 | 10,301 | 11,056 |
| Total shareholders’ equity | 3,241 | 3,433 | 3,868 | 5,262 | 6,034 | 6,852 | 8,002 | 8,904 | 9,890 | 10,062 | 10,297 | 11,052 |
| Capital stock | 257 | 257 | 257 | 661 | 710 | 720 | 788 | 811 | 814 | 818 | 820 | 833 |
| Legal capital reserve | 218 | 218 | 218 | 622 | 671 | 681 | 749 | 772 | 775 | 779 | 781 | 796 |
| Retained earnings | 2,766 | 2,958 | 3,393 | 3,978 | 4,654 | 5,451 | 6,464 | 7,320 | 8,302 | 8,465 | 8,863 | 9,708 |
| Stock acquisition right | 4 | 4 | 4 | 4 | 4 | 4 | 3 | |||||
| Total liabilities and net assets | 6,085 | 7,093 | 8,919 | 8,793 | 11,398 | 10,833 | 16,916 | 16,777 | 19,294 | 20,071 | 20,050 | 28,976 |
| [Statements of cash flows] | ||||||||||||
| Cash flow from operating activities | 970 | -953 | -664 | 1,761 | -1,451 | 1,611 | -3,666 | 1,617 | -420 | -917 | 1,704 | -9,267 |
| Loss before income taxes | 797 | 443 | 810 | 1,044 | 1,196 | 1,329 | 1,672 | 1,539 | 1,759 | 712 | 1,003 | 1,269 |
| Cash flow from investing activities | 127 | -15 | -175 | -111 | -116 | -184 | 107 | -64 | -71 | -288 | -51 | -266 |
| Cash flow from financing activities | -877 | 692 | 1,136 | -612 | 1,588 | -1,278 | 4,667 | -1,495 | 984 | 953 | -608 | 7,971 |
| Issuance of shares | 406 | 800 | 97 | 21 | 37 | 45 | 6 | 9 | ||||
| Net increase in cash and cash equiv. | 219 | -276 | 296 | 1,039 | 22 | 150 | 1,108 | 58 | 493 | -251 | 1,045 | -1,563 |
| Cash and cash equiv. at beginning of period |
850 | 1,069 | 793 | 1,089 | 2,128 | 2,150 | 2,299 | 3,407 | 3,465 | 3,959 | 3,707 | 4,752 |
| Cash and cash equiv. at end of period |
1,069 | 793 | 1,089 | 2,128 | 2,150 | 2,299 | 3,407 | 3,465 | 3,959 | 3,707 | 4,752 | 3,188 |
| Free cash flow | 1,097 | -968 | -839 | 1,650 | -1,567 | 1,427 | -3,559 | 1,553 | -491 | -1,205 | 1,653 | -9,533 |
Source: Omega Investment from company materials