2026-07-15
Home
Japanese

Omega Investment Co., Ltd.
Itoki (Company Note – basic)

| Share price (3/20) | ¥685 | Dividend Yield (23/3 CE) | 3.65 % |
| 52weeks high/low | ¥812/333 | ROE(TTM) | 10.91 % |
| Avg Vol (3 month) | 317.0 thou shrs | Operating margin (TTM) | 3.71 % |
| Market Cap | ¥31.2 bn | Beta (5Y Monthly) | 0.98 |
| Enterprise Value | ¥22.8 bn | Shares Outstanding | 45.664 mn shrs |
| PER (23/3 CE) | 8.38 X | Listed market | TSE Prime section |
| PBR (22/3 act) | 0.62 X |
| Click here for the PDF version of this page |
| PDF Version |
Designing tomorrow’s ‘work’.
Office DX Company
Summary
◇ Itoki was founded in Osaka in 1890. It is one of the leading office furniture companies and runs an integration of manufacturing and sales. The company’s products are renowned for their high design quality. With a mission statement of “designing tomorrow’s work”, the company has gone one step beyond providing office furniture to propose the creation of working environments that suit customers’ working styles. The company advocates Office 3.0, the DX of the office, and aims to realise improved office productivity. In the Equipment / Public business, the company provides logistics-related systems, research facility equipment, etc. Under the medium-term management reform ‘RISE ITOKI 2023’, which ends in 2023, the company aims to become a highly profitable company with a robust structure and to achieve an operating profit of 6.5 billion yen.
◇ Stock price observation: the company’s share price has risen 95% over the past year, while TOPIX fell 0.2% during the same period. Its performance stands out compared with its peers. Various factors are attributable to the stellar performance of the shares, including the fact that renewal projects have remained strong following the outbreak of COVID-19 and that the company’s marketing policy, which emphasises profitability on top of proposal-based sales, is beginning to produce results. In addition, the company has recently been focusing on investor relations and has made more shareholder-focused management decisions. The company’s share price has been undervalued compared to its peers for a long time, and even at the current share price level, PBR remains at 0.62. Further share price correction is reasonably expected if the new growth story progresses and profitability improves further under the new president, who took office in March 2022.
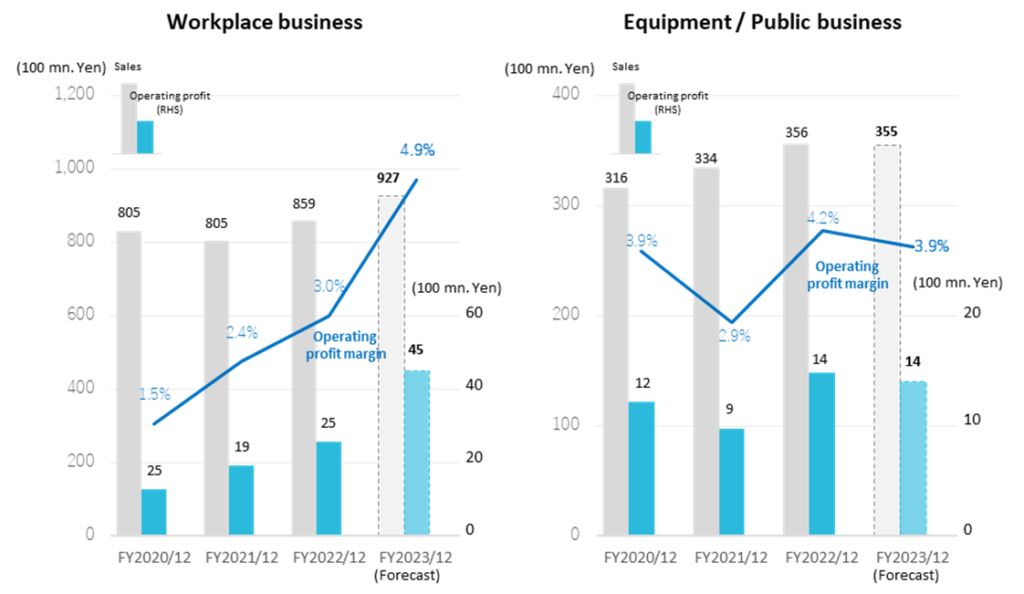
◇ Workplace business: Having developed from the manufacture and sale of office furniture, in recent years, the company has provided a range of sales proposals and consulting services to improve the office’s productivity as a ‘place of work’. Although affected by the supply of new office buildings, office renewal projects account for more than half of the recent total. The company advocates Office 3.0, a reform of the way of working through IT and DX and aims to offer DX proposals for office furniture that only the company can provide. The company’s office furniture has been highly regarded for its superior design. Still, in recent years it has been working to optimise its selling prices to match the value it provides, and profitability has improved significantly. Sales in FY12/2022 were 85.9 billion yen, and the operating profit was 2.5 billion yen.
◇ Equipment / Public business: provides logistics solutions such as warehousing and automated logistics system equipment, equipment for research facilities, and environmental and space construction for public facilities. The company has developed many industry-first products and boasts the No.1 delivery record for shuttle-type automated warehouses. The logistics-related systems business is expected to expand, driven by e-commerce growth. In FY12/2022, the company booked sales of 35.6 billion yen and an operating profit of 1.4 billion yen.
◇ Information Technology / Sharing business: this business operates IT and sharing businesses, including system development and system verification. Office space sharing business performed well. Sales in FY12/2022 were 1.6 billion yen, and the operating profit was 0.4 billion yen.
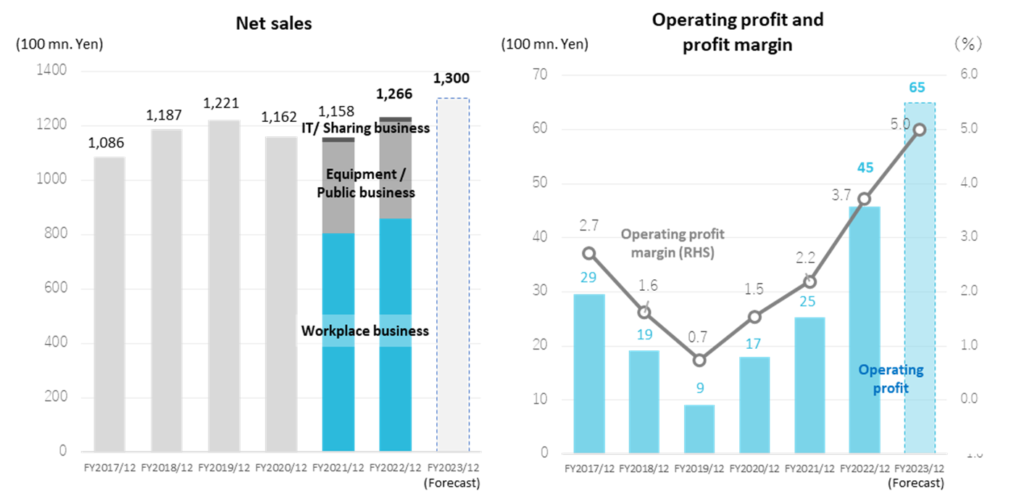
◇Recent financial performance: In FY12/2022, sales and operating profit reached record highs, with sales of 123.3 billion yen (+6.4% YoY) and operating profit of 4.58 billion (+79.0% YoY). The company recorded an extraordinary gain from the sale of land and other assets, resulting in a significant increase in profit attributable to owners of parent to 5.29 billion yen, or an increase of 353.9% YoY. It plans to pay a dividend of 37 yen a share for the performance of FY12/2022, including a special dividend of 20 yen. It forecasts sales of 130 billion yen (+5.4%) and an operating profit of 6.5 billion yen (+41.8%) for FY12/2023 to overachieve the initial operating profit target of 6 billion yen in the medium-term management plan.
Table of contents
| Summary | 1 |
| Key financial data | 2 |
| Company profile | 3 |
| History | 4 |
| Group overview / Production structure / Business diagram | 6 |
| Business overview | 9 |
| Workplace business | 9 |
| Equipment / Public business | 15 |
| Information Technology / Sharing business | 17 |
| Financial results | 18 |
| Full-year results for FY2022/12 | 18 |
| FY2023/12 full-year forecast | 20 |
| Growth strategy | 21 |
| Medium-term management vision | 21 |
| Stock information, etc. | 21 |
| Share Price Trend | 21 |
| Stock price observation | 23 |
| Major shareholders, Shareholding by ownership, Shareholder return policy | 25 |
| Corporate governance and the top management | 26 |
| Sustainability | 29 |
| Financial data | 31 |
Key financial data
| Fiscal Year | 2016/12 | 2017/12 | 2018/12 | 2019/12 | 2020/12 | 2021/12 | 2022/12 |
| Net sales | 101,684 | 108,684 | 118,700 | 122,174 | 116,210 | 115,839 | 123,324 |
| Cost of sales | 65,021 | 69,966 | 77,436 | 80,495 | 74,322 | 74,145 | 77,575 |
| Gross profit | 36,663 | 38,718 | 41,264 | 41,679 | 41,888 | 41,694 | 45,749 |
| SG&A expenses | 33,862 | 35,761 | 39,339 | 40,776 | 40,089 | 39,158 | 41,167 |
| Operating income | 2,800 | 2,956 | 1,925 | 903 | 1,798 | 2,536 | 4,582 |
| Ordinary income | 3,087 | 3,295 | 2,365 | 945 | 1,881 | 2,437 | 4,177 |
| Net income | 1,850 | 2,442 | 1,742 | -579 | -355 | 933 | 5,181 |
| Current assets | 52,410 | 58,147 | 62,143 | 58,109 | 57,183 | 57,753 | 71,027 |
| Cash and deposits | 19,839 | 19,977 | 16,529 | 17,030 | 18,246 | 17,451 | 26,976 |
| Non-current assets | 43,271 | 44,073 | 46,559 | 49,955 | 47,912 | 46,144 | 44,260 |
| Investments and other asset | 16,806 | 15,995 | 15,760 | 17,229 | 16,116 | 17,612 | 17,462 |
| Total assets | 95,681 | 102,221 | 108,703 | 108,778 | 105,096 | 103,898 | 115,288 |
| Total liabilities | 50,278 | 54,894 | 61,210 | 62,944 | 60,906 | 58,822 | 65,377 |
| Total net assets | 45,402 | 47,326 | 47,492 | 45,834 | 44,189 | 45,076 | 49,910 |
| Equity ratio (%) | 46.98 | 45.84 | 43.10 | 41.71 | 41.69 | 43.25 | 43.26 |
| Cash flow from operating activities | 5,072 | 3,565 | 1,384 | 3,586 | 4,561 | 2,774 | 5,804 |
| Cash flow from investing activities | -4,044 | -2,971 | -3,094 | -3,221 | -1,152 | -1,170 | 4,923 |
| Cash flow from financing activities | -2,571 | -706 | -2,463 | 0 | -2,267 | -2,658 | -1,426 |
| Cash and cash equivalents at end of period | 18,483 | 18,571 | 14,540 | 15,494 | 16,697 | 15,797 | 25,420 |
Source: Omega Investment from company materials
Company profile
Itoki is one of the four largest manufacturers of office furniture in Japan. It is a long-established company with a history of more than 130 years since its foundation in 1890.
With a mission statement of “designing tomorrow’s work”, the company not only manufactures and sells office furniture but also provides consulting on working styles and space design, offering the value of creating spaces, environments, and places for workers. The company has long been committed to designing, and its products are renowned for design excellence.
The three business segments are.
Workplace business: mainly manufactures and sells office furniture, but as stated in its mission statement, the company advocates the creation of ‘working environments’ tailored to how customers work. In recent years, the company has actively responded to the needs of a growing number of ways of working, such as working from home and in dispersed locations, in addition to working “collectively” in an office. Moreover, the company provides consulting services and other total solutions.
Main products and services; office furniture (desks and workstations, tables, office and conference chairs, system storage furniture, lockers), manufacture and sale of construction materials for office space construction, interior decoration work, office space design, project management for office relocation, etc., office repair and maintenance services, telework furniture, study furniture.
Equipment / Public business: provides logistics-related facilities, which have proliferated in recent years, as well as research facility equipment for pharmaceutical companies, universities and research institutions, and equipment for public facilities.
Main products and services; logistics equipment (shuttle cart automatic storage systems (SAS)), storage shelves, special doors, office security systems, research facility equipment, powder machinery and equipment, environmental and space construction for public facilities, etc.
Information Technology / Sharing business: system development for promoting DX in companies, support for human resource development in organisations, and system verification and office space sharing businesses.
Main products and services; office sharing, office equipment rental and re-use, IT system development, system verification and packaged software.
The composition of sales by region is as follows: Japan, 112,671 million yen (91.4%); Asia, 10,210 million yen (8.3%); and others, 356 million yen (0.3%), with domestic sales accounting for over 90%.
Sales by Segment

History (See the history table on the following page)
1890-1949: from popularising inventions and patents to selling and manufacturing office equipment.
The company’s origins date back to December 1890, when founder Kiichiro Itoh founded Itoh Ki Shoten in Osaka’s Koraibashi district to promote his inventions and patents and to handle imports. In 1903, the company began importing and selling paper clips and staples. Both are commonly used in offices today but trace their origins back more than 100 years when the company started to sell them. Later, in 1908, the Itoki Shoten Engineering Department was established. It started producing office equipment such as hand-carry safes and simple stationery. In the sense that the company began its business by importing, selling and repairing foreign products after the opening of Japan to the outside world in the Meiji era, and later took on the challenge of domestic production and expanded its business, it has something in common with other Japanese manufacturing companies that are now world leaders, such as Seiko Group Corporation (Hattori Watch Shop) and Brother Industries (Yasui Sewing Machine Shop).
In 1910, the company began importing and selling English typewriters, thermal bottles, etc. In 1913, it launched the independently developed ‘Zeni-ai-ki’ (money recording and disbursing machine). In 1925, it began manufacturing its steel-made furniture, including lockers. In 1937, it expanded into Tokyo, opening a Tokyo branch in Gofukubashi, Chuo-ku.
1950-1969: Steel furniture creates modern offices. Highly regarded in terms of design.
After the war, demand for office furniture surged as Japan’s economy grew rapidly; in 1955, the company began manufacturing and selling steel desks. The company’s steel furniture subsequently paved the way for various types of desks. In 1960 it established three major systems for filing, slip accounting and office layout. In response to the demand for office rationalisation during the period of high economic growth, the company offered filing and slip accounting systems, as well as ‘office layout’, a functional arrangement of furniture, office equipment and supplies centred on desks, thereby establishing the Itoki brand in office systematisation.
Furthermore, in 1962, the company expanded into the field of home and student desks. In 1967, the company adopted the catchphrase ‘Good Design, Good System’, establishing its image as a design company.
Meanwhile, as its business expanded, the company listed its shares on the Second Section of the Osaka Securities Exchange in October 1961 and on the Second Section of the Tokyo Stock Exchange in September 1962.
1970-1989: office planning, promoting the New Office.
In the 1970s, the company began technical cooperation with overseas companies and introduced state-of-the-art office systems to Japan. Beyond the mere supply of office furniture, the company had come to offer ‘office planning’. In 1976, 14 of its products were selected for the G-Mark, and the company’s reputation for design continued to grow. Since then, many products have been awarded the G Mark every year. In 1977, the company launched a research equipment and furniture system in cooperation with the Swiss company Vivo. With this, the company entered the current Equipment / Public business field.
In 1984, local subsidiaries were established in Singapore and the USA. The company also developed its business with an eye on overseas markets. In 1985, the company adopted its CI, which is still used today. In 1987, the company was listed on the First Section of the Tokyo Stock Exchange and the Osaka Securities Exchange.
1990 to present: over 100 years in business and creating offices for the 21st century.
Even after 100 years in business, the company continues to provide products and services that meet the demands of the times. In 1994, the company began selling free-access floors to meet the needs of the times. It also focuses on quality control, and in 1998 it was registered for ISO 9001 certification. In 2001, the company completed the accreditation of all its offices.
In 2005, the manufacturing division Itoki Crebio and the sales division Itoki merged and changed the company name to Itoki Corporation. The integration of manufacturing and sales enabled quicker management decisions and rationalisation of the group in the face of accelerating global trends.
Since then, the company has developed and marketed various new products in response to the demands of the times. The company offers ergonomically designed office chairs and office furniture; in 2017, the FLIP FLAP (chair) won the international design award Red Dot Design Award.
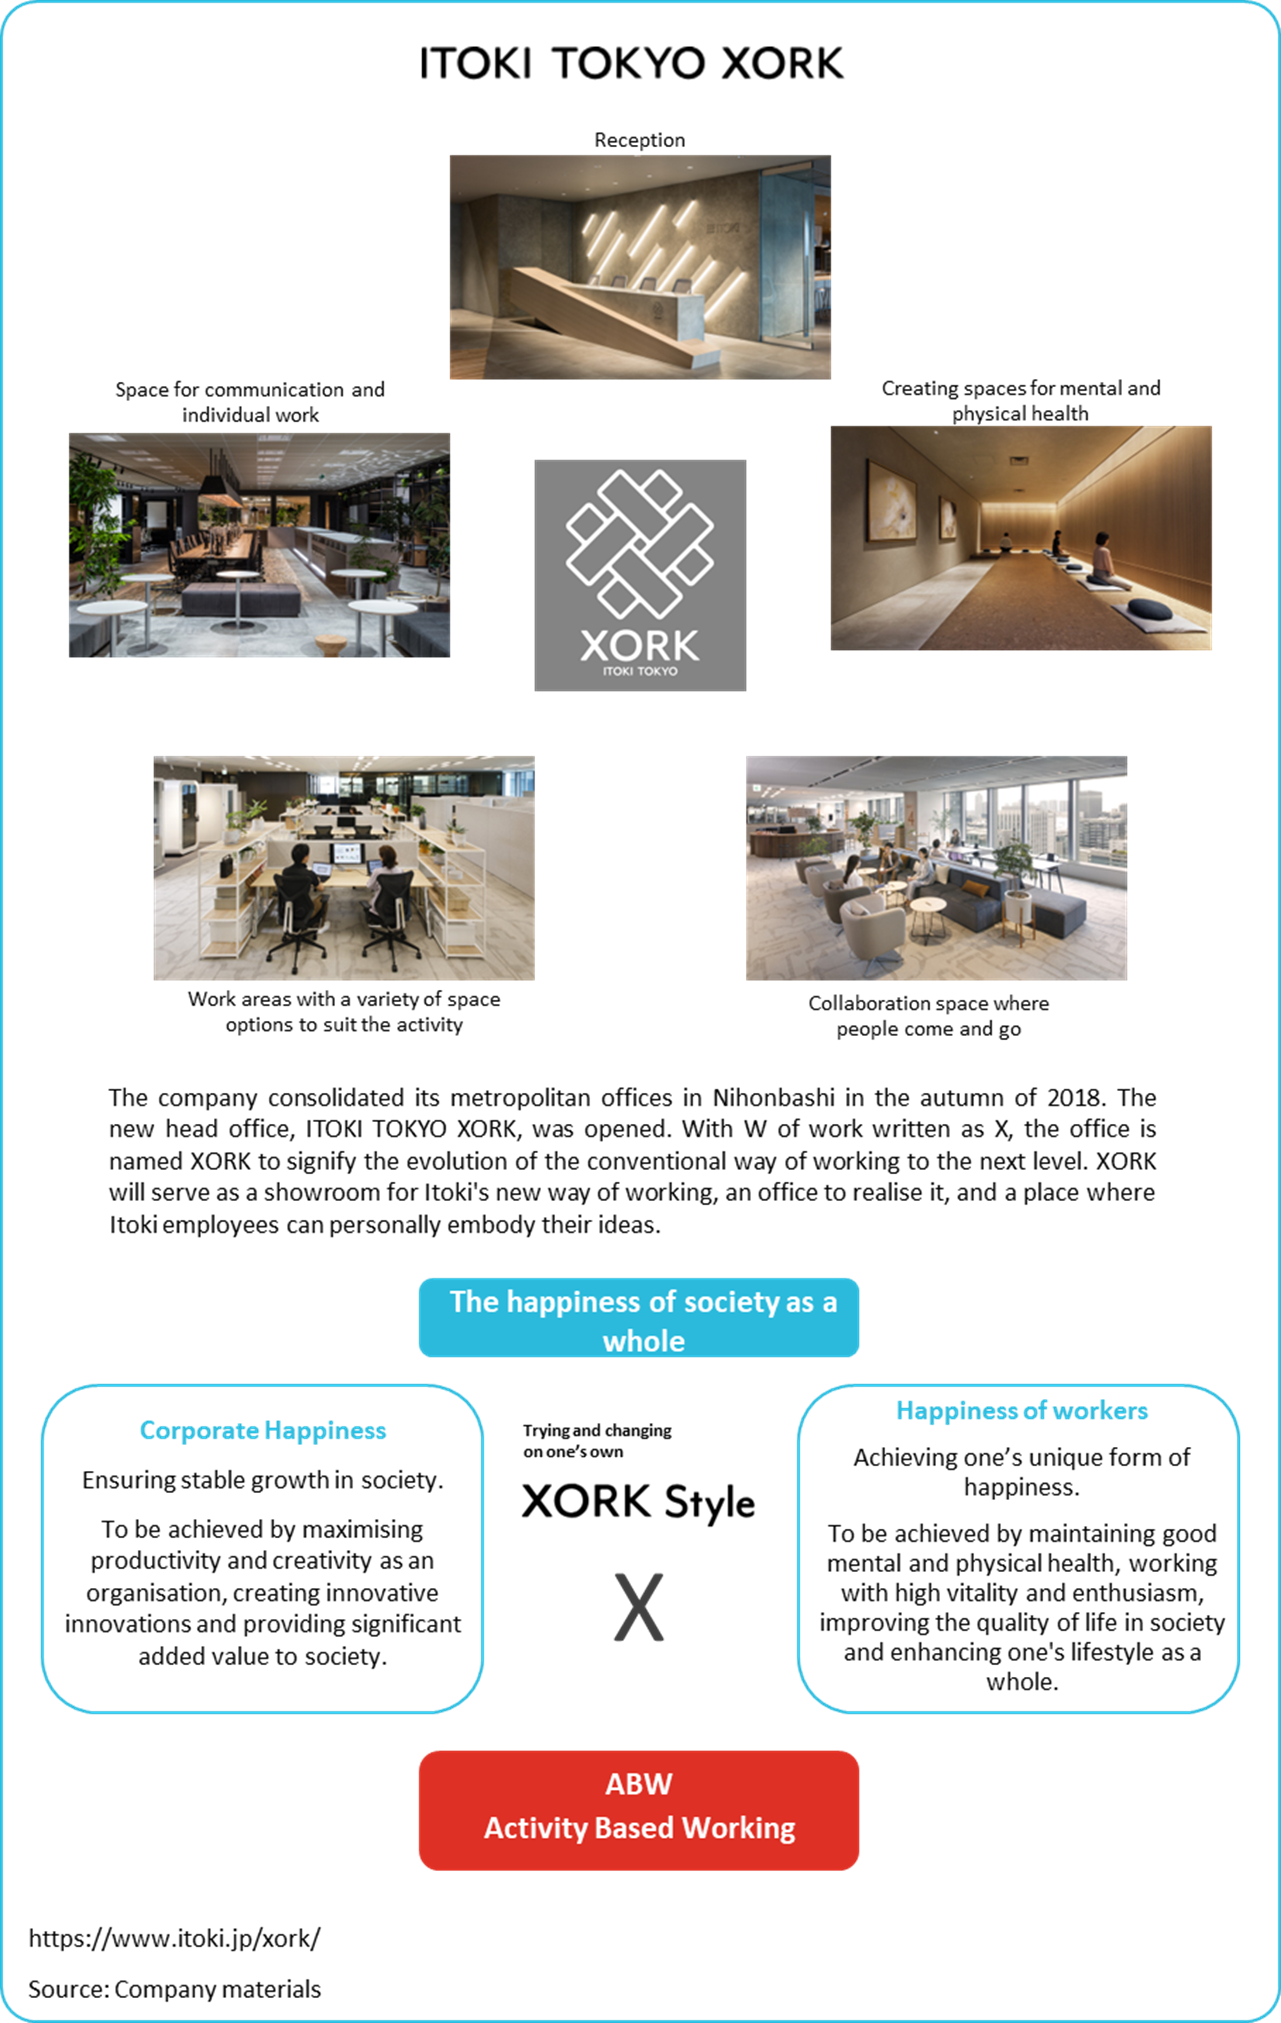
In 2018, offices in the metropolitan area were consolidated in Nihonbashi, and ITOKI TOKYO XORK was established. It advocates a comprehensive work style strategy that maximises workers’ abilities and intends to conduct various demonstrations as a place to practise the next generation of work styles, and to disseminate the various knowledge and know-how generated from these experiments to society.
| year (e.g. AD) | Month | Item |
|---|---|---|
| 1890 | Dec. | Itoki Shoten was founded in Higashi-ku, Osaka. |
| 1903 | Started import and sale of paper clips and staples. | |
| 1908 | Itoki Shoten Engineering Department was founded, and the production of office equipment began. | |
| 1910 | Import and sale of English typewriters, thermos bottles started. | |
| 1950 | Apr. | Spun off from Itoki Shoten, Itoki Kosakusho Co., Ltd. was founded in Izuo, Taisho-ku, Osaka. |
| 1952 | Jul. | A new Imafuku plant was built in Joto-ku, Osaka. |
| 1954 | Dec. | Head office moved to Joto-ku, Osaka. |
| 1961 | Jan. | Itoki All Steel Co., Ltd. was established (now a consolidated subsidiary). |
| Oct. | Shares listed on the Second Section of the Osaka Securities Exchange. | |
| 1962 | Sep. | Shares listed on the Second Section of the Tokyo Stock Exchange. |
| Dec. | Home Furniture Sales Divisions opened in Tokyo and Osaka. | |
| 1963 | May | New Neyagawa plant established in Neyagawa-ku, Osaka. |
| 1968 | Nov. | Kyoto Plant established in Yawata City, Kyoto. |
| 1972 | Sep. | Shiga Plant was established in Omihachiman City, Shiga Prefecture. |
| 1974 | Jun. | Fuji Living Industry Co., Ltd. in Hakusan City, Ishikawa Prefecture became a subsidiary and produced pipe chairs (currently a consolidated subsidiary). |
| 1984 | Aug. | Kyoto Plant No. 2 was established in Yawata City, Kyoto, relocating the Imafuku Plant. |
| 1986 | Nov. | An electronic device manufacturing plant was established in Omihachiman City, Shiga. |
| 1987 | Jun. | Listed on the First Section of the Tokyo Stock Exchange and Osaka Securities Exchange. |
| 1991 | Oct. | A chair manufacturing plant was established in Shiga Omihachiman City, Shiga. |
| 1992 | Aug. | Kyoto Plant No. 2 is relocated to Omihachiman City, Shiga. |
| 1999 | Aug. | Expansion of the Neyagawa plant in Neyagawa-ku, Osaka. |
| 2000 | Oct. | Itoki Technical Service Corporation was established. |
| 2002 | Nov. | Established Itoki (Suzhou) Furniture Co., Ltd. in China (now a consolidated subsidiary Novo Workstyle (China) Limited). |
| 2003 | Mar. | Itoki Market Space Inc., was established (now a consolidated subsidiary). |
| 2005 | Jun. | Merged with the former Itoki Co., Ltd. and changed its name from Itoki Crebio to Itoki Corporation. |
| Nov. | The Shiga Logistics Centre was established in Omihachiman City, Shiga. | |
| 2007 | Dec. | Acquired shares of Business Jimki Corporation and changed the company name to Itoki-Hokkaido Co., Ltd. (now a consolidated subsidiary). |
| 2008 | Dec. | Kanto Plant is established in Midori-ku, Chiba City, and partially relocating the Kyoto Plant. |
| 2011 | Apr. | Included Dalton Corporation and its five subsidiaries under the umbrella as subsidiaries, producing and selling research equipment and powder machinery (now a consolidated subsidiary). |
| 2012 | Nov. | ITOKI Tokyo Innovation Centre “SYNQA” opened in Chuo-ku, Tokyo. |
| 2015 | Mar. | Included Shin Nihon System Technology Corporation into the group as a subsidiary to develop various systems (now a consolidated subsidiary). |
| Jul. | Itoki Engineering Centre Co., Ltd., Itoki Osaka Engineering Centre Co., Ltd. and Itoki Technical Service Co., Ltd. merged and changed their name to Itoki Engineering Service Corporation (now a consolidated subsidiary). | |
| 2016 | Dec. | Tarkus Interiors Pte Ltd., an interior decoration company based in Singapore, became a subsidiary (now a consolidated subsidiary). |
| 2017 | Jul. | Novo Workstyle Asia Limited was established in Hong Kong (now a consolidated subsidiary). |
| 2018 | Nov. | The new Tokyo head office “ITOKI TOKYO XORK” (XORK) opened in Chuo-ku, Tokyo. |
| 2020 | Jun. | ITOKI CHINA HOLDING Co., Ltd. was established in China (now a consolidated subsidiary). |
Source: Omega Investment from company materials
As a recent development, attention should also be paid to the management. The current president, Koji Minato, joined the company in September 2021 and became president in March 2022. The appointment of an outsider with experience at a foreign company to the top position may have come as a surprise, which until now has had a succession of presidents who have come straight from the company’s own ranks. However, Mr Minato’s experience makes him ideally suited to the company’s future Office 3.0 (see below for details). Mr Minato joined NTT in 1994 and obtained an MBA from USC. He then worked as general manager of Sun Microsystems and, following Oracle’s acquisition of Sun Microsystems, vice-president of Oracle Japan before moving to Itoki Corporation.
Companies with long history often give a conservative image, but the fact that Itoki Corporation was founded 130 years ago and is still around today can be attributed to the fact that they have adapted to, or anticipated, the changes of the times rightly. However, the speed of change since the diffusion of the internet has been far faster than that of the past. It takes some time for an organisation to change, but under the leadership of Mr Minato, who has extensive experience in high-tech companies in Silicon Valley, various new developments are beginning to emerge. Employee mindsets are also changing. The share price performance over the past year, which will be discussed in more detail below, is thought to be a reflection of such new changes at the company.
Group overview
As seen in the history, the company was founded in Osaka, but its current head office is in Chuo-ku, Tokyo (relocated in 2018). The group consists of the company and 35 subsidiaries (see table below). The long history of the company and its many group companies, as well as the business activities of each company, show how extensively it has developed its business. Since the 2000s, the company has also actively embarked on overseas expansion, particularly in Asia, acquiring local companies and establishing subsidiaries and affiliates in various regions.
Major consolidated subsidiaries
| Company name | Business activities |
| Itoki All Steel Co., Ltd. | Manufacture of counters, large top desks, wall storage furniture, desk panels, etc. |
| Fuji Living Industry Co., Ltd. | Manufacture of meeting and amenity chairs. |
| Itoki Market Space Inc. | Sales of shop fixtures/store planning |
| Itoki Engineering Service Corporation | Project management of office renewal and relocation, management of office furniture layout delivery, and maintenance and inspection services for various other equipment. |
| Simasobi Corporation | Processing and sale of office furniture, office supplies and interior decorations, and contracting of electrical work |
| Itoki Toko Manufacturing Co., Ltd. | Manufacture of steel doors, safety deposit boxes, various types of shielding doors, fire-resistant walls, nuclear radiation shielding doors, etc. |
| Itoki Marui Industry Co., Ltd. | Manufacture of steel office machinery and equipment |
| Sanko Facilities Inc. | Sales of office equipment, furniture, fixtures and incidental goods, construction work, design management |
| FMSTAFF Ltd. | Consulting services related to facility management, etc. |
| Itoki Shared Value Co., Ltd. | Office space sharing business, office furniture rental and reuse business, etc. |
| Shin Nihon System Technology Corporation | Provision of IT solution services |
| Dalton Corporation | Design, manufacture and sale of research and education equipment; design and sale of powder processing machinery; design and sale of high-tech plant systems. |
| Tarkus Interiors Pte Ltd | Singaporean interior decoration company, made a subsidiary in 2016. |
| Novo Workstyle Asia Limited | Regional business headquarters for Asia, in Hong Kong, established 2017. |
| ITOKI SYSTEMS(SINGAPORE) PTE., LTD. | Singapore subsidiary, sales of office furniture, proposals and logistics systems |
ITOKI CHINA HOLDINGS Co., Ltd. |
Holding company for Chinese operations. Under the umbrella of Novo Workstyle Co. Offices in Beijing, Shanghai, Suzhou, Shenzhen, etc. |
17 other companies |
Source: Omega Investment from company materials
Production structure
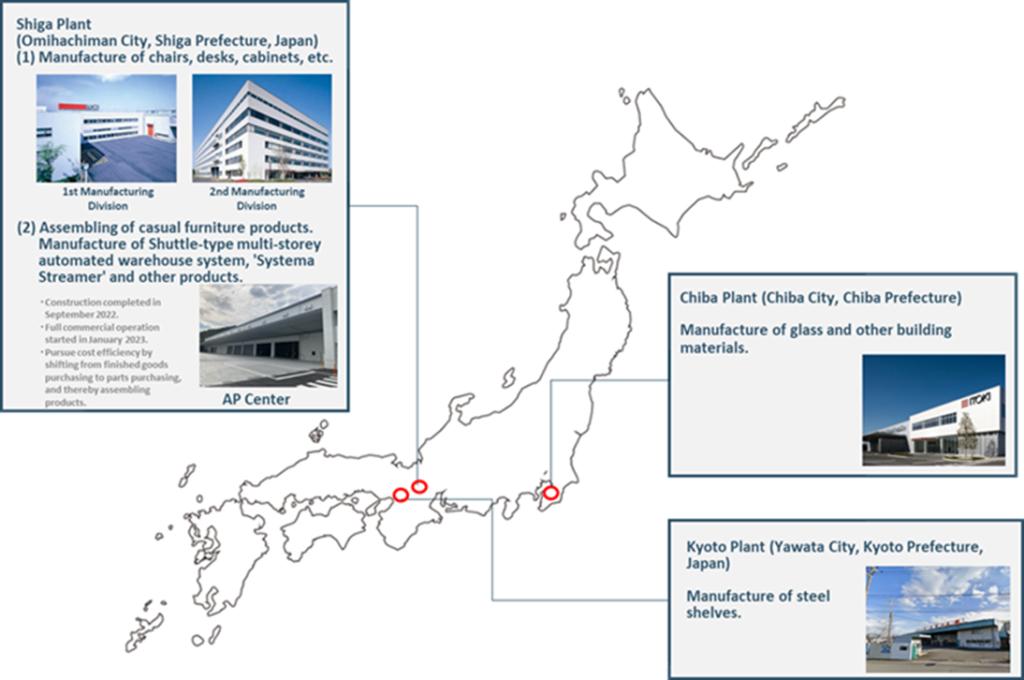
Production structure
The company’s primary market is domestic (overseas markets account for less than 10% of the sales in FY12/2022). Office furniture is bulky due to its storage nature, and it is not cost-effective to produce it overseas and import it at the expense of transport costs. Therefore, although some parts are imported overseas, the company manufactures its products in domestic factories.
The current main plant is the Shiga Plant, which manufactures chairs, desks, cabinets, and other products for the Workplace business. It employs about 300 people. In September 2022, the Assembling Process Centre (AP Centre) was opened at the same site, which started full operation in January 2023. The AP Centre is working to reduce the cost ratios by centrally managing the company’s products’ storage, assembly, and shipping. The centre will also relocate the production line for the system streamer SAR-R, whose demand is increasing rapidly in the logistics market, to meet growing demand. The Neyagawa plant, one of the company’s main plants for many years, was closed in 2022, with its production consolidated at the Shiga plant. The company sold the idle land of the plant for 6.5 billion yen and is working on improving asset efficiency. Part of the proceeds from the sale will be returned to shareholders as a special dividend for the performance in FY12/2022.
Business diagram
See the next page for a diagram of the business structure. The company and its group companies are involved in manufacturing, sales, construction, interior decoration, installation, and maintenance services.
Overseas office furniture manufacturers often specialise only in manufacturing and sales and rarely provide interior design, construction, or workplace design. In Japan, consulting companies and office design firms are generally engaged between the office furniture provider and the client for large-scale projects to provide work style design and workplace design. However, in recent years, office furniture manufacturers have also started to offer a comprehensive service from upstream to construction and delivery of office furniture, starting with small and medium-sized projects, to obtain fees commensurate with the proposal’s value.
Business diagram

Business overview
Workplace business
A core business accounting for 70% of the consolidated sales: focus on proposal-based marketing to improve profitability.
The company’s Workplace business generated sales of 85,945 million yen in FY12/2022 (+6.7% YoY), an operating profit of 2,579 million yen (+34.7%) and an operating profit margin of 3.0%. Sales by region were 75,592 million yen (88.0% of the total) in Japan, 10,093 million yen (11.7%) in Asia and 259 million yen (0.3%) in others to expand markets outside Japan in the future. In addition to the office-related business, the overseas office equipment-related business and other businesses have been incorporated into the Workplace business, increasing sales in this segment.
Since the launch of steel desks in 1955, the company’s office furniture business has successively developed and provided products to meet office needs in line with Japan’s economic growth and corporate business expansion. The company has made a significant contribution to developing the Japanese economy.
In the Workplace business, the aim is not just to sell office furniture but to provide higher added value by proposing workplace design and obtaining commensurate value. In the past, it was challenging to differentiate office furniture on a stand-alone basis, leading to price competition, which in turn led to significant discounts together with non-office fixtures and fittings, which sometimes resulted in a decline in profitability. Although the company’s office furniture was originally well-designed and had won many G Marks (see figure above, next page), it could be said that the company needed to receive more compensation commensurate with the value it provided. Recently, the company has been focusing on reviewing its sales structure and corporate culture (from a focus on sales to a focus on profit), generating revenue commensurate with the value it provides, and selling higher value-added products and services.
Workplace business revenue and profit trends
| Financial year | 2015/12 | 2016/12 | 2017/12 | 2018/12 | 2019/12 | 2020/12 | 2021/12 | 2022/12 |
| Net sales (Corporate-wide) | 106,516 | 101,684 | 108,684 | 118,700 | 122,174 | 116,210 | 115,839 | 123,324 |
| YoY | 3.4% | -4.5% | 6.9% | 9.2% | 2.9% | -4.9% | -0.3% | 6.5% |
| Current segment | ||||||||
| Workplace business | – | – | – | – | – | 83,032 | 80,561 | 85,945 |
| YoY | – | – | – | – | – | – | -3.0% | 6.7% |
| Composition of sales | – | – | – | – | – | 71.4% | 69.5% | 69.7% |
| Former segment | ||||||||
| Office-related businesses | 55,002 | 55,175 | 55,324 | 61,759 | 64,659 | 64,633 | – | – |
| YoY | 5.7% | 0.3% | 0.3% | 11.6% | 4.7% | 0.0% | – | – |
| Composition of sales | 51.6% | 54.3% | 50.9% | 52.0% | 52.9% | 55.6% | – | – |
| Operating profit (Corporate-wide) | 4,306 | 2,800 | 2,956 | 1,925 | 903 | 1,798 | 2,536 | 4,582 |
| YoY | 74.2% | -35.0% | 5.6% | -34.9% | -53.1% | 99.1% | 41.0% | 80.7% |
| Operating profit margin | 4.0% | 2.8% | 2.7% | 1.6% | 0.7% | 1.5% | 2.2% | 3.7% |
| Current segment | ||||||||
| Workplace business | – | – | – | – | – | 1,273 | 1,914 | 2,579 |
| YoY | – | – | – | – | – | – | 50.4% | 34.7% |
| Segment profit margin | – | – | – | – | – | 1.5% | 2.4% | 3.0% |
| Former segment | ||||||||
| Office-related businesses | 3,176 | 3,041 | 2,655 | 2,125 | 703 | 1,035 | – | – |
| YoY | 58.6% | -4.3% | -12.7% | -20.0% | -66.9% | 47.2% | – | – |
| Segment profit margin | 5.8% | 5.5% | 4.8% | 3.4% | 1.1% | 1.6% | – | – |
| No. of employees (all company, persons) | 3,333 | 3,349 | 3,910 | 4,102 | 4,151 | 4,062 | 3,973 | – |
| Workplace business | – | – | – | – | – | – | 2,535 | – |
| Office-related businesses | 1,623 | 1,636 | 2,028 | 2,320 | 2,261 | 2,162 | – | – |
| Asset (Corporate-wide) | 98,175 | 95,681 | 102,221 | 108,703 | 108,778 | 105,096 | 103,898 | 115,288 |
| Workplace business | – | – | – | – | – | – | 57,711 | 56,992 |
| Office-related businesses | 32,088 | 32,238 | 36,386 | 46,353 | 45,575 | 47,930 | – | – |
| Depreciation expenses (Corporate-wide) | 2,389 | 2,534 | 2,316 | 2,329 | 3,168 | 3,431 | 3,181 | 2,828 |
| Workplace business | – | – | – | – | – | – | 2,263 | 1,905 |
| Office-related businesses | 1,020 | 1,257 | 1,071 | 1,270 | 2,006 | 2,222 | – | – |
Source: Omega Investment from company materials
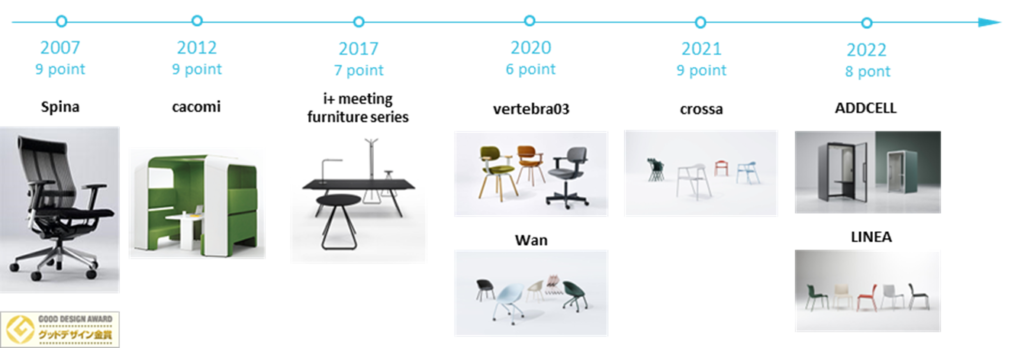
The company’s history of Good Design Awards
Source: Omega Investment from company materials
The office furniture market could add value as new ways of working evolve.
Japan’s office furniture market: market size of 600-700 billion yen, with stable growth.
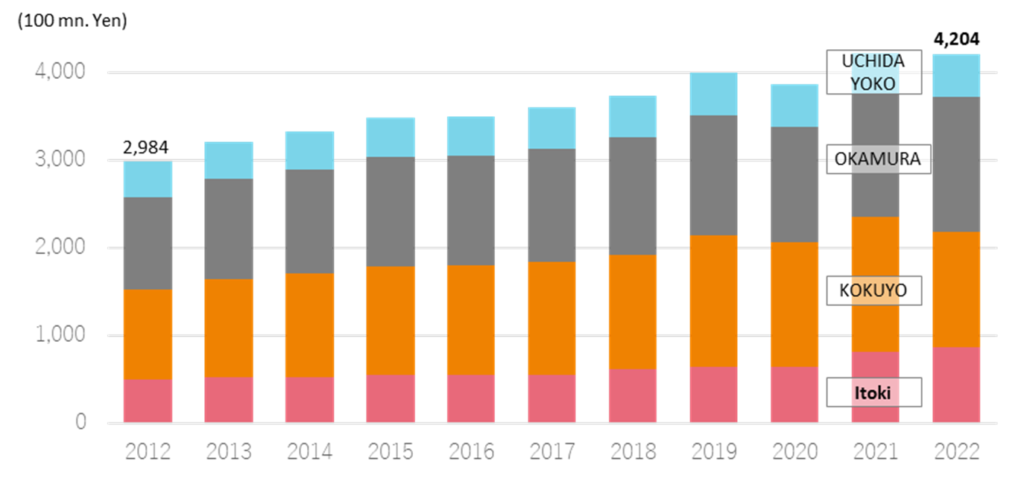
Japan Office Institutional Furniture Association (JOIFA), of which 109 office furniture-related companies are members, carries out various activities as an industry association and publishes statistics and surveys as appropriate. It is assumed that JOIFA also understands the size of the office furniture market in Japan, but it does not publish data to the public. The figure below is a rough idea of the size of the market, based on segment information for the four major office furniture companies, including Itoki Corporation (however, the definition of segments differs from company to company, and there is no clear definition of the extent to which public-related or consulting services are included, so the figure is for reference only). Looking at each company’s share in this four-company total, in 2022, the company’s share was 20%, Kokuyo 32%, Okamura 36% and Uchida Yoko 12%. Kokuyo and Okamura each hold almost 1/3 of the market share, with the company in third place and Uchida Yoko in fourth place, a positioning that has long been established. In addition, the market appears to be growing almost steadily (3-4%). When the sales of companies other than the four are included, the market is estimated to be worth around 600-700 billion yen annually. Office furniture alone is worth approximately 400 billion yen, the rest including consultancy and construction. (Omega Investment estimate based on the sales of JOIFA member companies, etc.).
Office furniture business sales of the four major office furniture companies
| Itoki | 2021/2022 Workplace business segment: ‘Creating-working-environments’ office furniture manufacturing and sales, office space design, etc. 2012 to 2010: Office- related segment. No continuity between 2020 and 2021 due to segment changes. |
KOKUYO | FY12/2022: Workstyle domain (furniture business): space design and consultation, manufacture, purchase, sale, and installation of office furniture. FY 12/2019 – FY12/2021: Spatial Value domain; FY12/2012 – FY12/2018: Furniture sales. |
| OKAMURA | Office Environmental business segment: manufacture and sale of office furniture, furniture for public facilities, security products, etc. |
UCHIDA YOKO | Office-related business segment: development, manufacture and sale of office- related furniture, space design, design and construction, etc. |
Source: Prepared by Omega Investment from the annual reports of the companies.
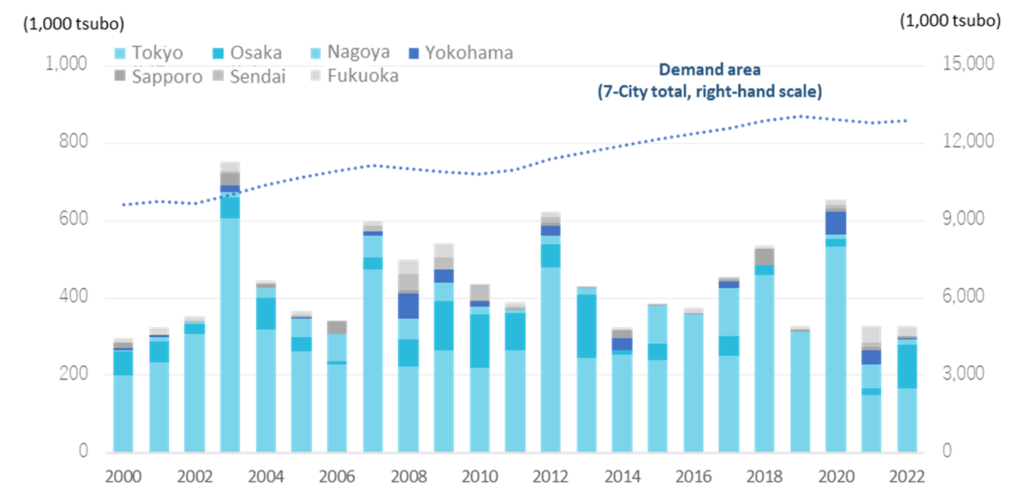
Office supply and demand for office space in seven major cities
Office building market outlook: new supply is declining, but demand for office space is increasing steadily.
Demand for office furniture tends to be influenced by the supply of new office buildings, economic trends, and corporate performance. See the chart above on the next page for office supplies in the seven major cities in Japan. Although there are considerable annual fluctuations due to the completion of large-scale developments, a comparison of the average supply area between 2000-2010 and 2011-2022 shows that the latter has fallen by approximately 5%. On the other hand, the demand area (i.e., rental area minus vacant area) has been increasing relatively steadily. However, most recently, where an ample supply was made available in Tokyo in 2020, the introduction of remote working due to the economic recession and the outbreak of COVID-19 has led to a decline in demand (particularly in large cities with high rates of teleworking). According to Mori Building’s forecasts, the supply of large-scale office buildings in Tokyo’s 23 wards in 2023 and 2025 is expected to be positive for office furniture demand.
Recent developments in the office furniture market: new business opportunities due to the increasing sophistication of office needs.
In recent years, office needs have undergone a significant transformation. The office’s role has changed from the past, partly due to the introduction of remote working due to COVID-19, and this could mean new business opportunities for office furniture companies. Background includes.
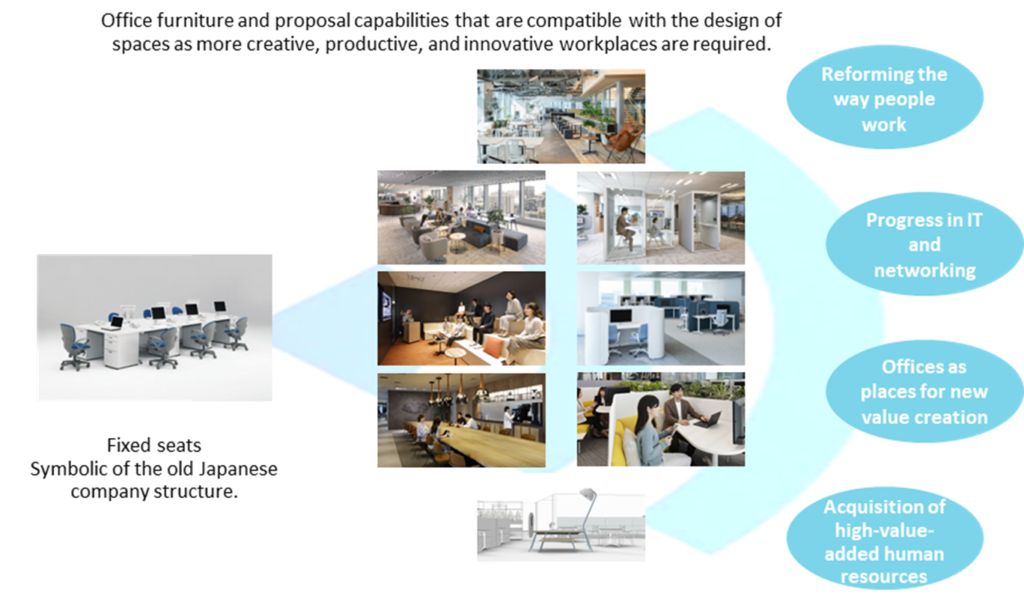
- Reform of work style: the Japanese economy has been stagnant for a long time. As the era of high growth, when productivity could be increased mainly in the manufacturing sector, ended and the proportion of tertiary industry increased, it became difficult to increase productivity, particularly among white-collar workers. Against this backdrop, there are indications that productivity should be improved through reforms in how people work. To achieve this, the internal organisation of Japanese companies needs to change, and the composition of corporate offices is undergoing a significant transformation from the old fixed-seat-based office environment (see figure, next page).
- Advances in IT and networking: the way work is carried out in a company has changed significantly over the last 10-20 years due to IT development. The office must respond to the evolution of hardware, software, networks, etc. The change has been within the scope of Itoki’s Office 2.0, which the company has advocated. In the future, Office 3.0, or the DX orientation of the office, will determine competition for superiority between companies.
- The office as a place for new value creation: as indicated in a), how people work will change significantly. The pandemic disease has triggered the introduction of remote work, but at the same time, it is still essential to have places where people meet face-to-face and communicate with each other. In the future, it will be crucial to maximise workers’ abilities by combining the central office as a place to share experiences with remote work, which is a flexible way of working at a high level.
- Attracting high value-added human resources: human resources are the biggest asset for future growth in all companies, but IT and other creative personnel need more supply. To retain such talented people, it is essential to have a great office environment and space.
The changing role required of offices
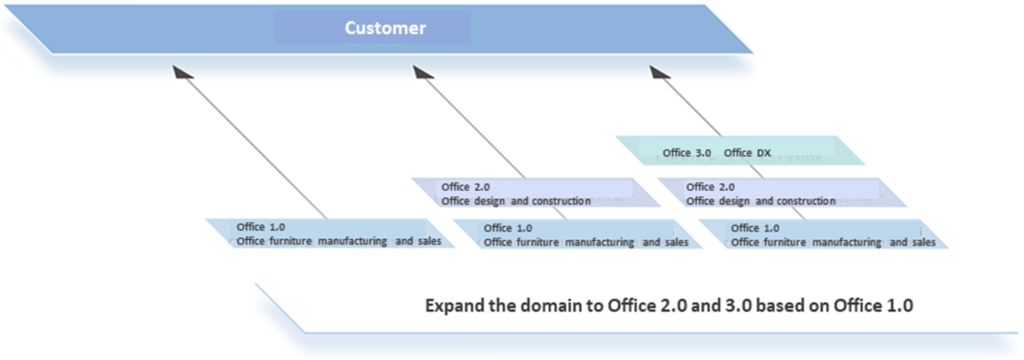
The company’s approach: multiplying Office 1.0, 2.0 and 3.0 to increase corporate value.
The company’s answer to the changes in the office furniture and office space market described above is shown in the diagram below: in Office 2.0, the company has added value through office design and construction in addition to manufacturing and selling office furniture. Office 3.0 will further promote office DX. Data is collected by attaching sensors to office furniture and various parts of the office. By analysing this big data, it will be possible to provide customers with higher value-added services. The company has set up an advanced research institute to realise this. It is also oriented towards the data business, such as the realisation of running fee revenues rather than just selling off fixtures and fittings. Office 3.0 has only just begun, and progress is still to be made, but the company is a step ahead of its competitors in that it has set out a concrete policy for DX in office space.
The company’s proposed Office 3.0 concept
As a place to put Office 3.0 into practice, the company consolidated its Tokyo headquarters in Nihonbashi in 2018 and opened ITOKI TOKYO XORK, which also serves as a showroom. For more information, see the next page.
Peer competition:
As seen in the office furniture market, the four major players in this market – the company, Kokuyo (TSEP: 7984), Okamura (TSEP: 7994) and Uchida Yoko (TSEP: 8057) – hold 60% of the market. The table below compares each company’s most recent figures and other data. All but Okamura have a history of more than 100 years, while Okamura also has a long track record of more than 70 years. Regarding the companies’ businesses, most sales for Itoki Corporation and Okamura come from office furniture, fixtures, and fittings for commercial facilities. Kokuyo, on the other hand, as is well known, also generates a large proportion of its sales from stationery-related products. For Uchida Yoko, public-related (e.g., education-related ICT) and information-related (e.g., software licensing) sales account for 80% of its sales.
The graph on the next page compares the profitability of each company’s office furniture business; as noted on page 10, the definition of each company’s segment is not necessarily the same, but it should give a rough indication. Kokuyo and Okamura, which have high market shares, deliver high profit margins. Kokuyo has been increasing its profit margin by more than 10% in recent years by focusing on proposal-based marketing and projects for which it can charge a design fee. While Uchida Yoko has achieved high profit margins in its non-office-related businesses, it has been spoilt by low profit margins in its office-related businesses.
Comparison of four major office furniture companies
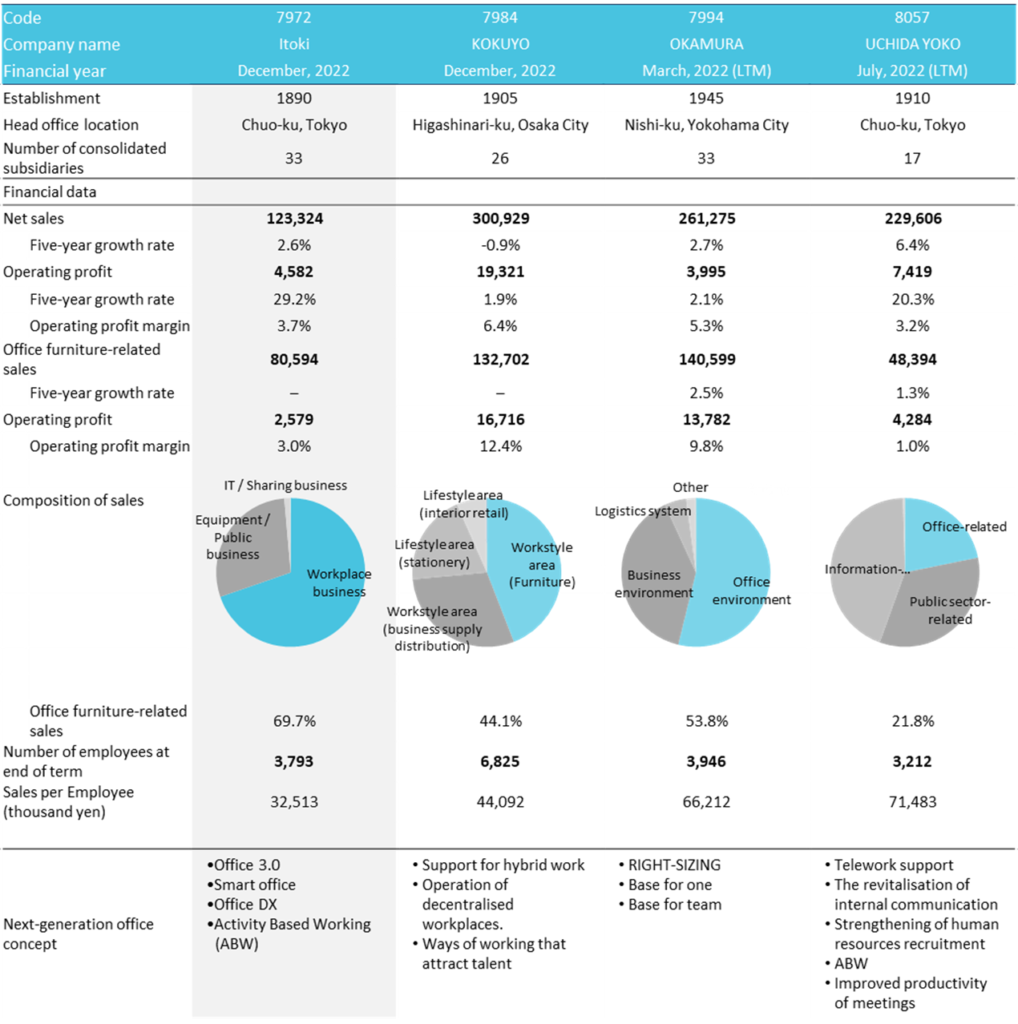
Four office furniture companies, operating profit margin trends in office furniture-related businesses.
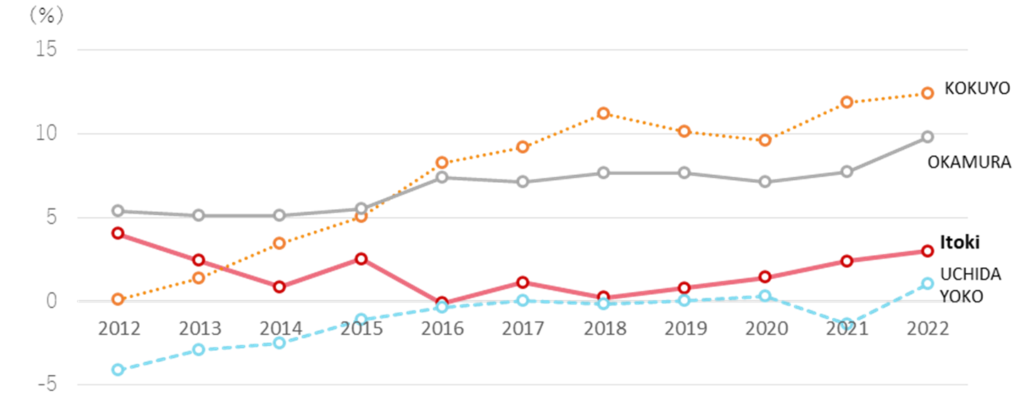
On the other hand, Itoki Corporation earned a profit margin of nearly 5% in 2012, but its profit margin has since declined. When competing with the top two companies, the profit margin appears to have lowered due to price discounts and other measures to secure sales rather than profit margins. The company has recognised the problem and is working to improve profit margins by optimising sales prices in line with its value, strengthening and expanding its consulting services, and monetising services such as delivery and design fees. These have started to show results in recent years.
Equipment / Public business
Logistics-related facilities, research facility equipment and other unique products.
In FY12/2022, the company’s Equipment / Public business generated sales of 35,667 million yen (+6.5% YoY), an operating profit of 1,482 million yen (+52.2%) and delivered an operating profit margin of 4.2%. In terms of sales by region, the domestic market is the primary source of sales, with Japan 35,454 million yen (99.4% of total sales), Asia 117 million yen (0.3%) and others 96 million yen (0.3%). From 2021, the reporting segments were revised in line with the business segments in the medium-term management plan. If the sales of former Equipment-related business in 2020 are reclassified to the current segment for comparison, the sales in 2020 on a current segment basis will be 17,350 million less than the sales of the old segment. The profitability of this business is not necessarily high, with a segment profit margin of -0.1% to 2.5% until 2020. Since the segmentation change, there has been an improving trend of 2.9%-4.2%.
Equipment product range

Equipment / Public business revenue and profit trends
| Financial year | 2015/12 | 2016/12 | 2017/12 | 2018/12 | 2019/12 | 2020/12 | 2021/12 | 2022/12 |
| Net sales (Corporate-wide) | 106,516 | 101,684 | 108,684 | 118,700 | 122,174 | 116,210 | 115,839 | 123,324 |
| YoY | 3.4% | -4.5% | 6.9% | 9.2% | 2.9% | -4.9% | -0.3% | 6.5% |
| Current segment | ||||||||
| Equipment / Public business | – | – | – | – | – | 31,602 | 33,488 | 35,667 |
| YoY | – | – | – | – | – | – | 6.0% | 6.5% |
| Composition of sales | – | – | – | – | – | 27.2% | 28.9% | 28.9% |
| Former segment | ||||||||
| Equipment-related business | 48,540 | 43,427 | 50,531 | 54,158 | 55,024 | 48,952 | – | – |
| YoY | 3.2% | -10.5% | 16.4% | 7.2% | 1.6% | -11.0% | – | – |
| Composition of sales | 45.6% | 42.7% | 46.5% | 45.6% | 45.0% | 42.1% | – | – |
| Operating profit (Corporate-wide) | 4,306 | 2,800 | 2,956 | 1,925 | 903 | 1,798 | 2,536 | 4,582 |
| YoY | 74.2% | -35.0% | 5.6% | -34.9% | -53.1% | 99.1% | 41.0% | 80.7% |
| Operating profit margin | 4.0% | 2.8% | 2.7% | 1.6% | 0.7% | 1.5% | 2.2% | 3.7% |
| Current segment | ||||||||
| Equipment / Public business | – | – | – | – | – | 1,225 | 974 | 1,482 |
| YoY | – | – | – | – | – | – | -20.5% | 52.2% |
| Segment profit margin | – | – | – | – | – | 3.9% | 2.9% | 4.2% |
| Former segment | ||||||||
| Equipment-related business | 1,222 | -58 | 569 | 115 | 435 | 686 | – | – |
| YoY | 207.0% | -104.7% | -1081.0% | -79.8% | 278.3% | 57.7% | – | – |
| Segment profit margin | 2.5% | -0.1% | 1.1% | 0.2% | 0.8% | 1.4% | – | – |
| No. of employees (all company, persons) | 3,333 | 3,349 | 3,910 | 4,102 | 4,151 | 4,062 | 3,973 | – |
| Equipment / Public business | – | – | – | – | – | – | 1,106 | – |
| Equipment-related business | 1,392 | 1,377 | 1,544 | 1,421 | 1,452 | 1,485 | – | – |
| Asset (Corporate-wide) | 98,175 | 95,681 | 102,221 | 108,703 | 108,778 | 105,096 | 103,898 | 115,288 |
| Equipment / Public business | – | – | – | – | – | – | 24,691 | 26,816 |
| Equipment-related business | 33,148 | 30,925 | 37,415 | 37,748 | 37,203 | 33,636 | – | – |
| Depreciation expenses (Corporate-wide) | 2,389 | 2,534 | 2,316 | 2,329 | 3,168 | 3,431 | 3,181 | 2,828 |
| Equipment / Public business | – | – | – | – | – | – | 460 | 456 |
| Equipment-related business | 903 | 860 | 849 | 801 | 833 | 853 | – | – |
Source: Omega Investment from each company materials
The Equipment / Public business dates to 1914, when the company began selling vent-type safes. Since then, the company has manufactured and sold a variety of warehouse-related fixtures and fittings and, since the 1980s, has been an industry pioneer in developing and supplying a range of automated warehouse equipment. Based on its experience producing safe doors, the company also produced and launched special large doors for nuclear power facilities. The company has continued developing numerous industry firsts, including developing secure locking systems. In recent years, there has been an extreme need for automation equipment for warehouse and distribution systems.
The main customers for logistics equipment are the automotive industry and equipment manufacturers. The main customers for public facilities products are museums, art galleries and libraries. Sales of logistics equipment depend on economic trends and corporate earnings. Still, they are expected to grow, as reducing logistics costs is an ongoing and vital management issue in the manufacturing industry. On the other hand, sales of public facilities are affected by budget execution by public offices and local authorities.
In the same segment, research equipment is another product to note. Dalton Corporation, which the company invested in in 2011 and became a wholly owned subsidiary in 2016, manufactures and sells these products. Dalton Corporation was founded in 1939 as a manufacturer and distributor of scientific instruments and glassware for analysis (the company was called San-Ei Seisakusho when it was founded). It established a scientific research facilities division, which developed and sold products used in various research facilities; in 1996, it acquired a powder and granular equipment manufacturer and expanded into powder machinery; in 2014, it introduced the Uni-X Lab Series of draft chambers and laboratory tables.
Dalton Corporation research facility equipment
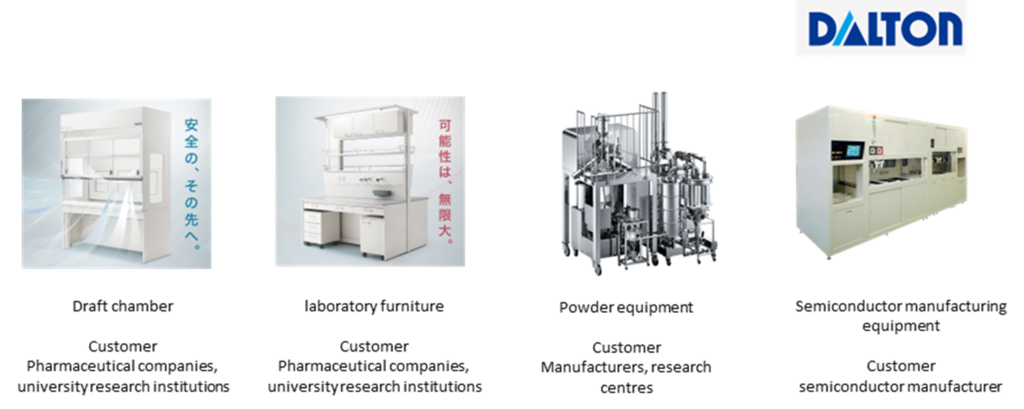
Customers of laboratory equipment include pharmaceutical companies, universities and research institutions, and the sales are affected by trends in R&D expenditure/capital investment by pharmaceutical companies and scientific research funding by universities. Pharmaceutical companies, the largest customers, actively invest in R&D expenditure to develop new drugs. In FY2022/3, Takeda spent 526.1 billion yen (up 15.4% YoY), Daiichi Sankyo 260.2 billion yen (up 14.5%) and Astellas 246 billion yen (up 9.6%). Of the 34 companies that have disclosed their R&D expenditure, 20 have seen double-digit increases. On the other hand, while there are concerns that research budgets at Japanese universities continue to be cut, major pharmaceutical customers’ robust research investment budgets are expected to continue. Hence, the sales of the company’s research facility equipment should grow.
Information Technology / Sharing business
Provides system development, system verification projects and office sharing.
The Information Technology / Sharing business includes system-related and sharing businesses that do not belong to Workplace business, Equipment / Public business. In FY12/2022, sales were 1,624 million yen (-7.6% YoY), operating profit was 449 million yen (operating loss of 385 million yen in FY12/2022), and operating profit margin was 23.1%. All sales are generated in the domestic market. The business accounts for 1.3% of total sales and is expected to grow steadily.
Financial results
Full year consolidated sales / operating profit trend
FY12/2022 financial results
Summary: Record sales and profits achieved. A special dividend was paid, bringing the year-end dividend to 37 yen a share.
Sales remained strong, mainly due to office relocation and renewal projects. In addition to the revision of selling prices, cost-cutting efforts were successful, and operating profit reached a record high. Improving asset efficiency also resulted in an extraordinary gain (6.9 billion yen) from selling the former Neyagawa plant site and other assets. A special dividend of 20 yen was decided to be paid out of the profit from the sale. Thus, the company is committed to rewarding its shareholders.
FY12/2022 results: 6% YoY increase in sales, 79% rise in operating profit.
The company’s full-year results for FY12/2022 show that Workplace and Equipment / Public businesses performed well. Sales for each business increased by 6.7% and 6.5%, respectively, YoY. Segment profits increased significantly by 34.7% and 52.2%, respectively. In addition, Information Technology / Sharing business achieved an operating profit despite a 7.6% decline in sales. As a result, consolidated sales registered 123,324 million yen or +6.4% YoY, and operating profit was 4,582 million yen rising 79.0% YoY. As mentioned above, extraordinary gains were recorded on the sale of non-business assets, resulting in profit attributable to owners of parent of 5,294 million, a significant increase of 353.9% over the previous year. Including the special dividend of 20 yen per share, the company plans to pay a full-year dividend of 37 yen, with a payout ratio of 31.6%.
| JPY, mn, % | Net sales | YoY % |
Oper. profit |
YoY % |
Ord. profit |
YoY % |
Profit ATOP |
YoY % |
EPS (¥) |
DPS (¥) |
| 2018/12 | 118,700 | 9.2 | 1,927 | -34.8 | 2,367 | -28.1 | 1,725 | -28.2 | 37.84 | 13.00 |
| 2019/12 | 122,174 | 2.9 | 903 | -53.1 | 945 | -60.1 | -550 | – | -12.08 | 13.00 |
| 2020/12 | 116,210 | -4.9 | 1,798 | 99.1 | 1,881 | 99.0 | -235 | – | -5.18 | 13.00 |
| 2021/12 | 115,839 | -0.3 | 2,536 | 41.0 | 2,437 | 29.5 | 1,166 | – | 25.82 | 15.00 |
| 2022/12 | 123,324 | 6.4 | 4,582 | 79.0 | 4,177 | 71.4 | 5,294 | 353.9 | 116.99 | 37.00 |
| 2023/12 (CE) | 130,000 | 5.4 | 6,500 | 41.8 | 6,500 | 55.6 | 3,700 | -30.1 | 81.70 | 25.00 |
Factors contributing to changes in operating profit
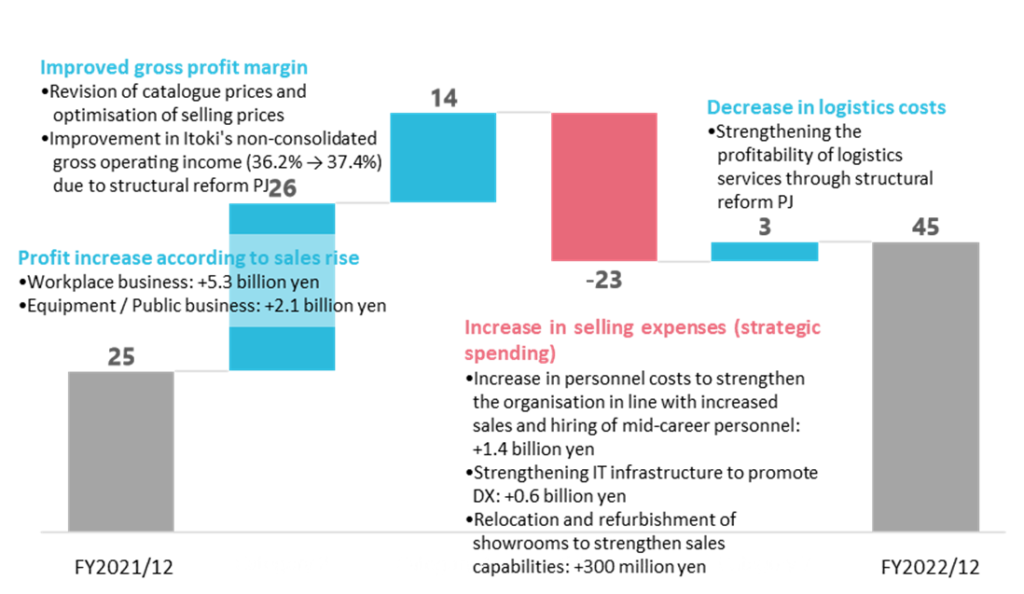
The chart above deciphers the changes in operating profit. In addition to increased profits due to higher sales, an improved gross margin due to progress on structural reform projects and lower logistics costs muted the increase in strategic expenditure, resulting in a significant profit increase.
Segments trend
Workplace business: sales rose 6.7%, a significant increase in segment profit of +34.7%.
In the aftermath of the outbreak of pandemic disease and the response to the so-called New Normal, sales of large-scale office relocation and renewal projects in line with new ways of working were strong, resulting in the segment’s sales of 85,945 million yen and profit of 2,579 million yen. The profit margin improved by 0.6 percentage points YoY. Regarding Itoki’s non-consolidated sales, renewal projects accounted for 46.3% of total sales in 2020, but in 2022 they accounted for more than half, at 53.8%. Upfront investments include participation in the international office furniture exhibition ORGATEC TOKYO and the renewal of ITOKI TOKYO XORK, the head office and showroom. Despite the recent rise in raw material prices, the company increased sales and profit thanks to higher sales, efforts to reduce logistics costs through structural reform projects, and increased value of its products.
Equipment / Public business: +6.5% increase in sales and a substantial increase in segment profit of +52.2% YoY.
Sales and segment profit were 35,667 million yen and 1,482 million yen, respectively, achieving significant increases. The segment profit margin improved by 1.2 percentage points YoY. Large-scale business negotiations for research facilities (science parks) for which orders were received in the previous year were recorded as sales in FY12/2022, contributing to the performance. Demand for logistics facilities was also strong and remained robust. Despite the impact of the sharp rise in raw material prices, the company achieved an increase in sales and profit, mainly because of higher sales and the improved value of its offerings.
Information Technology / Sharing business: achieved operating profit by divesting from unprofitable businesses.
Sales were 1,624 million yen (-7.6%), and the segment profit was 449 million yen (an operating loss of 385 million yen in the previous year). In addition to system development, the system verification business, which has been promoted in recent years, performed well. The office space-sharing business also performed well. The company withdrew from the GlobalTreehouse business, which had been unwell partly due to COVID-19. This had a positive effect, and the business returned to profitability.
Topics: structural reform project initiatives
The company has stated that one of the goals of its medium-term management plan “RISE ITOKI 2023 (FY2021-2023)”, is to become a “highly profitable company” with a strong structure. As seen in the four-company comparison on page 15, the company is below the profitability of the top two companies, which is a vital area for improvement first. The company has identified three concrete measures for its structural reform project.
ーInitiatives related to sales reform.
・Fair selling price in line with the value provided.
・Consulting services and the strengthening and expansion of proposal value-added capabilities.
prove the operating margin of the Workplace business by 0.6 percentage points, as shown above.
・Monetisation of services that were not previously recoverable as sales, such as delivery and design costs. These have helped to improve the operating margin of the Workplace business by 0.6 percentage points, as shown above.
ーInitiatives related to production and supply.
・The AP Centre, a new assembly production base, was completed and put into operation at the Shiga Plant. Cost reductions have become possible by purchasing parts and assembling them at the AP Centre into products, whereas previously finished products were purchased.
ーInitiatives to improve asset efficiency.
・Sales of non-purpose-built fixed assets, etc. (As previously reported, selling the former Neyagawa plant site for 6.5 billion yen helped significantly improve cash flow).
・In addition, further facility disposals and efficiency improvements are well underway.
Source: Omega Investment from company materials
Growth strategy
Medium-term management plan “RISE ITOKI 2023”
In February 2021, the company formulated a medium-term management plan ending in 2023. The plan addresses various issues that have come to light amidst the uncertainty surrounding the pandemic diseases. It sets out the direction of management based on the so-called ‘New Normal’.
First, the company’s goals were to lead the creation of a post-COVID working environment and to become a highly profitable company with a robust constitution. The pandemic disease has led to the rapid introduction of remote working, and it is said that changes that usually take three to four years have progressed in one to two years. The company sees the diversification of workplaces triggered by COVID-19 as a business opportunity and will provide new products, services and solutions for all ‘working environments’.
The goal of becoming a ‘highly profitable company’ with a strong constitution shows a serious commitment to improving profitability, which has been a longstanding proposition for the company. As mentioned above, it was difficult to differentiate office furniture on a stand-alone basis in the past, and there was a tendency towards price competition. The company has formulated a theme for initiatives to overcome this situation: even though it has many in-house designers and has developed office furniture and fixtures with high design quality, it has yet to generate profitability commensurate with the value of its products. The structural reform project addresses six themes, including building a new sales structure incorporating DX, reducing the cost ratio by restructuring group factories, introducing the assembly method of residence, and improving the efficiency of group-wide assets. The financial results for FY12/2022 show that the effects of these efforts are steadily bearing fruit.
In addition, as a manufacturing company, the company faces the major challenge of reducing CO2 emissions generated in the production process of its products. As discussed in the Sustainability section, implementing ESG management is also one of the key policies in this medium-term plan.
The medium-term management plan rolls over the initial FY12/2023 targets of 133 billion in sales and 6 billion yen in operating profit. In particular, the operating profit target was raised to 6.5 billion yen. Each measure is being steadily implemented, and, as seen in the forecast for FY12/2023, these numerical targets are likely to be largely met.
It will be interesting to see how Itoki presents itself in the next medium-term management plan under the new president and whether the company will further create corporate value by enhancing its earnings structure.
Stock information, etc.
Stock price trends
The shares soared, driven by positive expectations of growth and profitability.
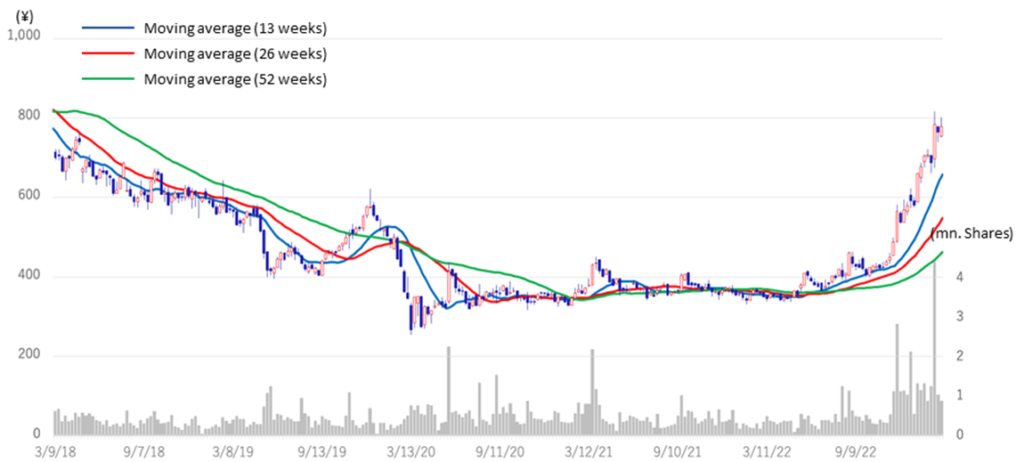
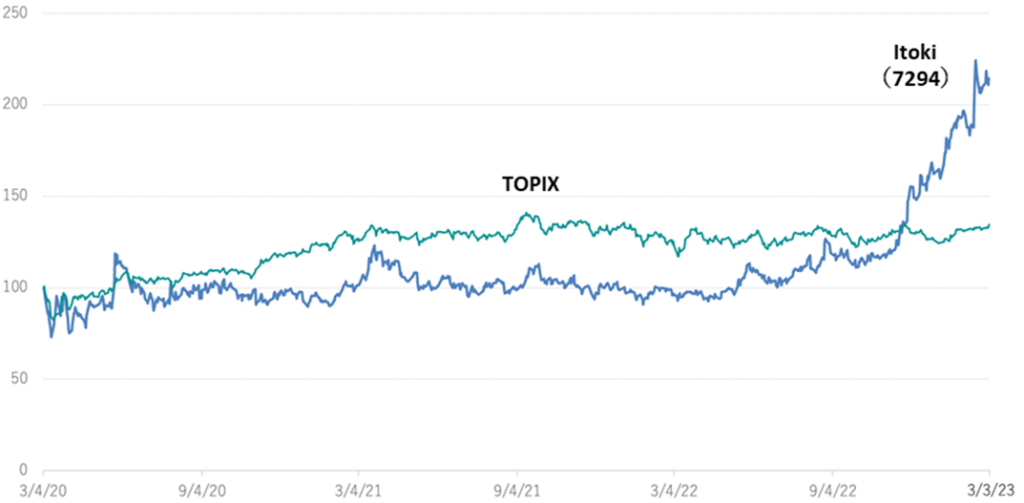
The company’s share price has risen 95% over the past year, while TOPIX fell 0.2% during the same period. Its performance stands out compared with its peers. The share price is 2.7 times higher than the recent bottom of 250 yen on 13 March 2020. Various factors are attributable to the stellar performance of the shares, including the fact that renewal projects have remained strong following the outbreak of COVID-19 and that the company‘s marketing policy, which emphasises profitability on top of proposal-based sales, is beginning to produce results. In addition, the company has recently been focusing on investor relations and has made more shareholder-focused management decisions. The company’s share price has been undervalued compared to its peers for a long time, and even at the current share price level, PBR remains at 0.62. The new president Minato, who assumed office in March 2022, has a different background and track record from the office furniture business joining from a foreign IT company. He is the right person to develop a strategy to create new added value, as symbolised by Office 3.0, from the conventional sales of furniture and fixtures. Further share price correction is reasonably expected if the new growth story progresses and profitability improves further under the new president, who took office in March 2022.
7972:5-year stock price move
Share price compared to TOPIX (last three years)
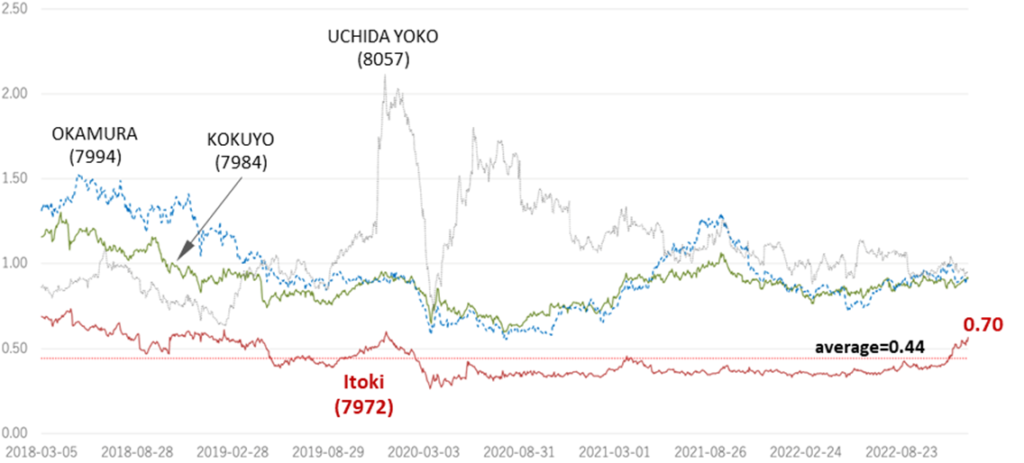
7972: Historical PBR of Itoki and the three competitors (LTM, last five years)
Valuations
The financial data of the company and its peers Kokuyo (TSEP: 7984), Okamura (TSEP: 7994) and Uchida Yoko (TSEP: 8057) are compared in the charts and tables below.
The ROE trend shows that Kokuyo and Okamura are generating stable returns. By contrast, Itoki Corporation recorded net losses in FY12/2019 and FY12/2020, and the company’s ROE is inferior to that of its competitors in other periods. In FY12/2022, it recorded an extraordinary gain, which led to a higher return. But the ROE net of this extraordinary gain was still below its competitors. A breakdown of ROE shows that this is due to the company’s low profit margins vis-a-vis its peers and will need to continue improving its profit margins to achieve higher ROE. Regarding Uchida Yoko, the proportion of office-related business to total sales is low, so earnings can fluctuate significantly depending on successful bids for large education-related projects in the public sector. The outstanding performance of Uchida Yoko in 2020 (FY7/2021) was due to a 40% YoY increase in sales and a 70% increase in net profit on orders for large public-related projects.

The following chart plots PBR vs ROE. The company’s improvement is significant, but there is still scope for further improvement. If investors expect the improvements to be realised, the share price will be revised upwards.

Share price and financial data of four office furniture companies
| Code | 7972 | 7984 | 7994 | 8057 | |
| Company name | Itoki | KOKUYO | OKAMURA | UCHIDA YOKO | |
| Financial year | December, 2022 | December, 2022 | March, 2022 (LTM) | July, 2022 (LTM) | |
| Share price (3/20) | 685 | 1,817 | 1,328 | 4,780 | |
| Market cap. (milion yen) | 35,280 | 233,925 | 133,625 | 49,805 | |
| PER (x) | 8.38 | 13.45 | 8.32 | 9.79 | |
| PBR (x) | 0.62 | 0.88 | 0.88 | 1.02 | |
| Dividend yield (%) | 3.65 | 3.19 | 3.31 | 3.14 | |
| Share price increase since the beginning of the year |
16.7% | -2.2% | -6.7% | 2.1% | |
| Yearly high | 812(2/16) | 1,948(3/9) | 1,446(1/18) | 5,230(3/8) | |
| Yearly low | 572(1/6) | 1,753(1/12) | 1,272(2/6) | 4,435(1/6) | |
| 10-year high | 978(25/11/15) | 2,244(9/4/18) | 1,771(15/5/18) | 8,530(16/12/19) | |
| 10-year low | 250(13/3/20) | 623(7/6/13) | 676(5/8/20) | 623(7/6/13) | |
| Financial indicators (%) | |||||
| ROE | 11.17% | 7.88% | 11.47% | 10.10% | |
| ROA | 4.83% | 5.55% | 6.83% | 3.95% | |
| ROIC | 2.04% | 5.85% | 4.22% | 8.04% | |
| Equity Ratio | 43.2% | 70.6% | 60.7% | 39.1% | |
| Per Share Indicators | |||||
| Number of shares outstanding at end of period (thousand shares) |
45,664 | 128,742 | 100,621 | 10,419 | |
| EPS (yen, Plan) | 81.70 | 135.05 | 159.61 | 488.07 | |
| BPS (yen, Act) | 1,100.33 | 2,059.21 | 1,482.00 | 4,460.15 | |
| DPS (yen, Plan) | 25.00 | 58.00 | 44.00 | 150.00 | |
| Dividend payout ratio | 30.6% | 42.9% | 27.6% | 30.7% | |
| Financial data | |||||
| Net sales | 123,324 | 300,929 | 275,939 | 229,606 | |
| Five-year growth rate | 2.6% | -0.9% | 2.7% | 8.7% | |
| Gross profit | 45,749 | 116,671 | 86,719 | 42,674 | |
| Gross profit margin | 37.1% | 38.8% | 31.4 | 18.6% | |
| Operating profit | 4,582 | 19,321 | 14,613 | 7,419 | |
| Five-year growth rate | 9.2% | 1.9% | 2.1% | 20.3% | |
| Operating profit margin | 3.7% | 6.4% | 5.3% | 2.0% | |
| Net profit attributable to owners of the parent |
5,294 | 18,375 | 16,394 | 4,655 | |
| Five-year growth rate | 17.1% | 4.1% | 8.7% | 20.5% | |
| Net profit margin | 4.3% | 6.1% | 5.9% | 2.0% | |
| Number of employees at end of term |
3,793 | 6,825 | 3,946 | 3,212 | |
| Sales per Employee (thousand yen) | 32,513 | 44,092 | 66,212 | 71,483 | |
| EBITDA | 7,821 | 26,229 | 20,791 | 9,273 | |
| EBITDA margin | 6.3% | 8.7% | 7.5% | 4.0% | |
| Statements of Cash Flows | |||||
| Cash flow from operating activities | 5,804 | 9,577 | 5,328 | -5,414 | |
| Cash flow from investing activities | 4,923 | -3,320 | -2,264 | -2,198 | |
| Cash flow from financing activities | -1,426 | -8,991 | -8,601 | -8,632 | |
| Free cash flow | 10,727 | 6,257 | 3,064 | -7,612 | |
Source: Omega Investment from each company materials
Major shareholders
| Name | Number of shares owned |
Ratio of the number of shares owned to the total number of issued shares (%) |
| The Master Trust Bank of Japan, Ltd. | 5,079 | 11.21 |
| Nippon Life Insurance Company | 2,225 | 4.91 |
| Itoki Crebio Business Association | 1,754 | 3.87 |
| K.K. Ashisuto | 1,609 | 3.55 |
| Shichiro Ito | 1,356 | 2.99 |
| Custody Bank of Japan | 1,341 | 2.96 |
| Mizuho Bank, Ltd. | 1,121 | 2.47 |
| Itoki Crebio Employee Stock Ownership Plan | 1,106 | 2.44 |
| Sumitomo Mitsui Banking Corporation | 1,069 | 2.36 |
| Fumiko Ito | 963 | 2.12 |
| Total | 17,623 | 38.88 |
| Number of shares issued and outstanding | 45,664 |
Note: The company holds 381,659 treasury shares but is excluded from the above major shareholders. The percentage of shares held to the total number of shares issued (%) excludes treasury shares.
Source: The company’s convocation notices for shareholders’ meeting (27 February 2023).
The combined shareholding of Shichiro Ito and Fumiko Ito of the Ito family, the founding family, is 5.11%. Shareholding by ownership is as follows.
Shareholding by ownership
Shareholder return policy
The company recognises the distribution of profits as one of its key management policies. Its essential policy is to pay a continuous and stable dividend to shareholders once a year as a year-end dividend, considering the company’s earnings situation, the enhancement of internal reserves, future business development and other factors in a comprehensive and long-term manner. In FY12/2022, the company will pay a dividend of 37 yen per share, an uplift of 2 yen from the initial forecast of 15 yen, plus a special dividend of 20 yen. In the future, the company intends to implement a dividend policy aiming for a payout ratio of at least 20%, considering consolidated results and the record of stable dividends paid in the past.
Dividends

Source: Omega Investment from company materials
Corporate governance and top management
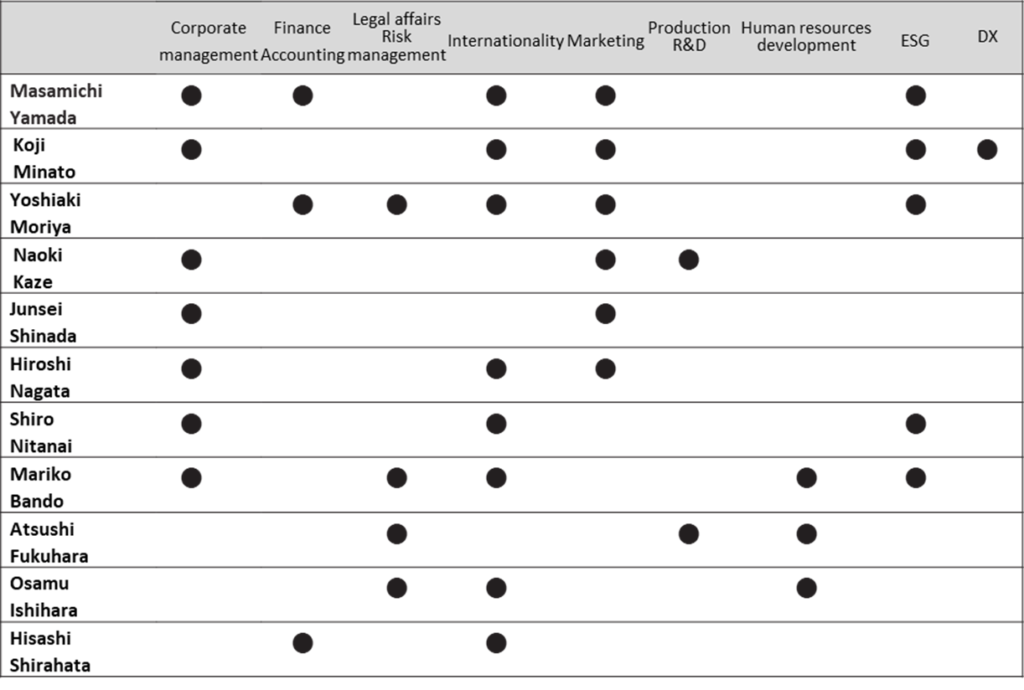
The company has a board of auditors with one full-time auditor. Eight directors were elected at the Annual General Meeting of Shareholders in March 2011, 3 of whom are outside directors and designated as independent directors. Considering that five years ago, the board of directors consisted of six directors, two of whom were outside directors, it is fair to say that the structure has been strengthened. Of the current total of 11 directors and auditors, ten are male and one female. All nationalities are Japanese (see next page, references). The new corporate governance code requires diversity in terms of gender and internationality as a prerequisite for ensuring the effectiveness of the board of directors and board of auditors. More than 90% of the company’s sales are in Japan, and its overseas subsidiaries, etc., are mainly in Asia, so it is imagined that the number of overseas employees is limited as a percentage of the total workforce. However, the company’s medium-term management plan states that it intends to increase earnings through full-scale expansion of its overseas operations in the future. Depending on the company’s overseas operations progress, the management team will need to be even more diverse from a corporate governance perspective.
The company has also adopted an executive officer system to separate management oversight and business execution. Currently, there are 26 executive officers, including two who serve as directors. Of these, one is a woman.
As is well known, women’s participation in society is much more advanced than in the past. Female employees account for 31.0% of the company’s workforce, and the proportion of women in management positions is 8.9% (respectively, at end-December 2021). Although the proportion of women in management positions has risen from 5.8% over the past five years, it is expected to be utilised at more senior management levels.
The company’s corporate governance structure
See the next page for the company’s top management; a new management structure will be implemented after the Annual General Meeting of Shareholders on 23 March 2023.
Top management (New structure after 23 March 2023)
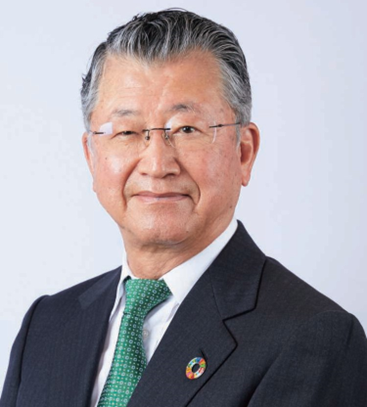
Chairman:Masamichi Yamada
Born in 1940
Apr. 1964 Joined The Mitsubishi Bank, Ltd. (currently MUFG Bank, Ltd.)
Jun. 1991 Director, The Mitsubishi Bank, Ltd.
Jun. 2000 Senior Managing Director, The Bank of Tokyo-Mitsubishi, Ltd.
Sep. 2002 Representative Director and Chairman, Mitsubishi Securities Co., Ltd. (currently Mitsubishi UFJ Morgan Stanley Securities Co., Ltd.)
Jun. 2004 Full-Time Corporate Auditor, TOKYU CORPORATION
Jun. 2005 Director of the Company
Jun. 2007 Chairman of the Company (current)
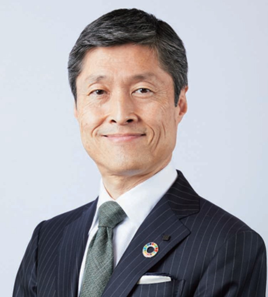
President and Representative Director: Koji Minato
Born in 1970
Apr. 1994 Joined NIPPON TELEGRAPH AND TELEPHONE CORPORATION (NTT)
Jul. 2008 Joined Sun Microsystems Japan
Jun. 2010 Senior Manager for Customer Support, Oracle Corporation Japan (Business integration with Sun Microsystems)
Jun. 2015 Operating Officer, Chief of Staff, CEO Office, Oracle Corporation Japan
Aug. 2018 Corporate Executive Officer, Executive Deputy President & COO, Oracle Corporation Japan
Aug. 2019 Director, Member of the Board, Corporate Executive Officer, Executive Deputy President & COO, Oracle Corporation Japan
Sep. 2021 Joined ITOKI CORPORATION; Senior Advisor
Mar. 2022 President of the Company (current)
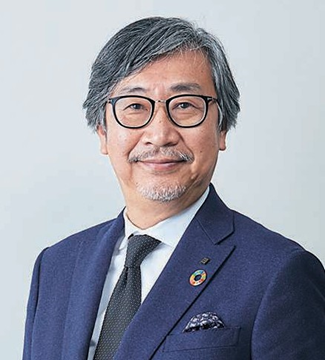
Director, Managing Executive Officer:Yoshiaki Moriya
Born in 1965
Apr. 1982 Joined The Dai-Ichi Kangyo Bank, Limited (currently Mizuho Bank, Ltd.)
Jul. 1988 Seconded to The Export-Import Bank of Japan (currently Japan Bank for International Cooperation)
Apr. 2007 General Manager, Personal Planning Department of Mizuho Bank, Ltd.
Jan. 2011 Joined ITOKI CORPORATION; Executive Officer and Deputy General Manager, Administration Division
Jan. 2012 Executive Officer and General Manager, Administration Division of the Company
Jan. 2015 Managing Executive Officer and General Manager, Administration Division of the Company
Mar. 2021 Director, Managing Executive Officer and General Manager, Administration Division of the Company (current)
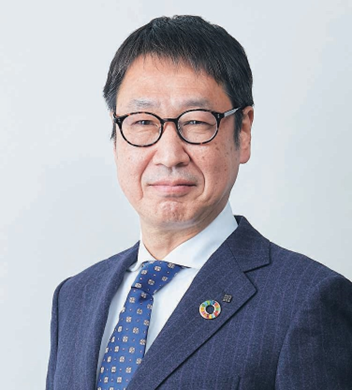
Director:Naoki Kaze
Born in 1962
Apr. 1986 Joined the former ITOKI Co., Ltd. (“former ITOKI”)
Jan. 2007 General Manager, Tokyo-Nishi Branch of the Company
Jan. 2010 General Manager, Tokyo-Nishi Branch Office of the Company
Jan. 2013 Executive Officer and General Manager, Tokyo-Nishi Branch Office of the Company
Jan. 2016 Executive Officer and General Manager, Tokyo Branch Office of the Company
Jan. 2018 Executive Officer and General Manager, Knoll Business Management Department of the Company and President, Knoll Japan Inc.
Jan. 2021 Managing Executive Officer and General Manager, Sales Division of the Company (current)
Director:Junsei Shinada
Born in 1961
Apr. 1985 Joined the former ITOKI Co., Ltd. (“former ITOKI”)
Jul. 2006 General Manager, Minato Branch, Tokyo-Higashi Sales Department of the Company
Jan. 2014 General Manager, Higashi-Nihon Branch Office of the Company
Jan. 2016 Executive Officer and General Manager, Corporate Customer Sales Management Department of the Company
Jan. 2018 Executive Officer and General Manager, Corporate Customer Sales Management Department, and General Manager, Customer Value Management Department of the Company
Jul. 2021 Executive Officer and General Manager, Engineering Management Department of the Company
Jan. 2023 Managing Executive Officer and General Manager, Planning Division of the Company (current)
Director (outside director): Hiroshi Nagata
Born in 1941
Apr. 1970 Joined MITSUI & CO., France
Jun. 1996 Director, MITSUI & CO., LTD. (“MITSUI”)
Jun. 1999 Managing Director, MITSUI President, MITSUI & CO. EUROPE PLC
Apr. 2002 Representative Director, Executive Vice President and Chemicals Group President, MITSUI
Apr. 2005 Visiting Professor at Waseda University Graduate School of Commerce (MBA Course)
Mar. 2008 External Director of the Company (current)
Oct. 2018 President and Representative Director, CLEA Holdings Co., Ltd. (current)
Dec. 2021 Outside Director, CLEA Japan, Inc. (current)
Director (outside director): Shiro Nitanai
Born in 1958
Apr. 1984 Joined The Ministry of Posts and Telecommunications
Apr. 2005 General Manager, Businesses Development Department, Corporate Planning Division, Japan Post (currently Japan Post Holdings Co., Ltd.)
Oct. 2009 General Manager, Real Estate Planning Department, Real Estate Division, Japan Post Holdings Co., Ltd.
May 2019 Representative, Facility Design Lab (current)
Visiting professor, University of Tsukuba (current)
Adjunct Instructor, Toyo University (current)
Mar. 2020 External Director of the Company (current)
Director (outside director): Mariko Bando
Born in 1946
Jul. 1969 Entered the Prime Minister’s Office
Jul. 1989 Director, Consumer Statistics Division, Statistics Bureau of the Management and Coordination Agency
Apr. 1995 Vice-Governor, Saitama Prefecture
Jun. 1998 Consul General of Japan in Brisbane, Australia
Jan. 2001 Director General, Gender Equality Bureau, Cabinet Office
Oct. 2003 Member, The Board of Trustees, Showa Women’s University
Jul. 2016 Chancellor (Socho), Showa Women’s University (current)
Jun. 2017 Outside Director, MS&AD Insurance Group Holdings, Inc. (current)
Dec. 2019 Outside Director, Mitsubishi Research Institute, Inc. (current)
Auditor (full-time auditor): Atsushi Fukuhara
Born in 1948
Apr. 1984 Joined the former Itoki Kosakusho Co., Ltd.
Mar. 2009 Director of the Central Research Institute
Jan. 2012 Director of the Human Resources Management Department, Corporate Officer Planning Division
Jan. 2016 Director of the Risk Management Control Department of the Company’s Executive Officer Administration Division
Mar. 2016 Appointed full-time auditor of the Company (current)
Auditor (outside auditor):Osamu Ishihara
Born in 1960
Apr. 1987 Registered as Attorney-at-law in Tokyo Bar Association Joined Nishimura and Sanada
Oct. 1990 Joined TMI Associates
Apr. 1997 Partner, TMI Associates (current)
Mar. 2010 External Auditor, Odawara Engineering Co., Ltd. (current)
Apri.2012 Executive Governor, Japan Federation of Bar Associations Vice-President, Tokyo Bar Association
Apr. 2015 Vice-President, Kanto Federation of Bar Associations
Auditor (Outside auditor):Hisashi Shirahata
Born in 1962
Sep. 1985 Joined Aoyama Audit Corporation
Jul. 1988 Registered as Certified Public Accountant
Jul. 1999 Joined Aoyama Audit Corporation
Jul. 2000 Admitted as Partner (Shain) of ChuoAoyama Audit Corporation
Jul. 2002 Representative Partner (Daihyo-Shain) of ChuoAoyama Audit Corporation
Sep. 2006 Representative Partner (Daihyo-Shain) of PwC Aarata (currently PricewaterhouseCoopers Aarata LLC)
Jul. 2022 Outside Director, Information Development Co., Ltd. (current)
Note: The company and the corporation in the biographies of each officer above refer to the relevant company or corporation. “The Company” refers to Itoki Corporation.
Source: Company materials
Skills matrix of the Board of Directors’ Members
Executive officer structure
| Position | Name | Position | Name |
| Director, Managing Executive Officer |
Yoshiaki Moriya | Executive Officer | Akifumi Kakeda |
| Director, Managing Executive Officer |
Naoki Kaze | Executive Officer | Akihiro Tagashira |
| Director, Managing Executive Officer |
Junsei Shinada | Executive Officer | Masahiko Fujisawa |
| Managing Executive Officer | Makoto Ichikawa | Executive Officer | Katsuya Matsuda |
| Managing Executive Officer | Takeshi Otsuki | Masayoshi Kawamoto | |
| Managing Executive Officer | Kazuyoshi Nagao | Executive Officer | Naoyuki Okada |
| Managing Executive Officer | Tadashi Sawada | Executive Officer | Masashi Kinaka |
| Managing Executive Officer | Yoshihito Yamamura | Executive Officer | Hideki Nakasuji |
| Managing Executive Officer | Nobuyuki Hirao | Executive Officer | Yasuhiro Miyamoto |
| Executive Officer | Toshiya Shimizu | Executive Officer | Ichiro Washio |
| Executive Officer | Toshihiko Oda | Executive Officer | Satoshi Suga |
| Executive Officer | Takashi Kokyuryo | Executive Officer | Keiichiro Hirano |
| Executive Officer | Takeshi Ueda | Executive Officer | Yoshiko Yagi |
Source: Company materials
Sustainability
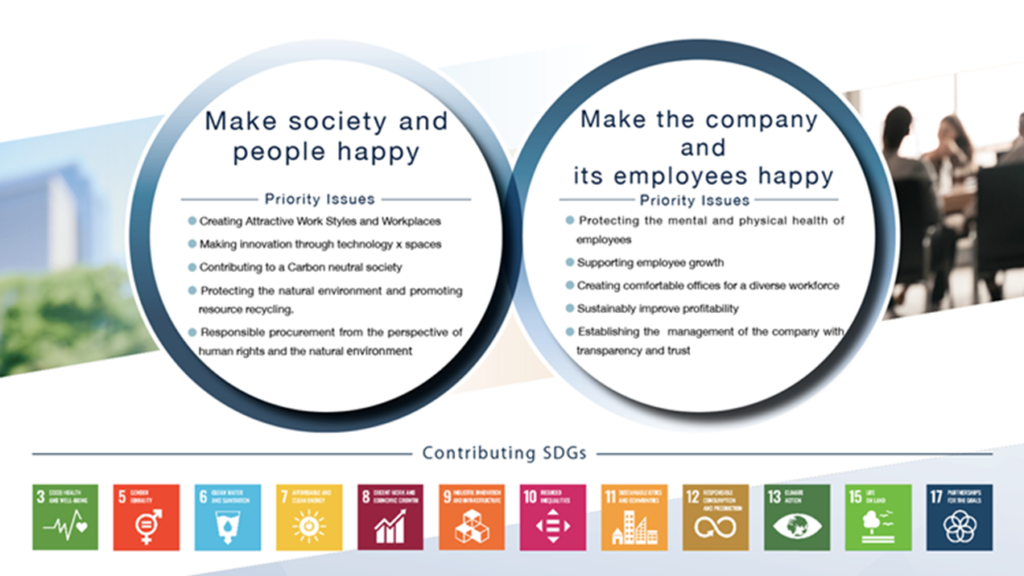
As the company is a manufacturing company, CO2 emissions are inevitable in office furniture and logistics equipment production. Therefore, the company is highly aware of the SDGs and ESGs and has prepared an integrated report since 2021. In addition, the ESGDATA BOOK was published in 2022. It details the company’s evaluation of its materiality, KPI performance and other information.
Particularly noteworthy is that it has developed a medium-term environmental plan regarding the environment, which communicates concrete and quantitative progress for each year. For greenhouse gas emissions, the plan sets out reduction targets not only for Scope 1 and 2 but also for Scope 3. Besides CO2 emissions, the plan also includes quantitative analyses of the introduction of renewable energy, carbon offsets, biodiversity, environmental accounting, etc.
About the SDGs, the following materialities have been defined. As noted before, there is scope for improvement in terms of diversity, but as per corporate governance, risk management and compliance systems are in place.
The company’s approach to materiality
Financial data (quarterly basis)
| FY (¥mn) | 2020/12 | 2021/12 | 2022/12 | |||||||||
| 1Q | 2Q | 3Q | 4Q | 1Q | 2Q | 3Q | 4Q | 1Q | 2Q | 3Q | 4Q | |
| [Statements of income] | ||||||||||||
| Net sales | 37,707 | 26,997 | 21,489 | 30,017 | 32,121 | 29,451 | 22,396 | 31,871 | 35,345 | 28,411 | 26,205 | 33,363 |
| Year-on-year basis (%) | 11.2 | -9.3 | -24.5 | -0.1 | -14.8 | 9.1 | 4.2 | 6.2 | 10.0 | -3.5 | 17.0 | 11.2 |
| Cost of sales | 23,710 | 17,765 | 13,811 | 19,036 | 20,101 | 18,729 | 14,443 | 20,872 | 21,483 | 18,030 | 16,678 | 21,384 |
| Gross profit | 13,997 | 9,232 | 7,678 | 10,981 | 12,020 | 10,722 | 7,953 | 10,999 | 13,862 | 10,381 | 9,527 | 11,979 |
| SG&A expenses | 10,996 | 9,602 | 9,590 | 9,901 | 10,352 | 9,453 | 9,203 | 10,150 | 9,898 | 9,973 | 9,812 | 11,484 |
| Operating income | 3,001 | -370 | -1,912 | 1,079 | 1,667 | 1,269 | -1,249 | 849 | 3,964 | 407 | -285 | 496 |
| Operating profit ratio (%) | 8.0 | -1.4 | -8.9 | 3.6 | 5.2 | 4.3 | -5.6 | 2.7 | 11.2 | 1.4 | -1.1 | 1.5 |
| Non-operating income | 154 | 162 | 251 | 237 | 240 | 161 | 171 | 122 | 125 | 164 | 171 | 96 |
| Non-operating expenses | 273 | 168 | 107 | 172 | 250 | 257 | 101 | 185 | 115 | 130 | 177 | 539 |
| Ordinary income | 2,882 | -376 | -1,768 | 1,143 | 1,657 | 1,173 | -1,179 | 786 | 3,974 | 442 | -291 | 52 |
| Extraordinary income | 0 | 6 | 125 | 980 | 1,255 | 78 | 133 | 88 | 786 | 139 | 118 | 6,762 |
| Extraordinary expenses | 116 | 42 | 55 | 1,503 | 20 | 456 | 518 | 1,474 | 44 | 64 | 38 | 3,465 |
| Income before income taxes | 2,766 | -412 | -1,697 | 620 | 2,893 | 795 | -1,565 | -600 | 4,716 | 516 | -211 | 3,351 |
| Total income taxes | 1,039 | 134 | -195 | 654 | 1,028 | 490 | -132 | -796 | 1,381 | 246 | -21 | 1,585 |
| Net income | 1,760 | -557 | -1,491 | 53 | 1,942 | 348 | -1,440 | 316 | 3,388 | 288 | -159 | 1,777 |
| Net income ratio (%) | 4.7 | -2.1 | -6.9 | 0.2 | 6.0 | 1.2 | -6.4 | 1.0 | 9.6 | 1.0 | -0.6 | 5.3 |
| [Balance Sheets] | ||||||||||||
| Current assets | 69,811 | 60,382 | 52,463 | 57,183 | 65,543 | 62,170 | 55,249 | 57,753 | 69,458 | 64,096 | 59,873 | 71,027 |
| Cash and deposits | 18,186 | 21,312 | 18,956 | 18,246 | 19,503 | 22,112 | 18,213 | 17,351 | 19,196 | 20,073 | 17,138 | 26,876 |
| Notes and accounts receivable - trade |
37,611 | 27,230 | 20,298 | 26,599 | 32,061 | 26,596 | 21,385 | 26,783 | 35,205 | 28,234 | 24,111 | 29,316 |
| Notes and accounts receivable - trade, and contract assets |
4,161 | 3,872 | 4,372 | 4,411 | ||||||||
| Non-current assets | 49,872 | 49,933 | 50,410 | 47,912 | 46,925 | 46,369 | 46,046 | 46,144 | 46,647 | 47,395 | 48,126 | 44,260 |
| Property, plant and equipment | 27,612 | 27,350 | 27,329 | 26,206 | 25,184 | 24,779 | 24,887 | 24,417 | 25,105 | 26,042 | 26,932 | 24,978 |
| Intangible assets | 5,113 | 5,623 | 5,853 | 5,590 | 5,504 | 5,419 | 4,885 | 4,114 | 4,128 | 4,168 | 4,145 | 1,819 |
| Goodwill | 2,391 | 2,207 | 2,189 | 2,093 | 2,018 | 2,016 | 1,407 | 1,317 | 1,214 | 1,222 | 1,200 | 517 |
| Investments and other assets | 17,146 | 16,959 | 17,227 | 16,116 | 16,236 | 16,170 | 16,273 | 17,612 | 17,413 | 17,184 | 17,048 | 17,462 |
| Total assets | 120,352 | 110,940 | 103,453 | 105,096 | 112,469 | 108,540 | 101,295 | 103,898 | 116,105 | 111,492 | 108,000 | 115,288 |
| Current liabilities | 55,449 | 46,097 | 40,198 | 43,646 | 49,245 | 45,266 | 40,307 | 42,544 | 51,837 | 47,138 | 43,655 | 49,099 |
| Short-term borrowings | 15,616 | 13,289 | 14,239 | 13,234 | 13,458 | 12,061 | 12,409 | 12,500 | 15,014 | 11,976 | 11,738 | 11,239 |
| Non-current liabilities | 18,327 | 18,220 | 18,079 | 17,259 | 17,506 | 17,088 | 16,257 | 16,277 | 16,334 | 16,020 | 16,178 | 16,278 |
| Long-term borrowings | 9,475 | 9,574 | 9,453 | 8,508 | 8,711 | 8,193 | 7,435 | 7,591 | 7,427 | 7,174 | 7,266 | 7,530 |
| Total liabilities | 73,777 | 64,318 | 58,277 | 60,906 | 66,751 | 62,354 | 56,565 | 58,822 | 68,172 | 63,158 | 59,833 | 65,377 |
| Total net assets | 46,575 | 46,621 | 45,175 | 44,189 | 45,717 | 46,186 | 44,730 | 45,076 | 47,933 | 48,333 | 48,166 | 49,910 |
| Shareholders’ equity | 46,123 | 46,197 | 44,768 | 43,812 | 45,419 | 45,872 | 44,454 | 44,931 | 47,837 | 48,254 | 48,117 | 49,871 |
| Share capital | 5,294 | 5,294 | 5,294 | 5,294 | 5,294 | 5,294 | 5,294 | 5,294 | 5,294 | 5,294 | 5,294 | 5,294 |
| Capital surplus | 9,201 | 9,642 | 9,641 | 9,628 | 9,628 | 9,632 | 9,632 | 9,638 | 9,638 | 9,638 | 9,638 | 9,638 |
| Retained earnings | 31,030 | 30,461 | 28,884 | 28,950 | 30,306 | 30,654 | 29,213 | 29,530 | 32,477 | 32,769 | 32,610 | 34,387 |
| Treasury shares | -46 | -6 | -33 | -182 | -182 | -161 | -161 | -161 | -161 | -134 | -134 | -134 |
| Share acquisition rights | 45 | 45 | 45 | 45 | 45 | 45 | 45 | 45 | 45 | 45 | ||
| Total liabilities and net assets | 120,352 | 110,940 | 103,453 | 105,096 | 112,469 | 108,540 | 101,295 | 103,898 | 116,105 | 111,492 | 108,000 | 115,288 |
| [Statements of cash flows] | ||||||||||||
| Cash flow from operating activities | 5,404 | -843 | 4,577 | -1,803 | 4,581 | 1,223 | ||||||
| Cash flow from investing activities | -1,442 | 290 | 503 | -1,673 | -1,410 | 6,333 | ||||||
| Cash flow from financing activities | 293 | -2,560 | -1,418 | -1,240 | -661 | -765 | ||||||
| Free cash flow | 3,962 | -553 | 5,080 | -3,476 | 3,171 | 7,556 | ||||||
| Net increase in cash and cash equiv. | 4,240 | -3,037 | 3,787 | -4,687 | 2,711 | 6,911 | ||||||
| Cash and cash equiv. at beginning of period |
15,494 | 19,735 | 16,697 | 20,485 | 15,797 | 18,509 | ||||||
| Cash and cash equiv. at end of period |
19,735 | 16,697 | 20,485 | 15,797 | 18,509 | 25,420 |
Source: Omega Investment from company materials
Financial data (full-year basis)
| FY (¥mn) | FY2012/12 | FY2013/12 | FY2014/12 | FY2015/12 | FY2016/12 | FY2017/12 | FY2018/12 | FY2019/12 | FY2020/12 | FY2021/12 | FY2022/12 |
| [Statements of income] | |||||||||||
| Net sales | 105,508 | 103,461 | 102,993 | 106,516 | 101,684 | 108,684 | 118,700 | 122,174 | 116,210 | 115,839 | 123,324 |
| Year-on-year basis (%) | 14.6 | -1.9 | -0.5 | 3.4 | -4.5 | 6.9 | 9.2 | 2.9 | -4.9 | -0.3 | 6.4 |
| Cost of sales | 70,027 | 67,118 | 66,797 | 68,374 | 65,021 | 69,966 | 77,436 | 80,495 | 74,322 | 74,145 | 77,575 |
| Gross profit | 35,481 | 36,343 | 36,196 | 38,142 | 36,663 | 38,718 | 41,264 | 41,679 | 41,888 | 41,694 | 45,749 |
| Gross profit ratio (%) | 33.6 | 35.1 | 35.1 | 35.8 | 36.1 | 35.6 | 34.8 | 34.1 | 36.0 | 36.0 | 37.1 |
| SG&A expenses | 32,040 | 32,203 | 33,723 | 33,836 | 33,862 | 35,761 | 39,339 | 40,776 | 40,089 | 39,158 | 41,167 |
| Operating income | 3,441 | 4,140 | 2,472 | 4,306 | 2,800 | 2,956 | 1,925 | 903 | 1,798 | 2,536 | 4,582 |
| Operating profit ratio (%) | 3.3 | 4.0 | 2.4 | 4.0 | 2.8 | 2.7 | 1.6 | 0.7 | 1.5 | 2.2 | 3.7 |
| Non-operating income | 813 | 813 | 841 | 898 | 771 | 750 | 889 | 677 | 804 | 694 | 556 |
| Non-operating expenses | 518 | 528 | 495 | 605 | 483 | 412 | 448 | 634 | 720 | 793 | 961 |
| Ordinary income | 3,735 | 4,425 | 2,818 | 4,599 | 3,087 | 3,295 | 2,365 | 945 | 1,881 | 2,437 | 4,177 |
| Extraordinary income | 269 | 685 | 615 | 171 | 97 | 228 | 919 | 27 | 1,111 | 1,554 | 7,805 |
| Extraordinary expenses | 352 | 238 | 262 | 524 | 267 | 121 | 204 | 35 | 1,716 | 2,468 | 3,611 |
| Income before income taxes | 3,653 | 4,872 | 3,171 | 4,246 | 2,918 | 3,401 | 3,081 | 938 | 1,277 | 1,523 | 8,372 |
| Total income taxes | 689 | 876 | 813 | -385 | 1,068 | 959 | 1,339 | 1,517 | 1,632 | 590 | 3,191 |
| Net income | 2,702 | 3,910 | 2,160 | 4,530 | 1,907 | 2,402 | 1,722 | -550 | -235 | 1,166 | 5,294 |
| Net income ratio (%) | 2.6 | 3.8 | 2.1 | 4.3 | 1.9 | 2.2 | 1.5 | -0.5 | -0.2 | 1.0 | 4.3 |
| [Balance Sheets] | |||||||||||
| Current assets | 49,294 | 52,925 | 55,714 | 56,342 | 52,410 | 58,147 | 62,143 | 58,109 | 57,183 | 57,753 | 71,027 |
| Cash and deposits | 17,441 | 19,553 | 21,211 | 21,456 | 19,839 | 19,977 | 16,229 | 17,030 | 18,246 | 17,351 | 26,876 |
| Notes and accounts receivable - trade |
24,935 | 26,243 | 25,965 | 26,138 | 23,241 | 26,869 | 33,160 | 28,244 | 26,599 | 26,783 | |
| Notes and accounts receivable - trade, and contract assets |
29,316 | ||||||||||
| Non-current assets | 39,961 | 42,335 | 41,007 | 41,832 | 43,271 | 44,073 | 46,559 | 49,955 | 47,912 | 46,144 | 44,260 |
| Property, plant and equipment | 27,928 | 28,193 | 27,041 | 26,395 | 25,322 | 24,426 | 26,362 | 27,781 | 26,206 | 24,417 | 24,978 |
| Intangible assets | 705 | 1,230 | 1,109 | 1,313 | 1,142 | 3,651 | 4,437 | 4,945 | 5,590 | 4,114 | 1,819 |
| Goodwill | 6 | 34 | 26 | 240 | 208 | 2,793 | 3,005 | 2,413 | 2,093 | 1,317 | 517 |
| Investments and other assets | 11,327 | 12,911 | 12,857 | 14,123 | 16,806 | 15,995 | 15,760 | 17,229 | 16,116 | 17,612 | 17,462 |
| Total assets | 89,256 | 95,261 | 96,721 | 98,175 | 95,681 | 102,221 | 108,703 | 108,778 | 105,096 | 103,898 | 115,288 |
| Current liabilities | 36,455 | 35,359 | 36,677 | 36,106 | 35,390 | 39,683 | 45,133 | 47,559 | 43,646 | 42,544 | 49,099 |
| Short-term borrowings | 11,222 | 11,473 | 11,087 | 10,940 | 11,760 | 12,564 | 11,721 | 15,533 | 13,234 | 12,500 | 11,239 |
| Non-current liabilities | 14,560 | 16,874 | 16,854 | 14,756 | 14,888 | 15,211 | 16,076 | 15,385 | 17,259 | 16,277 | 16,278 |
| Long-term borrowings | 4,122 | 5,124 | 5,089 | 5,171 | 5,296 | 5,328 | 5,113 | 6,633 | 8,508 | 7,591 | 7,530 |
| Total liabilities | 51,016 | 52,234 | 53,532 | 50,863 | 50,278 | 54,894 | 61,210 | 62,944 | 60,906 | 58,822 | 65,377 |
| Total net assets | 38,240 | 43,026 | 43,189 | 47,311 | 45,402 | 47,326 | 47,492 | 45,834 | 44,189 | 45,076 | 49,910 |
| Shareholders’ equity | 35,960 | 41,079 | 41,632 | 45,677 | 44,949 | 46,863 | 46,854 | 45,370 | 43,812 | 44,931 | 49,871 |
| Share capital | 5,277 | 5,277 | 5,277 | 5,277 | 5,277 | 5,277 | 5,277 | 5,294 | 5,294 | 5,294 | 5,294 |
| Capital surplus | 13,020 | 13,061 | 13,061 | 13,222 | 13,140 | 12,404 | 9,786 | 9,201 | 9,628 | 9,638 | 9,638 |
| Retained earnings | 18,520 | 22,073 | 23,556 | 29,223 | 30,504 | 32,315 | 31,104 | 29,862 | 28,950 | 29,530 | 34,387 |
| Treasury shares | -1,178 | -833 | -834 | -3,000 | -4,700 | -4,701 | 0 | -46 | -182 | -161 | -134 |
| Share acquisition rights | 45 | 45 | 45 | ||||||||
| Total liabilities and net assets | 89,256 | 95,261 | 96,721 | 98,175 | 95,681 | 102,221 | 108,703 | 108,778 | 105,096 | 103,898 | 115,288 |
| [Statements of cash flows] | |||||||||||
| Cash flow from operating activities | 8,259 | 3,162 | 5,715 | 4,522 | 5,072 | 3,565 | 1,384 | 3,586 | 4,561 | 2,774 | 5,804 |
| Cash flow from investing activities | -14 | -1,978 | -1,742 | -803 | -4,044 | -2,971 | -3,094 | -3,221 | -1,152 | -1,170 | 4,923 |
| Cash flow from financing activities | -1,652 | 51 | -2,179 | -3,807 | -2,571 | -706 | -2,463 | 0 | -2,267 | -2,658 | -1,426 |
| Free cash flow | 8,245 | 1,184 | 3,973 | 3,719 | 1,028 | 594 | -1,710 | 365 | 3,409 | 1,604 | 10,727 |
| Net increase in cash and cash equiv. | 6,601 | 1,944 | 1,814 | 184 | -1,619 | 88 | -4,031 | 952 | 1,203 | -900 | 9,622 |
| Cash and cash equiv. at beginning of period |
9,555 | 16,156 | 18,102 | 19,918 | 20,103 | 18,483 | 18,571 | 14,540 | 15,494 | 16,697 | 15,797 |
| Cash and cash equiv. at end of period |
16,156 | 18,102 | 19,918 | 20,103 | 18,483 | 18,571 | 14,540 | 15,494 | 16,697 | 15,797 | 25,420 |
Source: Omega Investment from company materials