2026-07-27
Home
Japanese

Omega Investment Co., Ltd.
Digital Hearts Holdings (Company note – 1Q update)

| Share price (9/7) | ¥1,130 | Dividend Yield (24/3 CE) | 1.86 % |
| 52weeks high/low | ¥2,053 / 1,109 | ROE(23/3) | 9.11 % |
| Avg Vol (3 month) | 95.2 thou shrs | Operating margin (23/3) | 7.38 % |
| Market Cap | ¥26.9 bn | Beta (5Y Monthly) | 0.90 |
| Enterprise Value | ¥24.8 bn | Shares Outstanding | 23.890 mn shrs |
| PER (24/3 CE) | 17.98 X | Listed market | TSE Prime section |
| PBR (23/3 act) | 2.90 X |
| Click here for the PDF version of this page |
| PDF Version |
Enterprise Business continues to grow, with double-digit revenue growth; preparations for the spin-off listing of AGEST make steady progress.
▷Summary of financial results: Double-digit revenue growth driven by Enterprise Business. Operating profit down due to strategic investments but broadly in line with plans. The Company aims for full-year profit growth.
Digital Hearts Holdings’ (hereafter referred to as ‘the Company’) FY2024/3 Q1 results showed a double-digit YoY increase in sales to 9.30 billion yen, driven by Enterprise Business. Operating profit decreased to 404 million yen, mostly in line with the plan, owing to lower sales in Entertainment Business and increased SG&A expenses due to strategic investments, including costs related to the spin-off listing of AGEST, Inc. Net profit attributable to owners of parent company fell by 18.3% to 338 million yen.
By segment, Enterprise Business sales were 4.66 billion yen (+29.9%), and operating profit was 83 million yen (+240.4%). Sales continued to grow, mainly at the core subsidiary AGEST, benefiting from the tailwind of DX acceleration and other factors. Although still at a lower level than Entertainment Business, operating profit increased substantially. Meanwhile, Entertainment Business sales were 4.66 billion yen (-3.3%), and operating profit was 844 million yen (-18.5%). This was resulted from a comparison to the high domestic debugging sales in the same period of the previous year, and the results were broadly in line with the plan. Segment profit declined due to lower sales and the impact of raising tester hourly wages to secure talented personnel.
▷Stock price trend: Adjustment continues.
The Company’s shares have been trading at around 1,300 yen since the announcement of the previous year’s results in May but have fallen further following the latest results announcement. This is presumably due to the lower Q1 results as well as the difficulty in communicating the full benefits of AGEST’s spin-off listing to investors, as noted in the previous report. The Company’s share price is expected to be revalued as earnings improve over the second half of the year and as preparations for the spin-off listing progress.
▷Full-year results for FY2024/3: Full-year forecasts are unaltered.
At the end of Q1, there is no change to the full-year forecast for FY2024/3. At the end of Q1, the Company maintained its forecasts for sales, operating profit and net profit attributable to owners of the parent at 40,750 million yen (+11.6%), 3,120 million yen (+4.0%) and 2,100 million yen (+162.6%) respectively, representing 22.8%, 13.0% and 16.1% of the full-year forecasts. The Company has stated that these are largely in line with its plans and aims to achieve a fourth consecutive year of operating profit growth, even after factoring in the cost of preparation for the spin-off listing (approximately 250 million yen), thanks to improved profitability in the second half of the year.
▷Spin-off listing of AGEST, Inc. : Preparations for listing are moving forward
AGEST, Inc.’s spin-off listing plan, which was announced in conjunction with the announcement of the previous year’s results, has already progressed and the lead underwriter and auditing firm have been appointed. At the same time, the Company has reallocated personnel and made mid-career hires to build up AGEST’s headquarters functions as a listed company. The plan appears to be progressing steadily as planned.
| JPY, mn, % | Net sales | YoY % |
Oper. profit |
YoY % |
Ord. profit |
YoY % |
Profit ATOP |
YoY % |
EPS (¥) |
DPS (¥) |
| 2020/3 | 21,138 | 9.8 | 1,394 | -13.2 | 1,372 | -16.9 | 792 | -49.7 | 36.31 | 14.00 |
| 2021/3 | 22,669 | 7.2 | 1,908 | 36.9 | 1,975 | 43.9 | 974 | 23.0 | 45.15 | 14.00 |
| 2022/3 | 29,178 | 28.7 | 2,696 | 41.3 | 2,774 | 40.4 | 1,778 | 82.5 | 82.25 | 15.00 |
| 2023/3 | 36,517 | 25.2 | 3,000 | 11.3 | 3,152 | 13.6 | 799 | -55.0 | 36.50 | 21.00 |
| 2024/3(CE) | 40,750 | 11.6 | 3,120 | 4.0 | 3,160 | 0.2 | 2,100 | 162.6 | 95.86 | 21.00 |
| 2023/3 Q1 | 8,372 | 37.3 | 634 | -0.3 | 632 | -5.6 | 413 | -15.1 | 19.14 | 0.00 |
| 2024/3 Q1 | 9,296 | 11.0 | 404 | -36.3 | 415 | -34.4 | 338 | -18.3 | 15.20 | 0.00 |
Full year consolidated sales / operating profit trend
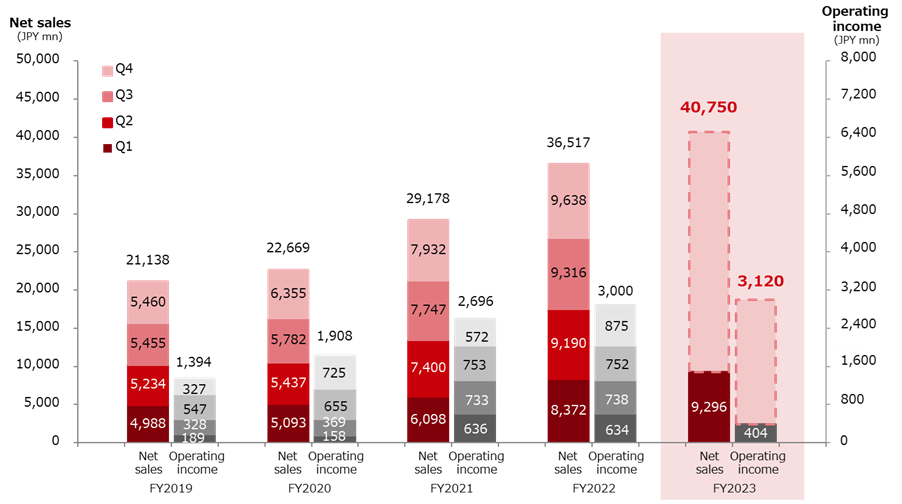
Source: The company handout for the 1st quarter results for FY2024/3 (published on August 10, 2023)
◇ Results for Q1 FY2024/3: Sales increased, and profits decreased. Enterprise Business continues to drive sales.
The Company’s Q1 FY2024/3 results were driven by Enterprise Business, which achieved record Q1 sales of 9,296 million yen, an increase of 11.0%. Operating profit fell to 404 million yen, or down by 36.3%, because of lower sales in Entertainment Business and increased SG&A expenses due to strategic investments, including costs for the spin-off listing of AGEST, Inc. The Company said Q1 results were mostly in line with the plan and aims to increase operating profit for the full year. Net profit attributable to owners of parent company fell to 338 million, or down by 18.3%.
For an analysis of changes on an EBITDA basis, see the diagram below. EBITDA in Enterprise Business increased by 47.7% to 274 million yen from 185 million yen in the same period of the previous year due to an increase in gross profit on higher sales, which offset a decrease in gross profit margin due to lower gross profit margins at overseas subsidiaries and higher SG&A expenses. On the other hand, Entertainment Business saw its gross profit decline by 18.3% from 1,123 million yen to 918 million yen, mainly due to lower gross profit and margins on lower sales.
Analysis of Changes in EBITDA
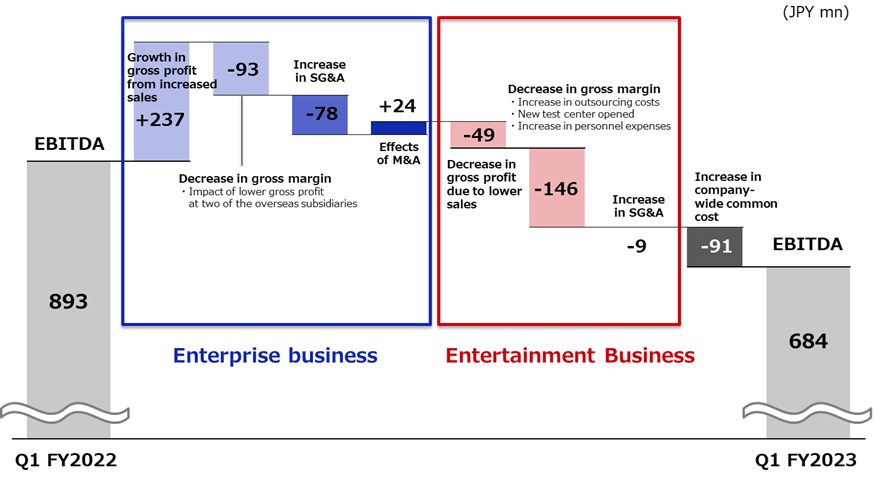
Source: The company handout for the 1st quarter results for FY2024/3 (published on August 10, 2023)
Sales/Profit by Segment (Quarterly basis)
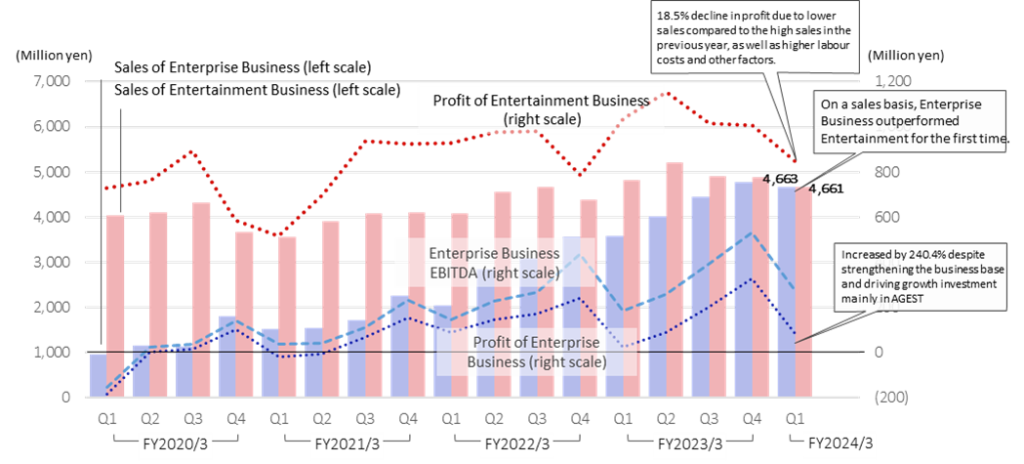
Source: Prepared by Omega Investment based on company data
◇ Trends by segment: (See also above and table on p. 7)
1) Enterprise Business: Sales: 4,663 million yen, +29.9%; operating profit: 83 million yen, +240.4%.
The expansion of existing businesses driven by DX and the added benefits of M&As, resulted in a YoY increase in sales of approximately 30%. The gross profit margin temporarily declined to 24.0% from 26.7% due to a decline in sales at two overseas subsidiaries and a deterioration in profitability caused by higher labour costs. Meanwhile, SG&A expenses remained under control at around 1 billion yen, while strategic investments were made to strengthen sales and recruitment. As a result, segment profit increased by 240.4% to 83 million yen. The segment profit margin also improved from 0.7% to 1.8%.
Trends in the sub-segments are as follows:
QA Solution: Sales: 3,101 million yen (+47.5%). Sales have expanded steadily, mainly at core subsidiary AGEST, Inc. , benefiting from the continued acceleration of DX and other tailwinds. The consolidation of GPC K.K (which became a subsidiary in April), which provides support for SAP implementation, began in Q1 and contributed to sales. The Company achieved a significant 38% YoY increase in sales, even excluding the effect of this M&A. The gross profit margin declined temporarily (28.2%, down 4.0 points YoY) due to lower sales at two overseas subsidiaries (DEVELOPING WORLD SYSTEMS, MK Partners) and the impact of higher labour costs. The Company is reviewing the management structure of these overseas subsidiaries and expects the gross profit margin to recover to above 30% from Q2 onwards.
AGEST. Inc., the core subsidiary, continued actively recruiting engineers, mainly by utilising the “Tech” brand, and promoted AGEST to raise its profile recognition. The Company continues to expand its “QA for Development” service, which is a high-value-added solution that supports quality not only through the implementation of tests at the end of the development process but also through the “Shift Left”, which supports quality from the upstream process of development, by launching new code analysis service following mutation testing.
For QA solution key KPIs, see the table below. The number of customers with orders at the end of Q1 increased YoY by 197, and the annual sales per client rose significantly to 13 million yen. The number of engineers was optimised at overseas subsidiaries in the previous year (-120). Still, the number of engineers in Japan alone increased by 206, which indicates a steady increase in the number of engineers.
IT services and others: Sales: 1,562 million yen (+5.1%). The security monitoring service grew by 27% as the Company captured increasing demand against the backdrop of the expansion of remote working and other factors. The business base is steadily expanding, with the number of registered engineers at identity Inc., which became a subsidiary in June 2021, reaching 29,000.
QA solutions key KPIs
FY2022/3 |
FY2023/3 |
FY2024/3 |
||||
Q4 |
Q1 |
Q2 |
Q3 |
Q4 |
Q1 |
|
Number of customers placing orders (companies) |
748 |
627 |
650 |
693 |
808 |
824 |
Average price per customer (million yen) |
10 |
10 |
12 |
12 |
13 |
13 |
Number of engineers (persons) |
924 |
961 |
1,026 |
993 |
1,009 |
1,047 |
Source: Prepared by Omega Investment based on company data
2) Entertainment Business: Sales: 4,661 million yen, down 3.3%; operating profit: 844 million yen, down 18.5%.
The decline in sales was partly due to a comparison to the high sales recorded in the previous year, particularly for console games. Profits fell by 18.5% due to lower sales and higher personnel costs, including increased hourly wage rates for game testers to secure talented personnel. Q1 results are mainly in line with Company forecasts. The Company expects sales and profits to recover in the second half of the year.
Domestic debugging: Sales: 3,171 million yen (-4.9%). Sales declined, largely as a reaction to the previous year when a series of major titles were launched in console games. Quarterly sales, however, remained high at 3.2 billion yen and were generally in line with Company plans. In addition to the decline in sales, the gross profit margin fell to 28.8% from 32.8% due to higher labour costs from the hourly wage increase implemented in April and the opening of a new base (Kumamoto). The Company expects the gross profit margin to recover to exceed 30% again in H2 due to sales growth and the penetration of price transfers.
Global and others: Sales: 1,490 million yen (+0.4%). Although uncertainty persists in the Chinese market, where the impact of gaming regulations remains, sales in the focused areas of global services (translation, LQA , and marketing support) grew by 13% YoY, excluding the impact of the restructuring of the Taiwanese business, etc. The Company is further promoting overseas alliances to build a global network by strengthening marketing personnel for the Korean business and localisation in Europe and the US.
◇ Forecast for FY2024/3: Initial forecasts unchanged.
At the end of Q1, there is no change to the full-year forecast for FY2024/3. The Company maintained its sales forecast of 40,750 million yen (+11.6%), operating profit of 3,120 million yen (+4.0%) and net profit attributable to owners of the parent of 2,100 million yen (+162.6%). Entertainment Business, in particular, saw a decline in revenue and profit, but the Company has already factored this in and expects a recovery in the second half of the year. At the end of Q1, the respective progress ratios were 22.8%, 13.0% and 16.1%. The Company expects that the cost of preparing for the spin-off listing (approximately 250 million yen) will be a negative factor on the profit side this year. Still, it aims to achieve its fourth consecutive year of operating profit growth due to earnings contribution from 2H onwards.
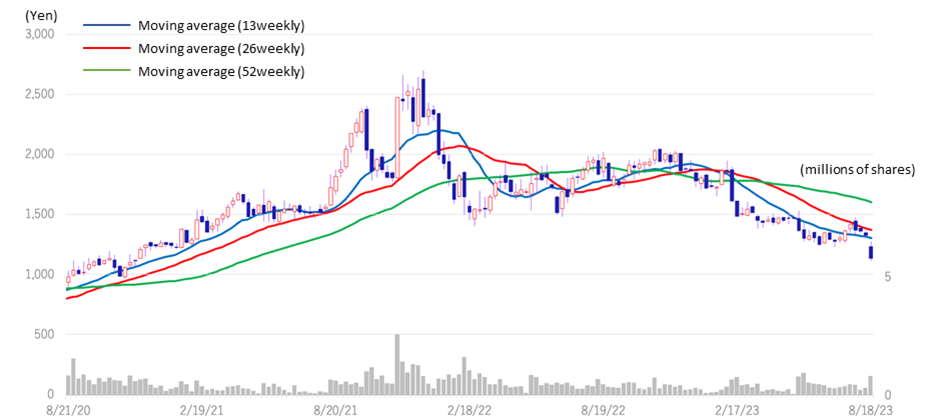
◇ Stock price trend: Adjustment phase continues, but future trends are closely monitored.
The Company’s share price fell sharply after the announcement of the previous year’s results in May. The share price temporarily fell below 1,300 yen and has remained at around 1,300 yen since then but has fallen further following the announcement of the latest results. It has fallen to less than half of its recent high of 2,700 yen, reached in December 2021. Although Enterprise Business is expected to continue to grow at a high rate, its contribution to profits is not as high as that of Entertainment Business. In the Entertainment Business, on the other hand, there is still uncertainty in the Chinese market and a reaction to the strong domestic debugging market in the previous year. The share price is also likely to be weighed down by weak profit growth in the full-year earnings forecast, partly due to the cost of preparing for the spin-off listing. However, Enterprise Business is expected to continue to grow at a high rate, and profits are expected to increase accordingly. It should also be noted that Entertainment Business has growth potential in global business and new fields. If these growth expectations materialise, earnings improve in the second half of the year, and preparations for the spin-off listing progress smoothly and investors become aware of the benefits of the scheme, a revaluation of the Company’s share price can be expected.
Digital Hearts Holdings (3676) Share Price Trend (3Year-to-date)
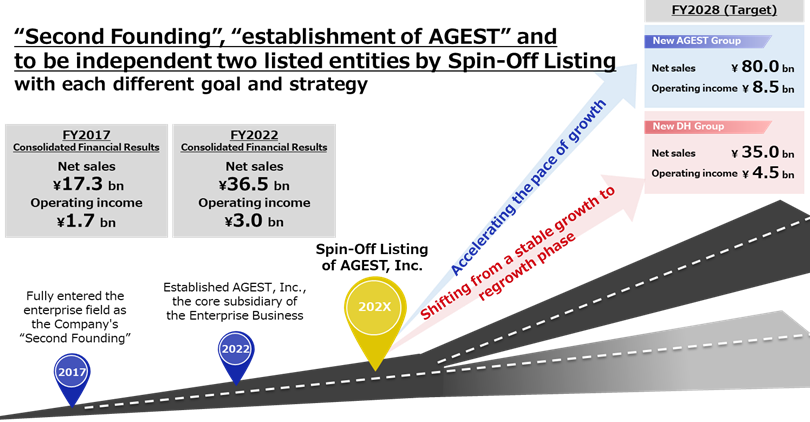
◇ Spin-off listing project of AGEST, Inc.
In conjunction with disclosing its financial results for FY2023/3, the Company announced that it had started preparations for the share-distribution-type spin-off and preparations for listing of AGEST, Inc. The Company entered Enterprise Business in earnest as a Second Founding in 2017. Initially, upfront investment weighed on the earnings, but in recent years sales have built up to a level comparable to Entertainment Business, and profitability has also become more established. In April 2022, following a group reorganization, Enterprise Business shifted to an organisational structure centred on the core company AGEST, Inc. The spin-off listing marks the group’s entry into a new growth stage.
The Company’s growth image after AGEST’s spin-off listing is shown in the diagram below. Enterprise Business will accelerate its business expansion and investment in growth to become the leading QA solution provider in the global market with the leading-edge quality technology. Meanwhile, Entertainment Business, which already occupies a dominant position as one of the major players in the domestic market, plans to grow as the Global Quality Partner in the Entertainment Industry by developing non-gaming fields and new technology-related fields in Japan, as well as by expanding global business with a view to Asia, Europe and the US.
Image of the spin-off listing of AGEST, Inc.
Source: The company handout for the 1st quarter results for FY2024/3 (published on August 10, 2023)
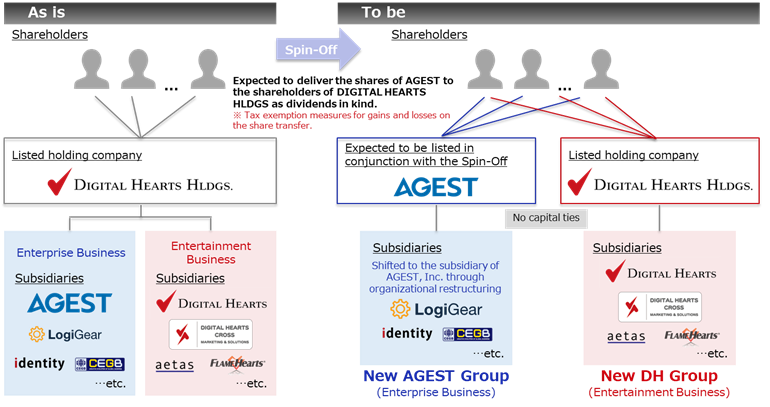
The spin-off of AGEST, Inc. is expected to accelerate the growth of the AGEST Group further, and if it is priced worthy of enterprise business valuations, the value of the whole group will improve further. The Company explains its spin-off listing scheme in the diagram on the following page. Digital Hearts Holdings, the current listed holding company, distributes AGEST shares to shareholders in kind. As a result, the capital relationship between AGEST and Digital Hearts Holdings is dissolved, and a parent-subsidiary listing is avoided. After the spin-off listing, the Company’s shareholders will own shares in both companies, i.e., AGEST and Digital Hearts Holdings.
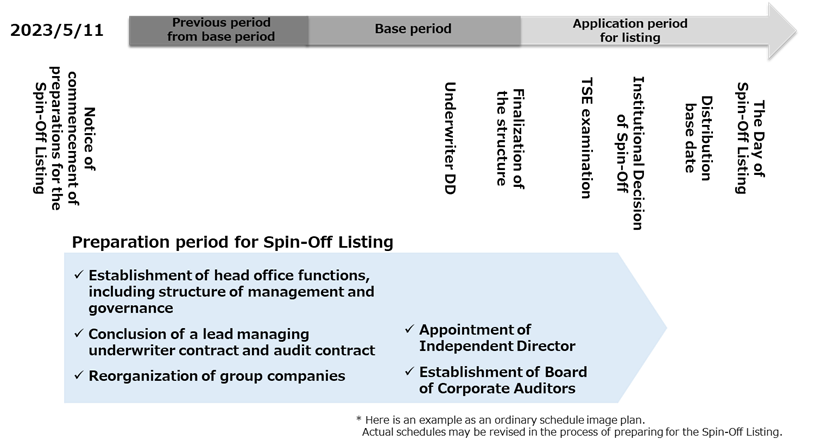
It is expected that a certain time will be required before the actual listing, with the details to be worked out over the next few years through preparation, scheme finalisation and examination by securities firms, auditing firms and the stock exchange. The Company has already appointed the lead underwriter and auditing firm. In addition, the Company is reallocating human resources and conducting mid-career recruitment to build up AGEST’s head office functions as a listed company. Preparations for the listing appear to be progressing steadily as planned.
The Company states that the expected effect of the spin-off listing is to maximise the growth potential of both businesses through the separation and independence of management, capital and human resources. To make the benefits of the spin-off listing known to shareholders, it is considered adequate to continue disseminating accurate information on the project’s progress.
Spin-off listing schemes
Source: The company handout for the 1st quarter results for FY2024/3 (published on August 10, 2023)
Spin-off schedule image
Source: The company handout for the 1st quarter results for FY2024/3 (published on August 10, 2023)
Financial data I
2021/3 |
2022/3 |
2023/3 |
2024/3 |
||||||||||
Q1 |
Q2 |
Q3 |
Q4 |
Q1 |
Q2 |
Q3 |
Q4 |
Q1* |
Q2* |
Q3* |
Q4* |
Q1 |
|
[Sales by segment] |
|||||||||||||
Net sales |
5,093 |
5,437 |
5,782 |
6,355 |
6,098 |
7,400 |
7,747 |
7,932 |
8,372 |
9,190 |
9,316 |
9,638 |
9,262 |
YoY |
2.1% |
3.9% |
6.0% |
16.4% |
19.7% |
36.1% |
34.0% |
24.8% |
37.3% |
24.2% |
20.3% |
21.5% |
11.0% |
Enterprise business |
1,523 |
1,540 |
1,710 |
2,246 |
2,029 |
2,833 |
3,074 |
3,553 |
3,589 |
4,025 |
4,451 |
4,774 |
4,663 |
YoY |
59.6% |
35.1% |
50.9% |
25.2% |
33.2% |
83.9% |
79.7% |
58.2% |
76.8% |
42.0% |
44.8% |
34.3% |
29.9% |
Composition of sales |
29.9% |
28.3% |
29.6% |
35.3% |
33.3% |
38.3% |
39.7% |
44.8% |
42.9% |
43.8% |
47.8% |
49.5% |
50.2% |
QA solution |
1,129 |
1,127 |
1,267 |
1,633 |
1,395 |
1,572 |
1,772 |
2,121 |
2,102 |
2,481 |
2,730 |
3,166 |
3,101 |
YoY |
– |
– |
– |
– |
23.6% |
39.5% |
39.9% |
29.9% |
50.7% |
57.8% |
54.1% |
49.3% |
47.5% |
Composition of sales |
22.2% |
20.7% |
21.9% |
25.7% |
22.9% |
21.2% |
22.9% |
26.7% |
25.1% |
27.0% |
29.3% |
32.8% |
33.9% |
IT services and others |
393 |
413 |
442 |
613 |
634 |
1,260 |
1,301 |
1,432 |
1,486 |
1,543 |
1,721 |
1,608 |
1,562 |
YoY |
– |
– |
– |
– |
61.3% |
205.1% |
194.3% |
133.6% |
134.3% |
22.4% |
32.3% |
12.4% |
5.1% |
Composition of sales |
7.7% |
7.6% |
7.6% |
9.6% |
10.4% |
17.0% |
16.8% |
18.1% |
17.7% |
16.8% |
18.5% |
16.7% |
16.8% |
Entertainment business |
3,566 |
3,900 |
4,072 |
4,109 |
4,069 |
4,566 |
4,672 |
4,378 |
4,818 |
5,201 |
4,906 |
4,889 |
4,661 |
YoY |
-11.6% |
-4.7% |
-5.8% |
12.1% |
14.0% |
17.1% |
14.7% |
6.6% |
18.4% |
13.9% |
5.0% |
11.7% |
-3.3% |
Composition of sales |
70.0% |
71.7% |
70.4% |
64.7% |
66.7% |
61.7% |
60.3% |
55.2% |
57.6% |
56.6% |
52.7% |
50.7% |
50.1% |
Domestic debugging |
2,681 |
2,846 |
2,953 |
3,054 |
2,931 |
3,030 |
3,149 |
3,011 |
3,334 |
3,561 |
3,220 |
3,720 |
3,171 |
YoY |
– |
– |
– |
– |
9.3% |
6.4% |
6.7% |
-1.4% |
13.7% |
17.5% |
2.2% |
8.6% |
-4.9% |
Composition of sales |
52.7% |
52.4% |
51.1% |
48.1% |
48.1% |
41.0% |
40.7% |
38.0% |
39.8% |
38.8% |
34.6% |
33.9% |
34.1% |
Global and others |
887 |
1,050 |
1,118 |
1,054 |
1,137 |
1,536 |
1,522 |
1,366 |
1,484 |
1,640 |
1,685 |
1,620 |
1,490 |
YoY |
– |
– |
– |
– |
28.2% |
46.3% |
36.1% |
29.6% |
30.4% |
6.8% |
10.7% |
18.5% |
0.4% |
Composition of sales |
17.4% |
19.3% |
19.3% |
16.6% |
18.7% |
20.8% |
19.7% |
17.2% |
17.7% |
17.8% |
18.1% |
16.8% |
16.0% |
Operating profit |
158 |
369 |
655 |
725 |
636 |
733 |
753 |
572 |
634 |
738 |
752 |
875 |
404 |
YoY |
-16.4% |
12.4% |
19.7% |
121.3% |
301.3% |
98.5% |
14.9% |
-21.1% |
-0.3% |
0.6% |
-0.2% |
52.8% |
-36.3% |
Operating profit margin |
3.1% |
6.8% |
11.3% |
11.4% |
10.4% |
9.9% |
9.7% |
7.2% |
7.6% |
8.0% |
8.1% |
9.1% |
4.3% |
Enterprise business |
-21 |
-7 |
64 |
152 |
87 |
144 |
171 |
241 |
24 |
79 |
194 |
340 |
83 |
YoY |
– |
– |
360.3% |
51.3% |
– |
– |
163.8% |
58.7% |
-72.0% |
-45.2% |
13.3% |
40.6% |
240.4% |
Segment profit margin |
-1.4% |
-0.5% |
3.8% |
6.8% |
4.3% |
5.1% |
5.6% |
6.8% |
0.7% |
2.0% |
4.4% |
7.1% |
1.8% |
Entertainment business |
517 |
700 |
936 |
923 |
930 |
975 |
978 |
783 |
1,036 |
1,155 |
1,014 |
1,008 |
844 |
YoY |
-28.9% |
-8.0% |
5.0% |
57.9% |
79.9% |
39.3% |
4.5% |
-15.2% |
11.4% |
18.5% |
3.6% |
28.8% |
-18.5% |
Segment profit margin |
14.5% |
17.9% |
23.0% |
22.5% |
22.9% |
21.4% |
20.9% |
17.9% |
21.5% |
22.2% |
20.7% |
20.6% |
18.1% |
(Unit: million yen)
Note: * The provisional accounting treatment for the business consolidation was finalised in the fourth quarter of FY2023/3 and is reflected in the operating profit of the Corporate and Enterprise Business. In addition, the sub-segmentation of Enterprise Business was changed from FY2023/3. Total and overall segment totals may not match due to sales and operating profit adjustments.
Source: Omega Investment, based on company data
Financial data II
2021/3 |
2022/3 |
2023/3 |
2024/3 |
||||||||||
Q1 |
Q2 |
Q3 |
Q4 |
Q1 |
Q2 |
Q3 |
Q4 |
Q1* |
Q2* |
Q3* |
Q4* |
Q1 |
|
[Statements of income] |
|||||||||||||
Net sales |
5,093 |
5,437 |
5,782 |
6,355 |
6,098 |
7,400 |
7,747 |
7,932 |
8,372 |
9,190 |
9,316 |
9,638 |
9,296 |
Cost of sales |
3,819 |
4,002 |
4,001 |
4,700 |
4,271 |
5,290 |
5,579 |
5,645 |
5,899 |
6,478 |
6,690 |
6,817 |
6,890 |
Gross profit |
1,273 |
1,437 |
1,781 |
1,655 |
1,827 |
2,109 |
2,167 |
2,287 |
2,472 |
2,713 |
2,625 |
2,820 |
2,406 |
SG&A expenses |
1,115 |
1,067 |
1,126 |
1,150 |
1,191 |
1,375 |
1,414 |
1,714 |
1,837 |
1,970 |
1,868 |
1,961 |
2,001 |
Operating profit |
158 |
369 |
655 |
725 |
636 |
733 |
753 |
572 |
634 |
738 |
752 |
875 |
404 |
Non-operating income |
38 |
10 |
24 |
5 |
38 |
31 |
12 |
30 |
5 |
150 |
78 |
-14 |
15 |
Non-operating expenses |
2 |
3 |
4 |
10 |
4 |
4 |
5 |
21 |
7 |
4 |
11 |
44 |
4 |
Ordinary profit |
194 |
376 |
675 |
720 |
670 |
760 |
759 |
582 |
632 |
889 |
824 |
800 |
415 |
Extraordinary income |
19 |
32 |
|
13 |
66 |
1 |
1 |
– |
– |
41 |
33 |
– |
|
Extraordinary expenses |
82 |
13 |
16 |
415 |
2 |
42 |
32 |
35 |
– |
6 |
171 |
1,052 |
2 |
Net profit before income taxes |
113 |
381 |
691 |
318 |
681 |
785 |
730 |
547 |
632 |
882 |
694 |
-218 |
412 |
Total income taxes |
38 |
122 |
224 |
145 |
189 |
281 |
233 |
35 |
198 |
306 |
216 |
418 |
79 |
Net profit attributable to
|
99 |
256 |
438 |
180 |
487 |
429 |
445 |
415 |
413 |
533 |
450 |
-601 |
338 |
[Balance Sheets] |
|||||||||||||
Current assets |
6,648 |
7,291 |
8,017 |
9,744 |
9,604 |
9,848 |
10,658 |
10,392 |
10,874 |
12,182 |
11,569 |
12,528 |
12,160 |
Cash and deposits |
3,027 |
3,482 |
4,085 |
5,076 |
4,911 |
5,435 |
5,746 |
5,208 |
5,573 |
6,850 |
5,948 |
6,456 |
6,240 |
Notes and accounts receivable |
2,889 |
3,099 |
3,201 |
4,097 |
|||||||||
Notes, accounts receivable andcontract assets |
4,161 |
3,872 |
4,372 |
4,411 |
4,614 |
4,672 |
4,930 |
5,377 |
5,120 |
||||
Non-current assets |
3,205 |
3,167 |
3,160 |
4,593 |
6,321 |
6,178 |
6,342 |
7,217 |
8,158 |
8,505 |
8,343 |
7,052 |
7,234 |
Tangible fixed assets |
560 |
549 |
565 |
598 |
602 |
623 |
621 |
693 |
1,067 |
1,077 |
1,100 |
1,169 |
1,259 |
Intangible fixed assets |
1,445 |
1,424 |
1,433 |
2,670 |
4,389 |
4,244 |
4,225 |
5,139 |
5,206 |
5,750 |
5,593 |
4,188 |
4,146 |
Goodwill |
1,032 |
991 |
950 |
2,467 |
4,175 |
4,042 |
3,945 |
4,588 |
4,812 |
5,301 |
5,082 |
3,468 |
3,411 |
Investments and other asset |
1,199 |
1,193 |
1,161 |
1,324 |
1,330 |
1,309 |
1,495 |
1,384 |
1,883 |
1,678 |
1,649 |
1,694 |
1,828 |
Total assets |
9,854 |
10,459 |
11,177 |
14,338 |
15,925 |
16,026 |
17,001 |
17,610 |
19,033 |
20,688 |
19,913 |
19,581 |
19,394 |
Current liabilities |
4,450 |
4,655 |
5,061 |
7,904 |
8,954 |
8,775 |
9,354 |
9,679 |
10,759 |
11,330 |
9.495 |
9,930 |
10,126 |
Short-term borrowings |
2,546 |
2,551 |
2,552 |
4,728 |
5,534 |
5,406 |
5,406 |
5,421 |
6,806 |
7,106 |
5,106 |
5,106 |
5,606 |
Non-current liabilities |
62 |
132 |
135 |
119 |
294 |
55 |
58 |
364 |
162 |
154 |
113 |
176 |
185 |
Long-term debt |
– |
66 |
65 |
63 |
236 |
– |
– |
169 |
– |
– |
– |
– |
– |
Total liabilities |
4,513 |
4,788 |
5,196 |
8,024 |
9,249 |
8,830 |
9,413 |
10,044 |
10,921 |
11,485 |
9,608 |
10,107 |
10,311 |
Total net assets |
5,340 |
5,670 |
5,980 |
6,314 |
6,677 |
7,196 |
7,588 |
7,566 |
8,111 |
9,202 |
10,304 |
9,474 |
9,082 |
Shareholders’ equity |
4,841 |
5,172 |
5,460 |
5,642 |
5,983 |
6,436 |
6,719 |
6,774 |
7,030 |
7,779 |
8,838 |
8,283 |
8,061 |
Capital |
300 |
300 |
300 |
300 |
300 |
300 |
300 |
300 |
300 |
300 |
300 |
300 |
300 |
Legal capital reserve |
355 |
331 |
331 |
331 |
331 |
338 |
338 |
– |
– |
60 |
375 |
393 |
66 |
Retained earnings |
6,848 |
7,105 |
7,393 |
7,575 |
7,916 |
8,342 |
8,626 |
9,019 |
9,275 |
9,809 |
10,031 |
9,427 |
9,532 |
Treasury shares |
-2,662 |
-2,565 |
-2,565 |
-2,565 |
-2,565 |
-2,545 |
-2,546 |
-2,545 |
-2,545 |
-2,391 |
-1,868 |
-1,838 |
-1,838 |
Stock acquisition right |
13 |
13 |
13 |
13 |
– |
– |
– |
– |
– |
10 |
6 |
6 |
– |
Total liabilities and net assets |
9,854 |
10,459 |
11,177 |
14,338 |
15,925 |
16,026 |
17,001 |
17,610 |
19,033 |
20,688 |
19,913 |
19,581 |
19,394 |
[Statements of cash flows] |
|||||||||||||
Cash flow from operating activities |
101 |
1,416 |
1,703 |
3,077 |
1,430 |
2,850 |
|||||||
Net profit before taxes |
494 |
1,504 |
1,466 |
2,744 |
1,520 |
1,996 |
|||||||
Cash flow from investing activities |
-261 |
-1,813 |
-1,682 |
-2,537 |
-1,496 |
-1,903 |
|||||||
Cash flow from financing activities |
|
-90 |
|
1,730 |
|
316 |
-546 |
1,488 |
141 |
||||
Free cash flow |
-160 |
-397 |
21 |
540 |
-66 |
947 |
|||||||
Net increase (decrease) in cash
|
-252 |
1,341 |
359 |
132 |
1,676 |
1,283 |
|||||||
Cash and cash equivalents
|
3,704 |
3,704 |
5,041 |
5.041 |
5,173 |
5,173 |
|||||||
Cash and cash equivalents
|
3,447 |
5,041 |
5,400 |
5,173 |
6,850 |
6,456 |
Unit: million yen.
Note: In the fourth quarter of FY2023/3, the provisional accounting treatment for the business consolidation was finalised and reflected in operating profit in the PL. Other than this, no adjustments have been made for profits below ordinary profit, BS and CF, as they are not disclosed.
Source: Omega Investment, based on company data.
Financial data (full year basis )
FY2014/3 |
FY2015/3 |
FY2016/3 |
FY2017/3 |
FY2018/3 |
FY2019/3 |
FY2020/3 |
FY2021/3 |
FY2022/3 |
FY2023/3 |
|
[Statements of income] |
||||||||||
Net sales |
10,137 |
13,285 |
15,011 |
15,444 |
17,353 |
19,254 |
21,138 |
22,669 |
29,178 |
36,517 |
YoY (%) |
– |
31.0 |
13.0 |
2.9 |
12.4 |
11.0 |
9.8 |
7.2 |
28.7 |
25.2 |
Cost of sales |
6,653 |
9,336 |
10,690 |
10,938 |
12,394 |
13,791 |
15,566 |
16,235 |
20,787 |
25,885 |
Gross profit |
3,484 |
3,948 |
4,320 |
4,506 |
4,958 |
5,463 |
5,571 |
6,433 |
8,391 |
10,632 |
SG&A expenses |
1,703 |
2,431 |
2,356 |
2,599 |
3,222 |
3,857 |
4,177 |
4,524 |
5,695 |
7,631 |
Operating profit |
1,780 |
1,517 |
1,963 |
1,906 |
1,735 |
1,605 |
1,394 |
1,908 |
2,696 |
3,000 |
YoY (%) |
– |
14.8 |
29.4 |
-2.9 |
-9.0 |
-7.5 |
-13.2 |
36.9 |
41.3 |
11.3 |
Operating profit margin (%) |
17.6 |
11.4 |
13.1 |
12.3 |
10.0 |
8.3 |
6.6 |
8.4 |
9.2 |
8.2 |
Non-operating income |
22 |
66 |
43 |
128 |
57 |
109 |
22 |
80 |
112 |
220 |
Non-operating expenses |
15 |
57 |
49 |
37 |
10 |
63 |
44 |
13 |
34 |
68 |
Ordinary profit |
1,788 |
1,525 |
1,958 |
1,997 |
1,782 |
1,651 |
1,372 |
1,975 |
2,774 |
3,152 |
Extraordinary income |
18 |
|
9 |
17 |
2 |
733 |
|
55 |
83 |
75 |
Extraordinary expenses |
14 |
|
835 |
573 |
151 |
51 |
75 |
526 |
112 |
1,231 |
Net profit before income taxes |
1,792 |
1,525 |
1,132 |
1,441 |
1,632 |
2,333 |
1,296 |
1,504 |
2,749 |
1,996 |
Total income taxes |
700 |
975 |
734 |
641 |
503 |
745 |
499 |
530 |
739 |
1,109 |
Net profit attributable to
|
1,087 |
539 |
361 |
795 |
1,200 |
1,575 |
792 |
974 |
1,778 |
799 |
YoY (%) |
– |
-50.4 |
-33.0 |
119.7 |
51.0 |
31.3 |
-49.7 |
23.0 |
82.7 |
-55.0 |
Net profit margin (%) |
10.7 |
4.1 |
2.4 |
5.1 |
6.9 |
8.2 |
3.7 |
4.3 |
6.1 |
2.2 |
[Supplementary data] |
||||||||||
EPS |
45.96 |
22.61 |
15.72 |
35.58 |
55.14 |
72.13 |
36.31 |
45.15 |
82.25 |
36.50 |
ROE (%) |
33.6 |
13.8 |
10.5 |
29.2 |
40.0 |
38.6 |
16.3 |
18.4 |
28.0 |
10.1 |
ROA (%) |
29.8 |
19.8 |
26.5 |
28.2 |
22.0 |
17.9 |
13.4 |
15.8 |
17.4 |
17.0 |
Dividend |
16.00 |
34.00 |
38.00 |
23.00 |
11.50 |
13.00 |
14.00 |
14.00 |
15.00 |
21.00 |
Dividend payout ratio (%) |
16.3 |
37.6 |
60.4 |
32.3 |
20.9 |
18.0 |
38.6 |
31.0 |
18.2 |
57.5 |
[Balance Sheets] |
||||||||||
Current assets |
5,549 |
5,756 |
5,064 |
6,221 |
6,732 |
7,403 |
7,453 |
9,744 |
10,392 |
12,528 |
Cash and deposits |
3,693 |
3,058 |
2,197 |
3,344 |
3,894 |
4,197 |
3,739 |
5,076 |
5,208 |
6,456 |
Notes and accounts receivable |
1,483 |
2,374 |
2,230 |
1,942 |
2,480 |
2,724 |
2,985 |
4,097 |
||
Notes, accounts receivable andcontract assets |
4,411 |
5,377 |
||||||||
Non-current assets |
1,611 |
2,516 |
1,469 |
1,430 |
1,842 |
2,428 |
6,178 |
6,342 |
7,217 |
7,052 |
Tangible fixed assets |
323 |
368 |
299 |
298 |
473 |
558 |
579 |
598 |
693 |
1,169 |
Intangible fixed assets |
695 |
1,505 |
580 |
238 |
286 |
763 |
1,379 |
2,670 |
5,139 |
4,188 |
Goodwill |
595 |
1,169 |
437 |
201 |
150 |
481 |
1,027 |
2,467 |
4,588 |
3,468 |
Investments and other assets |
592 |
642 |
589 |
893 |
1,082 |
1,107 |
1,225 |
1,324 |
1,384 |
1,694 |
Total assets |
7,160 |
8,272 |
6,533 |
7,651 |
8,575 |
9,832 |
10,637 |
14,338 |
17,610 |
19,581 |
Current liabilities |
3,372 |
3,823 |
3,374 |
3,759 |
3,929 |
4,192 |
5,134 |
7,904 |
9,679 |
9,930 |
Short-term borrowings |
1,610 |
1,603 |
1,299 |
1,630 |
1,600 |
1,704 |
2,546 |
4,728 |
5,421 |
5,106 |
Non-current liabilities |
20 |
280 |
69 |
1,033 |
1,075 |
627 |
63 |
119 |
364 |
176 |
Long-term debt |
12 |
216 |
46 |
2 |
– |
50 |
– |
63 |
169 |
– |
Total liabilities |
3,393 |
4,104 |
3,444 |
4,793 |
5,005 |
4,819 |
5,198 |
8,024 |
10,044 |
10,107 |
Total net assets |
3,766 |
4,168 |
3,089 |
2,858 |
3,570 |
5,012 |
5,438 |
6,314 |
7,566 |
9,474 |
Shareholders’ equity |
3,687 |
4,036 |
2,773 |
2,590 |
3,340 |
4,763 |
4,898 |
5,642 |
6,774 |
8,283 |
Capital |
300 |
300 |
300 |
300 |
300 |
300 |
300 |
300 |
300 |
300 |
Legal capital reserve |
300 |
300 |
368 |
277 |
331 |
366 |
355 |
331 |
– |
393 |
Retained earnings |
3,086 |
3,435 |
3,604 |
4,164 |
5,113 |
6,408 |
6,904 |
7,575 |
9,019 |
9,427 |
Treasury shares |
0 |
0 |
-1,499 |
-2,152 |
-2,405 |
-2,311 |
-2,662 |
-2,565 |
-2,545 |
-1,838 |
Stock acquisition right |
|
14 |
14 |
|
|
13 |
13 |
13 |
– |
6 |
Total liabilities and net assets |
7,160 |
8,272 |
6,533 |
7,651 |
8,575 |
9,832 |
10,637 |
14,338 |
17,610 |
19,581 |
Equity Ratio (%) |
51.9 |
49.5 |
43.1 |
34.4 |
39.3 |
48.7 |
46.3 |
39.7 |
39.7 |
45.0 |
BPS |
155.63 |
171.30 |
125.80 |
119.96 |
154.61 |
219.06 |
228.62 |
263.32 |
323.21 |
395.65 |
[Statements of cash flows] |
||||||||||
Cash flow from operating activities |
1,561 |
870 |
1,080 |
1,825 |
1,436 |
889 |
1,086 |
1,416 |
3,077 |
2,850 |
Net profit before taxes |
1,792 |
1,525 |
1,132 |
1,441 |
1,632 |
2,333 |
1,296 |
1,504 |
2,744 |
1,996 |
Cash flow from investing activities |
-368 |
-568 |
-17 |
-610 |
-618 |
62 |
-1,018 |
-1,813 |
-2,537 |
-1,903 |
Cash flow from financing activities |
308 |
-950 |
-1,913 |
-69 |
-250 |
-693 |
-515 |
1,730 |
-546 |
141 |
Free cash flow |
1,193 |
302 |
1,063 |
1,215 |
818 |
951 |
68 |
-397 |
540 |
947 |
Cash and cash equivalents
|
1,508 |
-634 |
-860 |
1,146 |
564 |
258 |
-458 |
1,341 |
132 |
1,283 |
Cash and cash equivalents
|
2,184 |
3,693 |
3,058 |
2,197 |
3,344 |
3,894 |
4,162 |
3,704 |
5,041 |
5,173 |
Cash and cash equivalents
|
3,693 |
3,058 |
2,197 |
3,344 |
3,894 |
4,162 |
3,704 |
5,041 |
5,173 |
6,456 |
Unit: million yen.
Note: In FY2023/3, the provisional accounting treatment for the business consolidation was finalised, and the respective figures for FY2023/3 reflect the details of the provisional accounting treatment finalised. Other than this, no revisions have been made for ordinary profit and below, BS and CF as they are not disclosed.
Source: Omega Investment, based on company data.