2026-07-27
Home
Japanese

Omega Investment Co., Ltd.
Itoki (Company note – 2Q update)

| Share price (8/21) | ¥1,311 | Dividend Yield (23/12 CE) | 2.44 % |
| 52weeks high/low | ¥1,399/395 | ROE(TTM) | 13.35 % |
| Avg Vol (3 month) | 354.6 thou shrs | Operating margin (TTM) | 5.64 % |
| Market Cap | ¥59.86 bn | Beta (5Y Monthly) | 1.00 |
| Enterprise Value | ¥52.06 bn | Shares Outstanding | 45.664 mn shrs |
| PER (23/12 CE) | 12.37 X | Listed market | TSE Prime |
| PBR (22/12 act) | 1.11 X |
| Click here for the PDF version of this page |
| PDF Version |
Record first-half sales and operating profit on the back of solid demand. The company revised up full-year profits and dividends.
◇ Summary of 2Q results for FY12/2023: Sales up 7% and operating profit up 60% on the back of solid office furniture demand
Itoki’s (hereinafter ‘the company’) FY12/2023 2Q results (cumulative) showed a 7% YoY increase in sales and a 60% increase in operating profit, with both reaching record highs. Sales were strong, mainly due to renewal projects and office relocations. In addition to the effect of increased sales, profit margins improved due to enhanced customer value and came in higher than forecast.
By segment, the mainstay Workplace business recorded sales of 49.0 billion yen (+9.5% YoY) and an operating profit of 5.2 billion yen (+95.3%), while Equipment / Public business recorded sales of 18.2 billion yen (+0.5%) and operating profit of 1.5 billion yen (+3.3%). Both segments achieved increases in sales and profit.
As per 2Q alone, the company posted sales of 31.2 billion yen (+9.9% YoY), an operating profit of 2.2 billion yen (+446.7% YoY) and net profit attributable to owner of parent of 1.4 billion yen (+389.9% YoY), demonstrating outstanding performance.
Given the strong performance so far achieved, the company revised up its full-year earnings forecasts and dividend forecasts at the time of the result announcement. While the sales estimate remains unchanged at 130 billion yen, the company has raised forecasts for operating profit (from 6.5 billion yen to 7.5 billion yen), recurring profit (from 6.5 billion yen to 7.5 billion yen) and net profit attributable to owners of the parent (from 3.7 billion yen to 4.8 billion yen). The dividend forecast has also been revised upwards from 25 yen a share to 32 yen (37 yen last year, which included a special dividend of 20 yen).
As of the end of 2Q, against the revised full-year forecasts, the company has achieved 52% of the sales, 93% of operating profit and 98% of net profit attributable to owner of parent. As is known, the company’s results are biased towards 1Q. Nonetheless, further upward revisions look likely, given the current situation.
◇ Stock price: Up 124% since the beginning of the year; PBR has recovered to 1x.
The company’s share price has risen 124% YTD. Over the same period, the share prices of its peers rose between 22% and 53%, highlighting the company’s stellar performance. Over one year, the share price boosted 3.3 times, sending PBR, which had been a concern, to 1x. This results from investors rating the improvement in profitability favourably, which reflects the strong demand for Workplace business, including renewal projects to accommodate new ways of working, and the company’s focus on increasing the customer value of its offerings.
As mentioned, there is further upside to the earnings, so the share price may rise further.
JPY, mn, % |
Net sales |
YoY
|
Oper.
|
YoY
|
Ord.
|
YoY
|
Profit
|
YoY
|
EPS
|
DPS
|
2020/12 |
116,210 |
-4.9 |
1,798 |
99.1 |
1,881 |
99.0 |
-235 |
– |
-5.18 |
13.00 |
2021/12 |
115,839 |
-0.3 |
2,536 |
41.0 |
2,437 |
29.5 |
1,166 |
– |
25.82 |
15.00 |
2022/12 |
123,324 |
6.4 |
4,582 |
79.0 |
4,177 |
71.4 |
5,294 |
353.9 |
116.99 |
37.00 |
2023/12(Prev. CE) |
130,000 |
5.4 |
6,500 |
41.8 |
6,500 |
55.6 |
3,700 |
-30.1 |
81.70 |
25.00 |
2023/12(New CE) |
130,000 |
5.4 |
7,500 |
63.7 |
7,500 |
79.5 |
4,800 |
-9.3 |
105.84 |
32.00 |
2022/12 2Q |
63,756 |
3.4 |
4,371 |
47.0 |
4,416 |
56.0 |
3,676 |
60.5 |
81.27 |
– |
2023/12 2Q |
68,190 |
7.0 |
7,002 |
60.2 |
7,095 |
60.7 |
4,707 |
28.1 |
103.90 |
– |
Sales/operating profit (Quarterly)
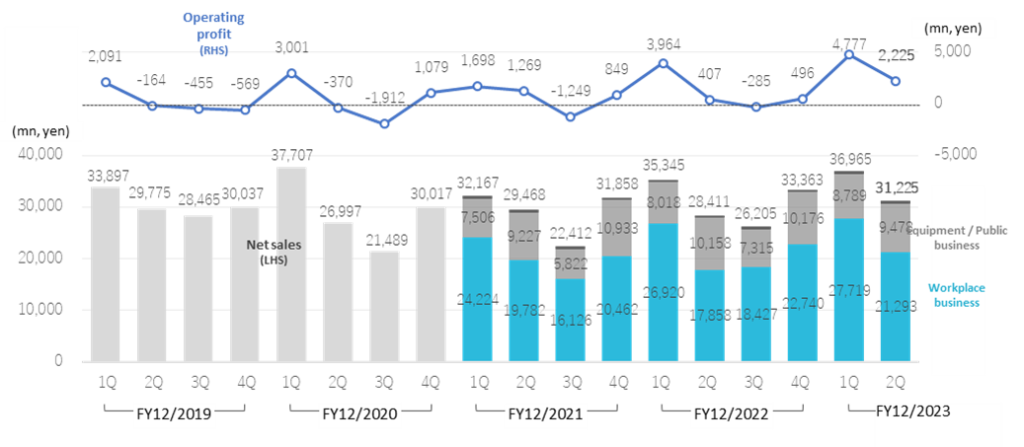
Note: Figures for IT/sharing projects are not shown in the figure as they are small.
Source: Omega Investment from company materials
◇ Results for 2Q FY12/2023: 7% increase in sales, record highs in both sales and operating profit
The company’s 2Q results for FY12/2023 (cumulative total) show sales of 68,190 million yen (+7.0% YoY), operating profit of 7,002 million yen (+60.2%) and net profit attributable to owner of parent 4,707 million yen (+28.1%). Both sales and operating profit reached record highs on a 1H basis.
In 2Q, the COGS ratio improved by 1.6 percentage points to 60.4% from 62.0% QoQ. The SGAE ratio fell by 1.8 percentage points from 31.2% to 29.4% QoQ, resulting in an operating margin of 10.3%, an improvement of 3.4 percentage points YoY.
See the chart below for the factors behind the change in operating profit. The increase in profits due to higher sales (1.6 billion), improved gross margins thanks to restructuring projects (1.1 billion ), and lower logistics costs (0.3 billion) absorbed the increase in strategic expenditure (0.2 billion) , resulting in a significant profit increase.
Looking at 2Q alone, sales increased by 9.9% to 31,225 million yen and operating profit by 446.7% to 2,225 million yen. Sales and profit reached record highs for 2Q. The company’s results are biased towards the 1Q, and 2Q earnings usually fall significantly over those of 1Q. However, this time the company has maintained a high operating profit margin in 2Q, delivering 7.1% which compares to 12.9% in 1Q (operating profit margin in 2Q FY12/2022 alone was 1.4%).
Factor analysis of changes in operating profit
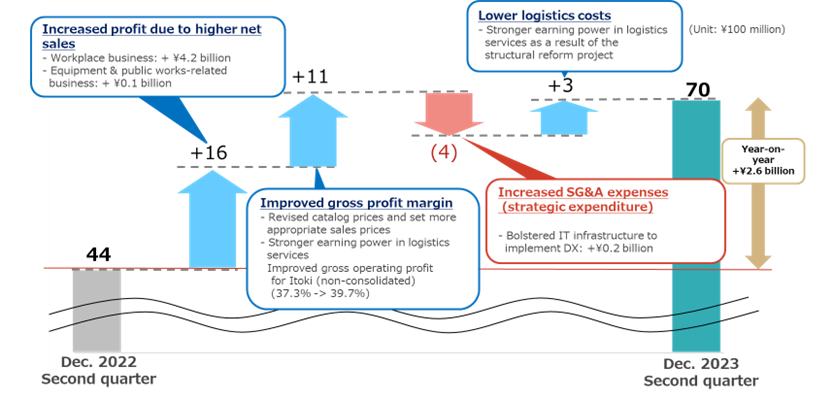
Source: The company materials for the 2Q results for FY12/2023 (published on 7 August, 2023)
Workplace business (quarterly)
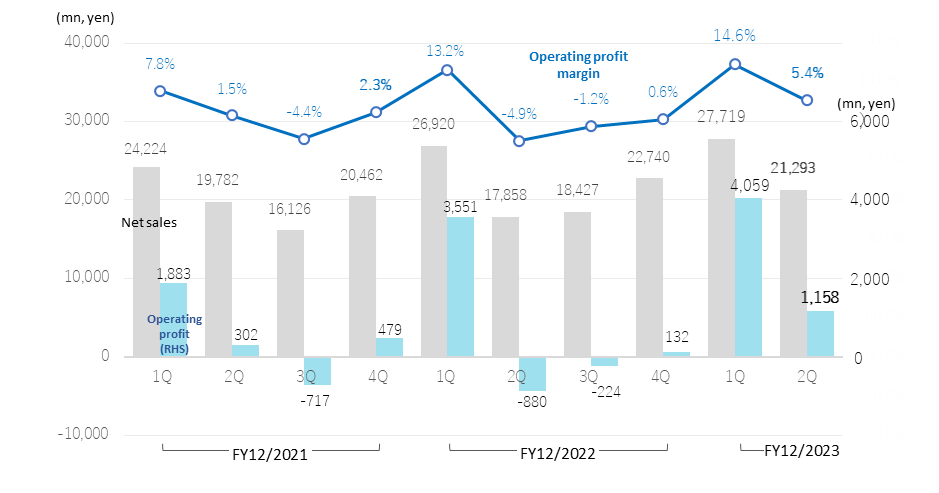
Source: Omega Investment from company materials
◇ Segment trends
1)Workplace business: Sales: 49,012 million yen, +9.5% YoY; operating profit: 5,217 million, +95.3%.
Renewal projects increased in line with new hybrid ways of working after the onset of COVID-19 .(52.7% of sales; 42.8% for new construction and relocation projects). With labour shortages becoming a serious problem, there is a persistent need for office environments that can improve the quality of work to retain talented people. Sales of office furniture were also strong, mainly due to office relocations. On the other hand, the rise in raw material prices was absorbed by various cost-cutting efforts and price revisions commensurate with the increased customer value of the product offerings. Profit margins improved significantly (from 6.0% in 2Q FY12/2022 to 10.6% in 2Q FY12/2023), resulting in a significant profit increase.
In 2Q alone, sales were 21,293 million yen (+19.2%), operating profit was 1,158 million yen (vs. a loss of 880 million yen in 2Q FY12/2022), and the operating profit margin was 5.4%, showing a marked improvement in profit thanks to the top-line sales growth.
Equipment / Public business (quarterly)
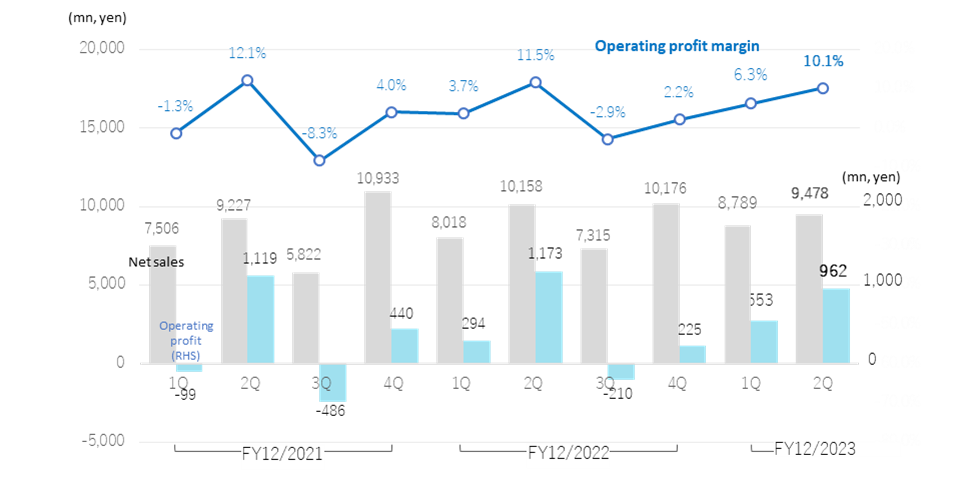
Source: Omega Investment from company materials
2) Equipment / Public business: Sales: 18,267 million yen, +0.5%; operating profit: 1,515 million yen, +3.3%.
Demand for equipment for public facilities, such as display cases for museums and art galleries and digital signage, remained strong. However, sales were largely flat in the absence of last year’s large orders for science parks and other large projects of research facility equipment. Profis increased thanks to top-line sales growth and improved profit margin due to enhanced customer value.
On a non-consolidated basis, 2Q sales were 9,478 million yen (-6.7%), and operating profit was 962 million yen (-18.0%). The declines are due to the absence of last year’s large projects mentioned above, but the level of sales and profit remained high. The operating profit margin registered 10.1%, 1.4 percentage points lower YoY.
◇ Full-year forecasts for FY12/2023: Sales forecast unchanged, but profit estimates revised upwards. The dividend forecast was also raised.
The company revised its full-year forecasts in conjunction with announcing the 2Q results. Sales estimate was unchanged at 130 billion yen, but operating profit forecast was raised from 6.5 billion yen to 7.5 billion yen (63.7% YoY), recurring profit from 6.5 billion yen to 7.5 billion yen (79.5% YoY) and net profit attributable to owner of parent company from 3.7 billion yen to 7.5 billion yen (-9.3%) (The decrease in net profit is due to the absence of an extraordinary profit on the sale of land recorded in FY12/2022).
The dividend forecast has been revised up from 25 yen a share to 32 (previous year: 37 yen, including a special dividend of 20 yen). The dividend payout ratio is maintained at 30%.
As of the end of 2Q, progress ratios against the revised full-year forecasts are 52% for net sales, 93% for operating profit and 98% for net profit attributable to owner of parent. Customer enquiries for Workplace business remains strong. In addition, in the Office Equipment / Public business, projects for logistics facilities are biased towards the second half of the financial year, and demand for equipment for public facilities, such as display cases for museums and art galleries and digital signage, will likely increase. Such that, the company is expected to achieve its full-year forecasts comfortably. Given the current situation, further upward revisions look likely.
◇Topics
◆Integrated Report 2023 published
On 29 June, the company published Integrated Report 2023. The report comprehensively describes the corporate value of the group and its medium- and long-term goals from both financial and non-financial perspectives. It describes the DNA inherited since the company’s founding as ‘Tech X Design’ and reports on the achievements towards the final year of the medium-term management plan ‘RISE ITOKI 2023’ from various perspectives.
https://www.itoki.jp/ir/assets/accounts_anual_2023_00.pdf?v2023
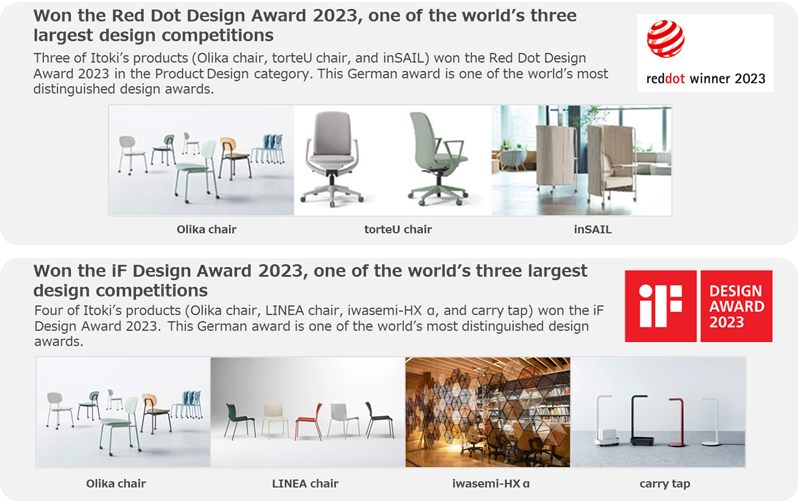
◆Winner of international design awards
The company’s products are highly regarded for their design quality, and in FY2023, a number of its products won global design awards.
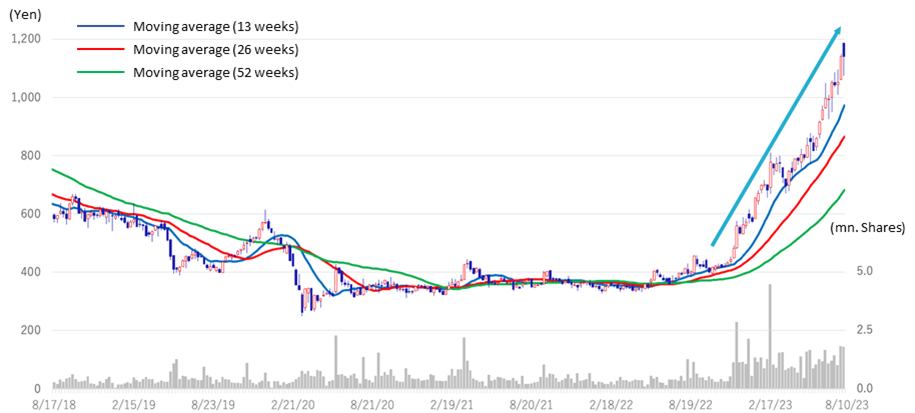
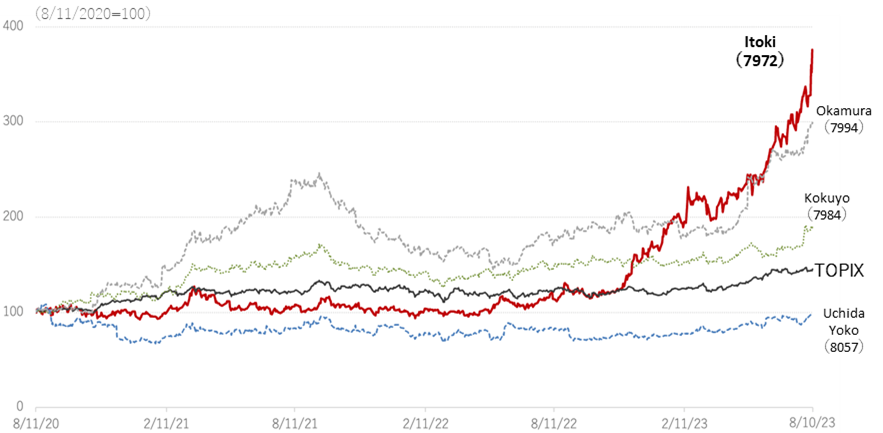
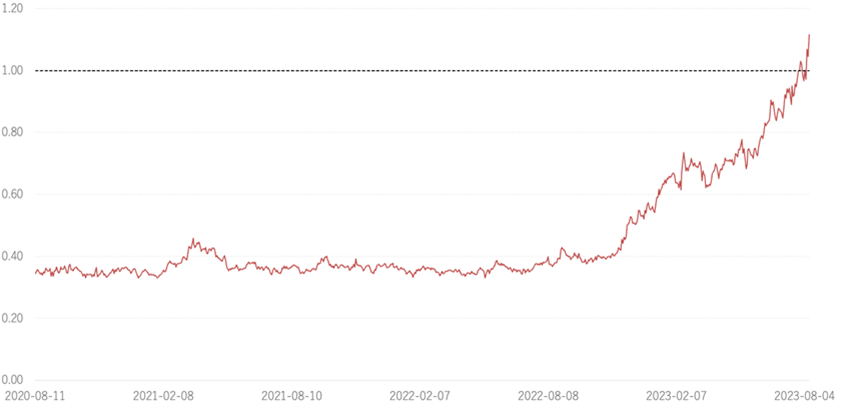
◇ Stock price:Went up 3.3 times over one year on the back of strong earnings, with PBR recovering to 1x.
The company’s share price has risen 123.6% since the beginning of the year. The performance of the company’s share price stands out amongst its peers, whose share prices rose between 21.7% and 52.6% over the same period, while TOPIX rose 21.7%. Over the past year, the company’s share price has increased 3.3 times, and PBR, which had been a concern, has recovered to 1x. This results from investors rating the improvement in profitability favourably, which reflects the strong demand for the Workplace business, including renewal projects to accommodate new ways of working, and the company’s focus on increasing the customer value of its offerings.
As we have seen, upward earnings revision looks likely, and the share price is expected to rise further.
7972:5-year stock price move
Four office furniture companies, TOPIX (past three years)
7972: Itoki PBR (LTM, past three years)
Financial data (quarterly basis)
| FY (¥mn) | 2020/12 | 2021/12 | 2022/12 | 2023/12 | ||||||||||
| 1Q | 2Q | 3Q | 4Q | 1Q | 2Q | 3Q | 4Q | 1Q | 2Q | 3Q | 4Q | 1Q | 2Q | |
| [Statements of income] | ||||||||||||||
| Net sales | 37,707 | 26,997 | 21,489 | 30,017 | 32,167 | 29,468 | 22,412 | 31,858 | 35,345 | 28,411 | 26,205 | 33,363 | 36,965 | 31,225 |
| Year-on-year basis (%) | 11.2 | -9.3 | -24.5 | -0.1 | -14.7 | 9.2 | 4.3 | 6.1 | 9.9 | -3.6 | 16.9 | 4.7 | 4.6 | 9.9 |
| Cost of sales | 23,710 | 17,765 | 13,811 | 19,036 | 20,101 | 18,729 | 14,443 | 20,872 | 21,483 | 18,030 | 16,678 | 21,384 | 22,216 | 18,954 |
| Gross profit | 13,997 | 9,232 | 7,678 | 10,981 | 12,020 | 10,722 | 7,953 | 10,999 | 13,862 | 10,381 | 9,527 | 11,979 | 14,748 | 12,271 |
| SG&A expenses | 10,996 | 9,602 | 9,590 | 9,901 | 10,352 | 9,453 | 9,203 | 10,150 | 9,898 | 9,973 | 9,812 | 11,484 | 9,970 | 10,047 |
| Operating income | 3,001 | -370 | -1,912 | 1,079 | 1,698 | 1,275 | -1,242 | 829 | 3,964 | 407 | -285 | 496 | 4,777 | 2,225 |
| Year-on-year basis (%) | 43.5 | – | – | – | -43.4 | – | – | -23.2 | 133.4 | -68.7 | – | -40.2 | 20.5 | 446.7 |
| Operating profit ratio (%) | 8.0 | -1.4 | -8.9 | 3.6 | 5.3 | 4.3 | -5.5 | 2.6 | 11.2 | 1.4 | -1.1 | 1.5 | 12.9 | 7.1 |
| Non-operating income | 154 | 162 | 251 | 237 | 240 | 161 | 171 | 122 | 125 | 164 | 171 | 96 | 125 | 114 |
| Non-operating expenses | 273 | 168 | 107 | 172 | 250 | 257 | 101 | 185 | 115 | 130 | 177 | 539 | 79 | 68 |
| Ordinary income | 2,882 | -376 | -1,768 | 1,143 | 1,657 | 1,173 | -1,179 | 786 | 3,974 | 442 | -291 | 52 | 4,824 | 2,271 |
| Extraordinary income | 0 | 6 | 125 | 980 | 1,255 | 78 | 133 | 88 | 786 | 139 | 118 | 6,762 | 1 | 15 |
| Extraordinary expenses | 116 | 42 | 55 | 1,503 | 20 | 456 | 518 | 1,474 | 44 | 64 | 38 | 3,465 | 21 | 10 |
| Income before income taxes | 2,766 | -412 | -1,697 | 620 | 2,893 | 795 | -1,565 | -600 | 4,716 | 516 | -211 | 3,351 | 4,804 | 2,275 |
| Total income taxes | 1,039 | 134 | -195 | 654 | 1,028 | 490 | -132 | -796 | 1,381 | 246 | -21 | 1,585 | 1,506 | 864 |
| Net income | 1,760 | -557 | -1,491 | 53 | 1,942 | 348 | -1,440 | 316 | 3,388 | 288 | -159 | 1,777 | 3,296 | 1,411 |
| Year-on-year basis (%) | 43.6 | – | – | – | 10. | – | – | 496.2 | 74.4 | -17.2 | – | 462.3 | -2.7 | 389.9 |
| Net income ratio (%) | 4.7 | -2.1 | -6.9 | 0.2 | 6.0 | 1.2 | -6.4 | 1.0 | 9.6 | 1.0 | -0.6 | 5.3 | 8.9 | 4.5 |
| [Balance Sheets] | ||||||||||||||
| Current assets | 69,811 | 60,382 | 52,463 | 57,183 | 65,543 | 62,170 | 55,249 | 57,753 | 69,458 | 64,096 | 59,873 | 71,027 | 72,230 | 68,755 |
| Cash and deposits | 18,186 | 21,312 | 18,956 | 18,246 | 19,503 | 22,112 | 18,213 | 17,351 | 19,196 | 20,073 | 17,138 | 26,876 | 20,898 | 24,688 |
| Notes and accounts receivable - trade |
37,611 | 27,230 | 20,298 | 26,599 | 32,061 | 26,596 | 21,385 | 26,783 | – | – | – | – | – | – |
| Notes and accounts receivable - trade, and contract assets |
– | – | – | – | – | – | – | – | 35,205 | 28,234 | 24,111 | 29,316 | 34,519 | 28,377 |
| Non-current assets | 49,872 | 49,933 | 50,410 | 47,912 | 46,925 | 46,369 | 46,046 | 46,144 | 46,647 | 47,395 | 48,126 | 44,260 | 43,611 | 42,918 |
| Property, plant and equipment | 27,612 | 27,350 | 27,329 | 26,206 | 25,184 | 24,779 | 24,887 | 24,417 | 25,105 | 26,042 | 26,932 | 24,978 | 24,689 | 24,952 |
| Intangible assets | 5,113 | 5,623 | 5,853 | 5,590 | 5,504 | 5,419 | 4,885 | 4,114 | 4,128 | 4,168 | 4,145 | 1,819 | 1,837 | 1,884 |
| Goodwill | 2,391 | 2,207 | 2,189 | 2,093 | 2,018 | 2,016 | 1,407 | 1,317 | 1,214 | 1,222 | 1,200 | 517 | 446 | 391 |
| Investments and other assets | 17,146 | 16,959 | 17,227 | 16,116 | 16,236 | 16,170 | 16,273 | 17,612 | 17,413 | 17,184 | 17,048 | 17,462 | 17,084 | 16,080 |
| Total assets | 120,352 | 110,940 | 103,453 | 105,096 | 112,469 | 108,540 | 101,295 | 103,898 | 116,105 | 111,492 | 108,000 | 115,288 | 115,841 | 111,693 |
| Current liabilities | 55,449 | 46,097 | 40,198 | 43,646 | 49,245 | 45,266 | 40,307 | 42,544 | 51,837 | 47,138 | 43,655 | 49,099 | 47,854 | 42,547 |
| Short-term borrowings | 15,616 | 13,289 | 14,239 | 13,234 | 13,458 | 12,061 | 12,409 | 12,500 | 15,014 | 11,976 | 11,738 | 11,239 | 10,874 | 10,299 |
| Non-current liabilities | 18,327 | 18,220 | 18,079 | 17,259 | 17,506 | 17,088 | 16,257 | 16,277 | 16,334 | 16,020 | 16,178 | 16,278 | 16,238 | 15,727 |
| Long-term borrowings | 9,475 | 9,574 | 9,453 | 8,508 | 8,711 | 8,193 | 7,435 | 7,591 | 7,427 | 7,174 | 7,266 | 7,530 | 7,453 | 7,062 |
| Total liabilities | 73,777 | 64,318 | 58,277 | 60,906 | 66,751 | 62,354 | 56,565 | 58,822 | 68,172 | 63,158 | 59,833 | 65,377 | 64,092 | 58,275 |
| Total net assets | 46,575 | 46,621 | 45,175 | 44,189 | 45,717 | 46,186 | 44,730 | 45,076 | 47,933 | 48,333 | 48,166 | 49,910 | 51,748 | 53,418 |
| Shareholders’ equity | 45,479 | 45,390 | 43,786 | 43,691 | 45,047 | 45,419 | 43,979 | 44,301 | 47,249 | 47,567 | 47,408 | 49,185 | 50,806 | 52,267 |
| Share capital | 5,294 | 5,294 | 5,294 | 5,294 | 5,294 | 5,294 | 5,294 | 5,294 | 5,294 | 5,294 | 5,294 | 5,294 | 5,294 | 5,294 |
| Capital surplus | 9,201 | 9,642 | 9,641 | 9,628 | 9,628 | 9,632 | 9,632 | 9,638 | 9,638 | 9,638 | 9,638 | 9,638 | 9,638 | 9,665 |
| Retained earnings | 31,030 | 30,461 | 28,884 | 28,950 | 30,306 | 30,654 | 29,213 | 29,530 | 32,477 | 32,769 | 32,610 | 34,387 | 36,008 | 37,419 |
| Treasury shares | -46 | -6 | -33 | -182 | -182 | -161 | -161 | -161 | -161 | -134 | -134 | -134 | -314 | -111 |
| Share acquisition rights | 45 | 45 | 45 | 45 | 45 | 45 | 45 | 45 | 45 | 45 | 45 | 45 | ||
| Total liabilities and net assets | 120,352 | 110,940 | 103,453 | 105,096 | 112,469 | 108,540 | 101,295 | 103,898 | 116,105 | 111,492 | 108,000 | 115,288 | 115,841 | 111,693 |
| [Statements of cash flows] | ||||||||||||||
| Cash flow from operating activities | 5,404 | -843 | 4,577 | -1,803 | 4,581 | 1,223 | 4,078 | |||||||
| Cash flow from investing activities | -1,442 | 290 | 503 | -1,673 | -1,410 | 6,333 | -3,265 | |||||||
| Cash flow from financing activities | 293 | -2,560 | -1,418 | -1,240 | -661 | -765 | -3,266 | |||||||
| Free cash flow | 3,962 | -553 | 5,080 | -3,476 | 3,171 | 7,556 | 813 | |||||||
| Net increase in cash and cash equiv. | 4,240 | -3,037 | 3,787 | -4,687 | 2,630 | 6,911 | -2,466 | |||||||
| Cash and cash equiv. at beginning of period |
15,494 | 19,735 | 16,697 | 20,485 | 15,797 | 18,509 | 25,420 | |||||||
| Cash and cash equiv. at end of period | 19,735 | 16,697 | 20,485 | 15,797 | 18,509 | 25,420 | 22,953 | |||||||
Source: Omega Investment from company materials
Financial data (full-year basis)
| FY (¥mn) | FY2012/12 | FY2013/12 | FY2014/12 | FY2015/12 | FY2016/12 | FY2017/12 | FY2018/12 | FY2019/12 | FY2020/12 | FY2021/12 | FY2022/12 |
| [Statements of income] | |||||||||||
| Net sales | 105,508 | 103,461 | 102,993 | 106,516 | 101,684 | 108,684 | 118,700 | 122,174 | 116,210 | 115,839 | 123,324 |
| Year-on-year basis (%) | 14.6 | -1.9 | -0.5 | 3.4 | -4.5 | 6.9 | 9.2 | 2.9 | -4.9 | -0.3 | 6.4 |
| Cost of sales | 70,027 | 67,118 | 66,797 | 68,374 | 65,021 | 69,966 | 77,436 | 80,495 | 74,322 | 74,145 | 77,575 |
| Gross profit | 35,481 | 36,343 | 36,196 | 38,142 | 36,663 | 38,718 | 41,264 | 41,679 | 41,888 | 41,694 | 45,749 |
| Gross profit ratio (%) | 33.6 | 35.1 | 35.1 | 35.8 | 36.1 | 35.6 | 34.8 | 34.1 | 36.0 | 36.0 | 37.1 |
| SG&A expenses | 32,040 | 32,203 | 33,723 | 33,836 | 33,862 | 35,761 | 39,339 | 40,776 | 40,089 | 39,158 | 41,167 |
| Operating income | 3,441 | 4,140 | 2,472 | 4,306 | 2,800 | 2,956 | 1,925 | 903 | 1,798 | 2,536 | 4,582 |
| Operating profit ratio (%) | 3.3 | 4.0 | 2.4 | 4.0 | 2.8 | 2.7 | 1.6 | 0.7 | 1.5 | 2.2 | 3.7 |
| Non-operating income | 813 | 813 | 841 | 898 | 771 | 750 | 889 | 677 | 804 | 694 | 556 |
| Non-operating expenses | 518 | 528 | 495 | 605 | 483 | 412 | 448 | 634 | 720 | 793 | 961 |
| Ordinary income | 3,735 | 4,425 | 2,818 | 4,599 | 3,087 | 3,295 | 2,365 | 945 | 1,881 | 2,437 | 4,177 |
| Extraordinary income | 269 | 685 | 615 | 171 | 97 | 228 | 919 | 27 | 1,111 | 1,554 | 7,805 |
| Extraordinary expenses | 352 | 238 | 262 | 524 | 267 | 121 | 204 | 35 | 1,716 | 2,468 | 3,611 |
| Income before income taxes | 3,653 | 4,872 | 3,171 | 4,246 | 2,918 | 3,401 | 3,081 | 938 | 1,277 | 1,523 | 8,372 |
| Total income taxes | 689 | 876 | 813 | -385 | 1,068 | 959 | 1,339 | 1,517 | 1,632 | 590 | 3,191 |
| Net income | 2,702 | 3,910 | 2,160 | 4,530 | 1,907 | 2,402 | 1,722 | -550 | -235 | 1,166 | 5,294 |
| Net income ratio (%) | 2.6 | 3.8 | 2.1 | 4.3 | 1.9 | 2.2 | 1.5 | -0.5 | -0.2 | 1.0 | 4.3 |
| [Balance Sheets] | |||||||||||
| Current assets | 49,294 | 52,925 | 55,714 | 56,342 | 52,410 | 58,147 | 62,143 | 58,109 | 57,183 | 57,753 | 71,027 |
| Cash and deposits | 17,441 | 19,553 | 21,211 | 21,456 | 19,839 | 19,977 | 16,229 | 17,030 | 18,246 | 17,351 | 26,876 |
| Notes and accounts receivable - trade |
24,935 | 26,243 | 25,965 | 26,138 | 23,241 | 26,869 | 33,160 | 28,244 | 26,599 | 26,783 | |
| Notes and accounts receivable - trade, and contract assets |
29,316 | ||||||||||
| Non-current assets | 39,961 | 42,335 | 41,007 | 41,832 | 43,271 | 44,073 | 46,559 | 49,955 | 47,912 | 46,144 | 44,260 |
| Property, plant and equipment | 27,928 | 28,193 | 27,041 | 26,395 | 25,322 | 24,426 | 26,362 | 27,781 | 26,206 | 24,417 | 24,978 |
| Intangible assets | 705 | 1,230 | 1,109 | 1,313 | 1,142 | 3,651 | 4,437 | 4,945 | 5,590 | 4,114 | 1,819 |
| Goodwill | 6 | 34 | 26 | 240 | 208 | 2,793 | 3,005 | 2,413 | 2,093 | 1,317 | 517 |
| Investments and other assets | 11,327 | 12,911 | 12,857 | 14,123 | 16,806 | 15,995 | 15,760 | 17,229 | 16,116 | 17,612 | 17,462 |
| Total assets | 89,256 | 95,261 | 96,721 | 98,175 | 95,681 | 102,221 | 108,703 | 108,778 | 105,096 | 103,898 | 115,288 |
| Current liabilities | 36,455 | 35,359 | 36,677 | 36,106 | 35,390 | 39,683 | 45,133 | 47,559 | 43,646 | 42,544 | 49,099 |
| Short-term borrowings | 11,222 | 11,473 | 11,087 | 10,940 | 11,760 | 12,564 | 11,721 | 15,533 | 13,234 | 12,500 | 11,239 |
| Non-current liabilities | 14,560 | 16,874 | 16,854 | 14,756 | 14,888 | 15,211 | 16,076 | 15,385 | 17,259 | 16,277 | 16,278 |
| Long-term borrowings | 4,122 | 5,124 | 5,089 | 5,171 | 5,296 | 5,328 | 5,113 | 6,633 | 8,508 | 7,591 | 7,530 |
| Total liabilities | 51,016 | 52,234 | 53,532 | 50,863 | 50,278 | 54,894 | 61,210 | 62,944 | 60,906 | 58,822 | 65,377 |
| Total net assets | 38,240 | 43,026 | 43,189 | 47,311 | 45,402 | 47,326 | 47,492 | 45,834 | 44,189 | 45,076 | 49,910 |
| Shareholders’ equity | 35,960 | 41,079 | 41,632 | 45,677 | 44,949 | 46,863 | 46,854 | 45,370 | 43,812 | 44,931 | 49,871 |
| Share capital | 5,277 | 5,277 | 5,277 | 5,277 | 5,277 | 5,277 | 5,277 | 5,294 | 5,294 | 5,294 | 5,294 |
| Capital surplus | 13,020 | 13,061 | 13,061 | 13,222 | 13,140 | 12,404 | 9,786 | 9,201 | 9,628 | 9,638 | 9,638 |
| Retained earnings | 18,520 | 22,073 | 23,556 | 29,223 | 30,504 | 32,315 | 31,104 | 29,862 | 28,950 | 29,530 | 34,387 |
| Treasury shares | -1,178 | -833 | -834 | -3,000 | -4,700 | -4,701 | 0 | -46 | -182 | -161 | -134 |
| Share acquisition rights | 45 | 45 | 45 | ||||||||
| Total liabilities and net assets | 89,256 | 95,261 | 96,721 | 98,175 | 95,681 | 102,221 | 108,703 | 108,778 | 105,096 | 103,898 | 115,288 |
| [Statements of cash flows] | |||||||||||
| Cash flow from operating activities | 8,259 | 3,162 | 5,715 | 4,522 | 5,072 | 3,565 | 1,384 | 3,586 | 4,561 | 2,774 | 5,804 |
| Cash flow from investing activities | -14 | -1,978 | -1,742 | -803 | -4,044 | -2,971 | -3,094 | -3,221 | -1,152 | -1,170 | 4,923 |
| Cash flow from financing activities | -1,652 | 51 | -2,179 | -3,807 | -2,571 | -706 | -2,463 | 0 | -2,267 | -2,658 | -1,426 |
| Free cash flow | 8,245 | 1,184 | 3,973 | 3,719 | 1,028 | 594 | -1,710 | 365 | 3,409 | 1,604 | 10,727 |
| Net increase in cash and cash equiv. | 6,601 | 1,944 | 1,814 | 184 | -1,619 | 88 | -4,031 | 952 | 1,203 | -900 | 9,622 |
| Cash and cash equiv. at beginning of period |
9,555 | 16,156 | 18,102 | 19,918 | 20,103 | 18,483 | 18,571 | 14,540 | 15,494 | 16,697 | 15,797 |
| Cash and cash equiv. at end of period | 16,156 | 18,102 | 19,918 | 20,103 | 18,483 | 18,571 | 14,540 | 15,494 | 16,697 | 15,797 | 25,420 |
Source: Omega Investment from company materials