2026-07-27
Home
Japanese

Omega Investment Co., Ltd.
Kidswell Bio (Company note – 1Q update)

| Share price (8/14) | ¥175 | Dividend Yield (24/3 CE) | – % |
| 52weeks high/low | ¥388/173 | ROE(23/3) | -51.4 % |
| Avg Vol (3 month) | 179.8 thou shrs | Operating margin (23/3) | -19.8 % |
| Market Cap | ¥5.6 bn | Beta (5Y Monthly) | 1.06 |
| Enterprise Value | ¥6.8 bn | Shares Outstanding | 32.066 mn shrs |
| PER (24/3 CE) | – X | Listed market | TSE Growth |
| PBR (23/3 act) | 9.83 X |
| Click here for the PDF version of this page |
| PDF Version |
Start of new management structure.
Financing of approx. 3 billion yen for BS business expansion.
◇ Summary
On August 7, Kidswell Bio (hereafter referred to as ‘the company’) announced its 1Q results for FY2023 (see table below), which showed a significant YoY decline in sales as sales of biosimilar (BS) products, including GBS-007, is concentrated in the second half of the year. SG&A expenses, mainly R&D costs, were recorded as planned, resulting in a larger operating loss. However, the company said that it is generally progressing in line with its full-year forecasts set at the beginning of the year.
On June 6, the company also announced changes to its president and board members, with Masaharu Tani stepping down after serving as president since 2017 and Shinya Kurebayashi, who had served as corporate officer and Chief Business Officer, assuming the role of president and representative director following a resolution at the June 29 general meeting of shareholders. The company explained that the change was made at a time when the cell therapy business using Stem cells from Human Exfoliated Deciduous teeth (SHED), on which it has been focusing in recent years, have progressed and are now at the clinical stage. At the same time, organisational changes were made to promote each business further, with Masayuki Kawakami, Board Director and Corporate Officer, appointed as Chief Operating Officer and Chief Development Officer, Yasuyuki Mitani, Corporate Officer, as Chief Scientific Officer, and Munechika Sakabe, Corporate Officer, as Chief Manufacturing Officer. The structure was established to clarify responsibilities and accelerate the growth strategy for the clinical development of SHED, research on SHED, including its application to second-generation and new modalities, and the BS business, respectively.
Furthermore, on July 10, the company announced financing for working capital for the BS business. It will raise approximately 3 billion yen through the issue of stock acquisition rights. The company aims to secure funds to manufacture active pharmaceutical ingredients and formulations and fulfil the sales plan in its medium-term strategic plan. Although investors will bear the burden of dilution, the company plans to build up its top line to obtain manufacturing and marketing approval for its fourth BS product.
◇ Views on share price: Positive expectations for clinical development progress of SHED and the fourth BS product
The company’s share price has been correcting since May 2022, trading below 200 yen for the past few months. Concerns over near-term earnings, plans of significant investments related to SHED, and increased burden on shareholders from equity financing are thought to have contributed to the share price weakness. On the other hand, the fourth BS product is expected to be launched by the end of this year, and some progress has been made with the first-generation SHED entering the clinical preparation stage. The share price will likely respond favourably to more concrete announcements of these developments.
◇ Results for 1Q FY2023: Sales fell sharply due to an off-season in sales
The company’s 1Q results for FY2023 showed sales of 45 million yen, down 92.5% YoY, an operating loss of 455 million yen (vs. a loss of 37 million yen in 1Q FY2022) and a net loss of 470 million yen (vs. a loss of 80 million yen in 1Q FY2022).
| JPY, mn, % | Net sales | YoY % |
Oper. profit |
YoY % |
Ord. profit |
YoY % |
Profit ATOP |
YoY % |
EPS (¥) |
| 2020/3 | 1,077 | – | -1,161 | – | -1,187 | – | -7,316 | – | -264.65 |
| 2021/3 | 996 | -7.5 | -969 | – | -991 | – | -1,001 | – | -34.79 |
| 2022/3 | 1,569 | 62.3 | -651 | – | -968 | – | -535 | – | -17.86 |
| 2023/3* | 2,776 | 76.9 | -550 | – | -624 | – | -657 | – | -20.77 |
| 2024/3 (CE) | 3,500 | 26.1 | -1,500 | – | -1,550 | – | -1,550 | – | -48.34 |
| 2023/3 1Q* | 610 | – | -37 | – | -80 | – | -80 | – | -2.57 |
| 2024/3 1Q | 45 | -92.5 | -455 | – | -470 | – | -470 | – | -14.68 |
* FY2019 – FY2021 on a consolidated basis; FY2022 onwards on a non-consolidated basis.
List of SHED’s development pipeline
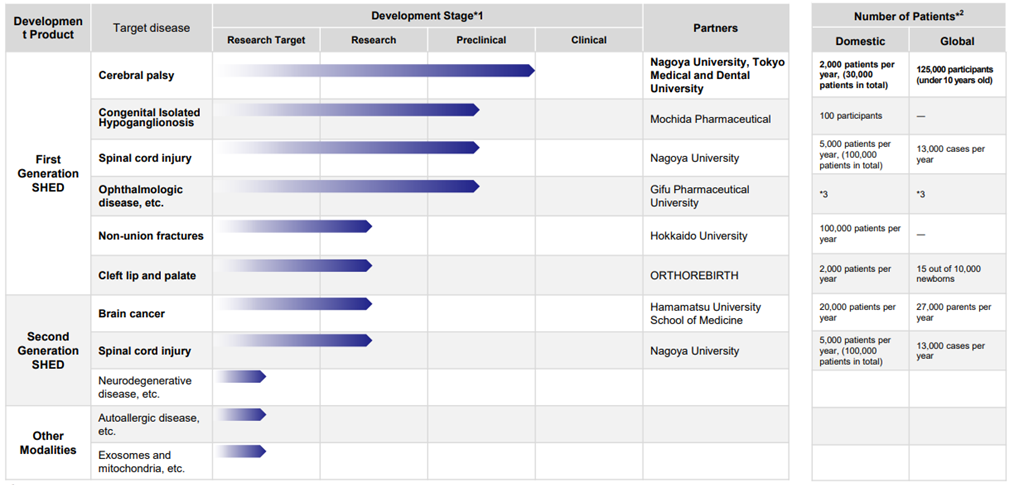
*1 Our development stage definitions: Preclinical indicates pharmaceutical development and preliminary toxicity studies for clinical trials, Research indicates acquired animal POC, Research Target indicates before acquisition of animal POC. *2 Internal research based on Global Data, Global Cancer Observatory. *3 Details not disclosed.
Source: Company materials
Although the company’s BS business, inclusive of GBS-007 (Ranibizumab), the third BS product to be launched in December 2021, is performing well, the contribution to sales of the launched products will be concentrated in the second half of the year due to the timing of shipments. Drug discovery ventures are generally so-called fabless and do not have proprietary manufacturing facilities. They outsource the manufacture of APIs and other products to contract drug manufacturing organisations (CDMOs). The company also procures from overseas CDMOs based on forecasts from partner pharmaceutical companies. Partner pharmaceutical companies also handle sales, and as a result of the timing of the sales discrepancies between the two, sales in 1Q were down significantly. However, the company has stated that these figures are within its forecasts and is on track to achieve its full-year budget.
In terms of profit, SG&A expenses increased by 500 million yen (+40.4%) due to continued SHED-related R&D costs (312 million yen, +196.3% YoY) and expenses incurred with establishing the Tokyo Laboratory. As a result, the company posted an operating loss of 455 million yen (vs. a loss of 37 million yen in 1Q FY2022) and a net loss of 470 million yen (vs. a loss of 80 million yen in 1Q FY2022). The decline in sales has also had a significant impact on profits. Interest paid on bank loans (10 million yen) was recorded as a non-operating expense.
On the balance sheet, cash and deposits fell by 442 million yen to 625 million yen, and accounts receivable fell by 917 million yen to 170 million yen, resulting in current assets of 2,847 million yen (3,697 million yen at the end of the previous fiscal year). As a result, total assets at the end of 1Q FY2023 amounted to 3,044 million yen, a decrease of 850 million yen from the end of FY2022.
◆Cell therapy business (regenerative medicine): Preparations for the start of clinical research are progressing
See the diagram above for the current status of the company’s cell therapy business pipeline.
Collaboration with Nagoya University and other academia is making progress in first-generation SHED. The company has been collaborating with Nagoya University on research into the treatment of cerebral palsy and is the first in the world to confirm that the administration of SHED improves motor impairment in a chronic cerebral palsy model; a clinical study (first-in-human study using SHED) on children with cerebral palsy is expected to start within 2023. Preparations are currently underway for the start of administration. In addition, several other pipelines have progressed to the preclinical stage.
The development status of second-generation SHEDs and the application of SHEDs to new modalities is still in the research and exploratory phase but continues to be an essential issue. Second-generation SHEDs and other products are vital to the company’s future overseas expansion, and the company intends to focus more on them.
◆Biosimilars business: Fourth product expected to be launched in 2023
In November 2012, the company’s partner, Fuji Pharma, received approval to manufacture and market Filgrastim BS (GBS-001), a treatment for neutropenia. In September 2019, the company and the partner Sanwa Kagaku Kenkyusho received approval to manufacture and market Darbepoetin Alphaba BS (GBS-011), a sustained erythropoiesis-stimulating agent. In September 2021, the company also co-developed and obtained manufacturing approval for Ranibizumab BS (GBS-007), the first BS in the ophthalmology field, with Senju Pharmaceutical. The company has built a track record in developing these BSs, and the BS business has significantly contributed to earnings as planned. A fourth product is currently under development, intending to launch in 2023, although details are undisclosed. Development activities are also continuing for the fifth and subsequent products.
BS business line-up
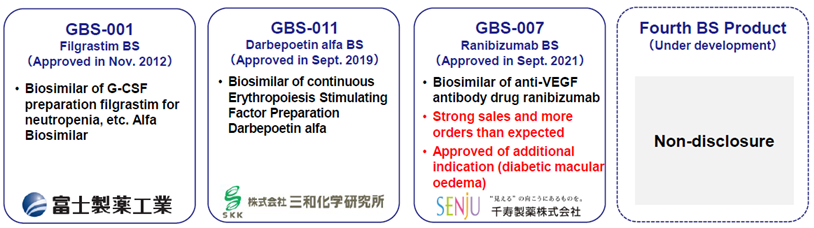
Source: Company materials
◇Forecasts for FY2023 : Unchanged from the initial forecasts
At the time of the announcement of the previous year’s results, the company announced forecasts for FY2023 of 3.5 billion yen in sales, 1.5 billion yen in operating loss and 1.55 billion in net loss, with no changes to these forecasts at the end of 1Q. The company expects the contribution of BS to sales, including the strong sales of ranibizumab BS (GBS-007), to be concentrated in the second half of the year.
◇The new management structure was established to further progress in SHED
On June 6, the company announced changes to its president and board members, with Masaharu Tani stepping down after serving as president since 2017 and Shinya Kurebayashi, who had been a corporate officer and Chief Business Officer, assuming the role of president following a resolution at the June 29 general meeting of shareholders. The company explained that the change in management came at a time when the SHED-based cell therapy business, which has been focusing its efforts in recent years, has made progress and is now at the clinical stage. Mr Kurebayashi joined the company following the acquisition of Advanced Cell Technology and Engineering LTD (ACTE) by the company from the original SHED business, where he was Executive Vice President. He has served as the company’s Corporate Officer and Chief Business Officer since March 2019. He is an ideal choice for the SHED business as it progresses further in the future. Mr Kurebayashi also has a wealth of experience in the financial sector and is willing to take an active role in communicating with investors. In addition to his CEO role, he will serve as Chief Communications Officer (CCO). In line with his intention, the company intends to hold investor meetings actively.
Along with the personnel changes, organisational changes were also made, with Masayuki Kawakami, Board Director and Corporate Officer, appointed as Chief Operating Officer and Chief Development Officer, Yasuyuki Mitani, Corporate Officer, as Chief Scientific Officer, Munechika Sakabe, Corporate Officer, as Chief Manufacturing Officer. The structure was established to clarify responsibilities and accelerate the growth strategy for the clinical development of SHED, research on SHED, including second-generation and new modality applications, and the BS business, respectively. In addition, Yasuo Sakae, Corporate Officer, has been appointed Chief Administration Officer (see diagram on next page).
Shinya Kurebayashi: Board Director, President & CEO, Corporate Officer, Chief Communication Officer
| Date of birth: | December 28, 1976 | |
| Education: | Massachusetts Institute of Technology, MSc, Physics | |
| Biography: | Apr. 2004 | Joined Goldman Sachs Japan |
| Aug. 2009 | Joined Morgan Stanley (Mitsubishi UFJ Morgan Stanley Securities) | |
| Oct. 2014 | Jointed ImPACT of Cabinet Office | |
| Sep. 2015 | Joined Advanced Cell Technology and Engineering LTD (ACTE) as Business Administration Officer | |
| Jun. 2016 | Board Director and Business Administration Officer, ACTE | |
| Aug. 2016 | Board Director and General Manager of Corporate Planning & Business Administration Div., ACTE | |
| Jan. 2018 | Board Director, Executive Vice President, Director of Regenerative Medicine Business Div. and General Manager of Business Div., ACTE | |
| Mar. 2019 | Joined Kidswell Bio Corporation (f/k/a Gene Techno Science Co., Ltd.) as Corporate Officer, Chief Business Officer | |
| Mar. 2021 | Board Director, Japan Regenerative Medicine (JRM) | |
| Jun. 2023 | Board Director, President & CEO, Corporate Officer, Chief Communication Officer | |
New Management Structure
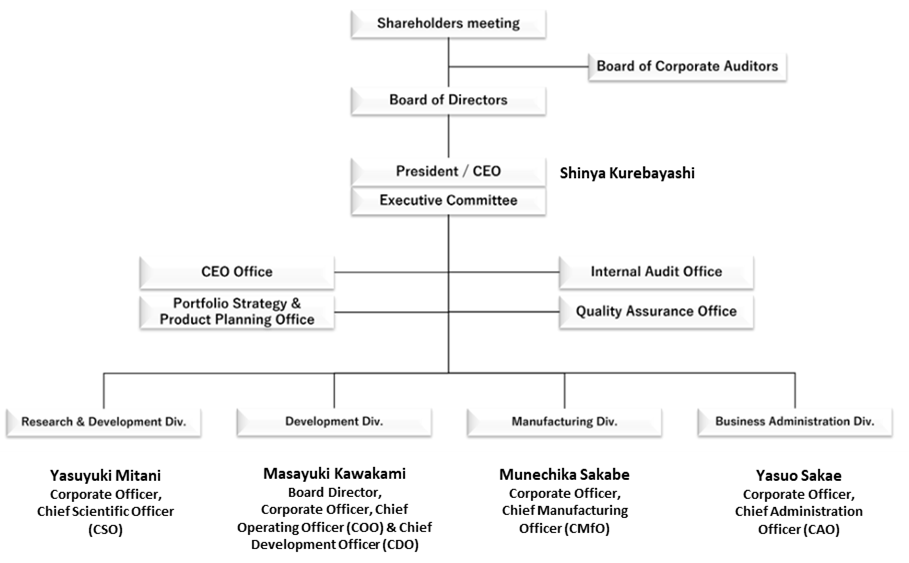
Source: Omega Investment from company materials
◇ Fundraising: Announced equity finance for working capital for BS
On July 10, the company announced that it would issue its 18th equity warrants (with a clause to amend the exercise price) through a third-party allotment to secure working capital for its biosimilars business. As with the previous fundraising, CVI Investments, Inc. will be the allottee of the new share warrants. The number of potential shares is 15,000,000, with 100 shares per warrant. The minimum exercise price is 119 yen, and there is no maximum exercise price. The exercise request period is from July 27, 2023 to January 27, 2026, and the funds raised are expected to be 3,247.8 million yen.
As this is working capital, debt funding was not out of the question, but the company’s long- and short-term borrowings amounted to 1.35 billion yen at the end of June 2023, and the company has chosen to use equity finance this time. Although there are significant concerns about dilution to shareholders, President Kurebayashi explained that the equity financing will come to a halt in the future, partly due to the contribution of BS sales.
On the other hand, in its medium-term strategic plan – KWB2.0 – announced in May 2022, the company announced that it would need to invest more than 10 billion yen in the SHED business in the future, including overseas expansion. In the 1Q results presentation, the company revealed a specific breakdown of the 10 billion yen, with the company expected to bear 3-5 billion yen from basic research to early clinical development and the remainder to be invested by development partners, mainly in post-clinical development, which is expected to be more than 5 billion yen. Investors had been concerned about further dilution of the company to raise 10 billion yen, but the latest announcement has somewhat allayed these fears.
◇ Views on share price: Positive expectations for progress in clinical development of the fourth BS product and SHED
The company’s share price has been below 200 yen for the past few months and is thought to have been hit by concerns over near-term earnings, plans of huge investments related to SHED and the associated increased burden on shareholders from equity financing. In the BS business, drug prices are expected to fall earlier than initially planned, but the company plans to launch its fourth BS product by the end of the year, following GBS-007. The company has also started selecting partners for the fifth and subsequent products. In addition, positive progress has been made in the first-generation SHED, with research into treating cerebral palsy in collaboration with Nagoya University entering the clinical research stage, as previously mentioned. On the other hand, concerns about the 10 billion yen investment in the SHED business have been dispelled by the announcement of the breakdown of the investment. If KWB 2.0 can be steadily implemented under President Kurebayashi’s leadership with the inauguration of the new management team, the share price should positively react.
Medium-term strategic plan – KWB 2.0 – Roadmap
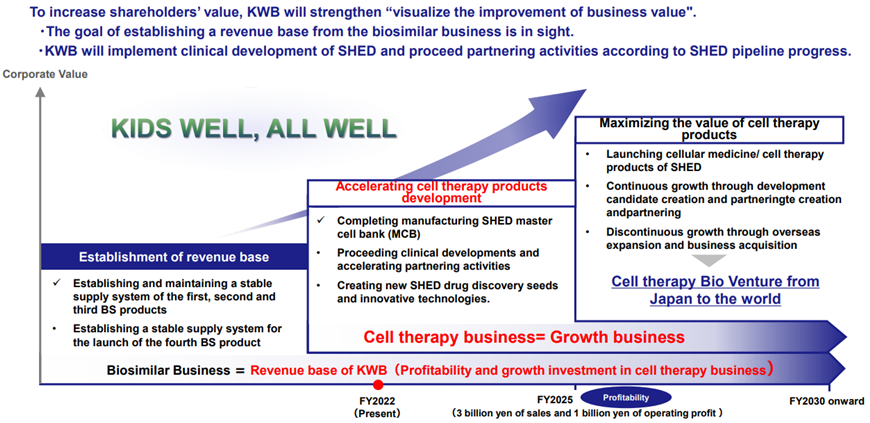
Source: Company materials
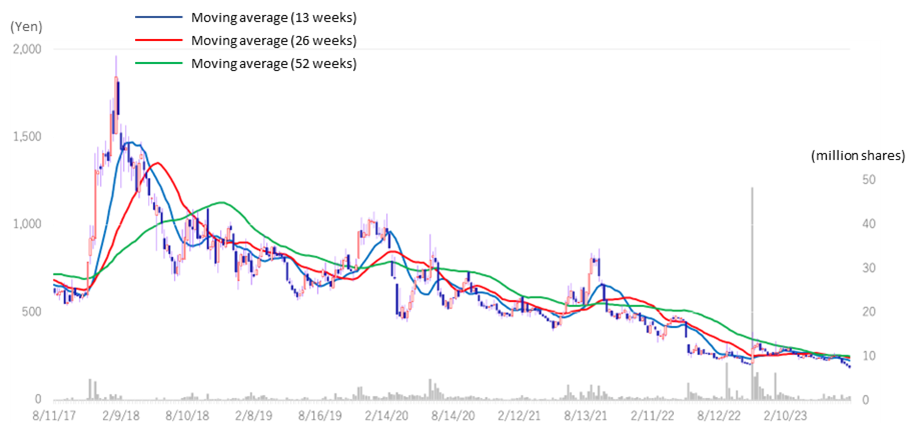
Stock price transition (last 6 years)
Financial data
FY (¥mn) |
2021/3 |
2022/3 |
2023/3 |
2024/3 |
|||||||||
1Q |
2Q |
3Q |
4Q |
1Q |
2Q |
3Q |
4Q |
1Q |
2Q |
3Q |
4Q |
1Q |
|
[Statements of income] |
|||||||||||||
Net sales |
121 |
53 |
547 |
276 |
303 |
438 |
642 |
186 |
610 |
505 |
610 |
1,049 |
45 |
Cost of sales |
5 |
35 |
46 |
34 |
122 |
154 |
183 |
91 |
292 |
128 |
233 |
597 |
0 |
Gross profit |
116 |
19 |
500 |
242 |
182 |
283 |
460 |
94 |
318 |
377 |
377 |
453 |
45 |
SG&A expenses |
354 |
463 |
465 |
565 |
491 |
425 |
442 |
580 |
356 |
328 |
524 |
869 |
500 |
R&D expenses |
138 |
265 |
198 |
363 |
297 |
236 |
237 |
380 |
105 |
146 |
327 |
637 |
312 |
Operating profit (loss) |
-238 |
-445 |
36 |
-323 |
-309 |
-142 |
18 |
-486 |
-37 |
49 |
-146 |
-415 |
-455 |
Non-operating income |
0 |
1 |
1 |
1 |
2 |
0 |
0 |
1 |
0 |
2 |
0 |
1 |
2 |
Non-operating expenses |
7 |
5 |
4 |
8 |
6 |
8 |
15 |
7 |
43 |
13 |
5 |
17 |
17 |
Ordinary profit (loss) |
-244 |
-450 |
33 |
-330 |
-314 |
-150 |
4 |
-493 |
-80 |
39 |
-151 |
-431 |
-470 |
Extraordinary income |
|
|
|
|
|
|
418 |
0 |
– |
– |
– |
– |
– |
Extraordinary expenses |
0 |
1 |
8 |
0 |
|
|
– |
– |
– |
– |
– |
||
Profit (loss) before income taxes |
-244 |
-451 |
26 |
-331 |
-314 |
-148 |
421 |
-493 |
-80 |
39 |
-151 |
-462 |
-470 |
Total income taxes |
1 |
0 |
0 |
1 |
0 |
1 |
52 |
-51 |
0 |
1 |
0 |
0 |
0 |
Net profit (loss) |
-245 |
-451 |
25 |
-330 |
-314 |
-149 |
369 |
-441 |
-80 |
38 |
-152 |
-462 |
–470 |
[Balance Sheets] |
|||||||||||||
Current assets |
3,573 |
3,218 |
3,329 |
3,346 |
2,794 |
3,203 |
3,722 |
3,326 |
4,079 |
4,035 |
3,948 |
3,697 |
2,847 |
Cash equivalents and short-termsecurities |
2,658 |
2,502 |
1,830 |
1,461 |
874 |
974 |
1,253 |
1,187 |
1,532 |
1,874 |
1,499 |
1,067 |
624 |
Non-current assets |
379 |
393 |
340 |
588 |
728 |
656 |
178 |
177 |
225 |
224 |
224 |
197 |
197 |
Tangible assets |
2 |
2 |
2 |
3 |
3 |
2 |
2 |
2 |
1 |
1 |
1 |
1 |
1 |
Investments and other assets |
374 |
389 |
336 |
582 |
722 |
651 |
173 |
173 |
220 |
220 |
220 |
193 |
193 |
Total assets |
3,952 |
3,611 |
3,670 |
3,934 |
3,522 |
3,859 |
3,901 |
3,503 |
4,304 |
4,259 |
4,173 |
3,894 |
3,044 |
Current liabilities |
772 |
858 |
925 |
1,114 |
823 |
1,034 |
1,045 |
1,129 |
1,175 |
651 |
780 |
1,055 |
767 |
Short-term borrowings |
25 |
|
|
|
|
|
|||||||
Long-term debts to be
|
75 |
250 |
300 |
400 |
375 |
375 |
|||||||
Non-current liabilities |
1,384 |
1,287 |
1,231 |
1,209 |
1,051 |
826 |
718 |
656 |
1,485 |
1,908 |
1,704 |
1,605 |
1,508 |
Long-term debt |
1,340 |
1,240 |
1,200 |
1,100 |
900 |
700 |
700 |
625 |
1,450 |
1,875 |
2,275 |
1,575 |
1,475 |
Long-term borrowing |
600 |
600 |
600 |
600 |
600 |
600 |
600 |
525 |
1,350 |
1,275 |
1,175 |
1,075 |
975 |
Convertible bonds |
740 |
640 |
600 |
500 |
300 |
100 |
100 |
100 |
100 |
500 |
500 |
||
Total liabilities |
2,156 |
2,145 |
2,156 |
2,324 |
1,873 |
1,860 |
1,763 |
1,785 |
2,661 |
2,560 |
2,485 |
2,661 |
2,275 |
Total net assets |
1,796 |
1,466 |
1,514 |
1,610 |
1,648 |
1,999 |
2,138 |
1,719 |
1,643 |
1,699 |
1,688 |
1,233 |
768 |
Total shareholders’ equity |
1,796 |
1,466 |
1,514 |
1,610 |
1,648 |
1,999 |
2,138 |
1,719 |
1,444 |
1,500 |
1,490 |
1,037 |
571 |
Capital |
842 |
892 |
912 |
1,032 |
1,150 |
1,420 |
1,420 |
1,421 |
1,424 |
1,433 |
1,504 |
1,509 |
1,511 |
Legal capital reserve |
10,147 |
10,197 |
10,217 |
10,338 |
10,456 |
10,725 |
10,726 |
10,727 |
10,730 |
10,739 |
10,810 |
10,815 |
10,817 |
Retained earnings |
-9,322 |
-9,773 |
-9,748 |
-10,079 |
-10,393 |
-10,542 |
-10,173 |
-10,614 |
-10,710 |
-10,672 |
-1,0824 |
-11,287 |
-11,757 |
Stock acquisition right |
70 |
82 |
101 |
116 |
134 |
145 |
165 |
185 |
199 |
199 |
197 |
195 |
197 |
Total liabilities and net assets |
3,952 |
3,611 |
3,670 |
3,934 |
3,522 |
3,859 |
3,901 |
3,503 |
4,304 |
4,259 |
4,173 |
3.894 |
3,044 |
[Statements of cash flows] |
|||||||||||||
Cash flow from operating activities |
-104 |
-1,267 |
-857 |
-1,169 |
-709 |
-1,421 |
|||||||
Loss before income taxes |
-695 |
-999 |
-462 |
-533 |
-42 |
||||||||
Cash flow from investing activities |
-5 |
-22 |
– |
526 |
-23 |
-28 |
|||||||
Expenditure on acquisition ofintangiblefixed assets |
|
-3 |
|
-3 |
|
– |
-1 |
– |
|||||
Purchase of investment securities |
– |
– |
– |
– |
-50 |
-50 |
|||||||
Sales of investment securities |
– |
– |
– |
526 |
– |
– |
|||||||
Cash flow from financing activities |
579 |
718 |
370 |
369 |
1,446 |
1,356 |
|||||||
Income from the issuance ofconvertible bond-type bonds withstock acquisition rights |
970 |
970 |
|||||||||||
Income from issuance of shares byexercising stock acquisition rights |
599 |
599 |
– |
– |
499 |
499 |
|||||||
Income from issuance of stockacquisition rights |
– |
138 |
370 |
369 |
– |
34 |
|||||||
Proceeds from issuance of new shares |
4 |
4 |
– |
– |
– |
1 |
|||||||
Net increase in cash and cash equiv. |
468 |
-571 |
-486 |
-273 |
713 |
-93 |
|||||||
Cash and cash equiv. at beginning of period |
2,032 |
2,032 |
1,461 |
1,462 |
1,160 |
1,160 |
|||||||
Cash and cash equiv. at end of period |
2,501 |
1,461 |
974 |
1,187 |
1,874 |
1,067 |
Note: Consolidated basis until FY2021; non-consolidated basis from 1Q FY2022. For the statement of cash flows, the figures for 2Q are the cumulative figures for the period from 1Q to 2Q, and the figures for 4Q are the cumulative figures for the period from 1Q to 4Q. Therefore, the opening balance is also the balance at the beginning of each quarter.
Source: Omega Investment from company materials
Financial data
2013/3 |
2014/3 |
2015/3 |
2016/3 |
2017/3 |
2018/3 |
2019/3 |
2020/3 |
2021/3 |
2022/3 |
2023/3 |
|
[Statements of income] |
|||||||||||
Net sales |
60 |
301 |
321 |
1,160 |
1,089 |
1,059 |
1,021 |
1,077 |
996 |
1,569 |
2,776 |
Cost of sales |
15 |
141 |
147 |
500 |
397 |
422 |
412 |
653 |
119 |
550 |
1,250 |
Gross profit |
45 |
159 |
174 |
660 |
692 |
637 |
609 |
424 |
876 |
1,018 |
1,525 |
SG&A expenses |
403 |
671 |
998 |
1,480 |
1,876 |
1,550 |
1,414 |
1,585 |
1,846 |
1,937 |
2,076 |
R&D expenses |
206 |
412 |
689 |
1,075 |
1,433 |
1,107 |
945 |
898 |
963 |
1,150 |
1,216 |
Operating loss |
-358 |
-512 |
-824 |
-820 |
-1,184 |
-913 |
-806 |
-1,161 |
-969 |
-919 |
-550 |
Non-operating income |
0 |
0 |
34 |
50 |
35 |
11 |
3 |
1 |
2 |
2 |
3 |
Non-operating expenses |
16 |
5 |
0 |
15 |
27 |
0 |
14 |
27 |
24 |
36 |
77 |
Ordinary loss |
-373 |
-516 |
-790 |
-785 |
-1,176 |
-903 |
-816 |
-1,187 |
-991 |
-952 |
-624 |
Extraordinary income |
|
|
|
|
|
0 |
7 |
5 |
|
418 |
– |
Extraordinary expenses |
|
|
0 |
|
45 |
|
45 |
6,132 |
8 |
31 |
|
Loss before income taxes |
-373 |
-517 |
-790 |
-785 |
-1,222 |
-902 |
-854 |
-7,314 |
-999 |
-533 |
-656 |
Total income taxes |
3 |
2 |
1 |
1 |
2 |
1 |
1 |
2 |
1 |
1 |
1 |
Net loss |
-377 |
-519 |
-792 |
-787 |
-1,224 |
-904 |
-856 |
-7,316 |
-1,001 |
-535 |
-657 |
[Balance Sheets] |
|||||||||||
Current assets |
919 |
1,881 |
1,092 |
1,520 |
3,421 |
2,692 |
2,821 |
3,322 |
3,346 |
3,325 |
3,697 |
Cash and cash equivalents |
887 |
1,610 |
599 |
817 |
2,379 |
1,891 |
2,009 |
2,032 |
1,461 |
1,187 |
1,067 |
Non-current assets |
3 |
4 |
54 |
173 |
284 |
332 |
329 |
269 |
587 |
177 |
197 |
Tangible assets |
1 |
0 |
0 |
2 |
1 |
1 |
1 |
1 |
3 |
1 |
1 |
Investments and other assets |
2 |
3 |
53 |
171 |
282 |
330 |
328 |
267 |
581 |
172 |
193 |
Total assets |
922 |
1,886 |
1,146 |
1,694 |
3,706 |
3,025 |
3,151 |
3,592 |
3,933 |
3,503 |
3,894 |
Current liabilities |
24 |
50 |
92 |
1,279 |
189 |
404 |
400 |
880 |
1,114 |
1,128 |
1,055 |
Short-term borrowings |
|
|
|
810 |
|
|
|
25 |
|
75 |
375 |
Non-current liabilities |
9 |
783 |
783 |
11 |
16 |
16 |
19 |
1,223 |
1,209 |
656 |
1,605 |
Total liabilities |
34 |
833 |
876 |
1,290 |
205 |
421 |
420 |
2,104 |
2,323 |
1,784 |
2,661 |
Total net assets |
888 |
1,052 |
270 |
403 |
3,500 |
2,604 |
2,731 |
1,487 |
1,610 |
1,718 |
1,233 |
Total shareholders’ equity |
888 |
1,031 |
249 |
383 |
3,472 |
2,568 |
2,695 |
1,451 |
1,291 |
1,533 |
1,037 |
Capital stock |
1,239 |
1,571 |
1,576 |
2,037 |
4,194 |
100 |
591 |
611 |
1,032 |
1,421 |
1,509 |
Legal capital reserve |
1,143 |
1,474 |
1,479 |
1,940 |
4,097 |
3,372 |
3,864 |
9,917 |
10,337 |
10,726 |
10,815 |
Retained earnings |
-1,495 |
-2,014 |
-2,806 |
-3,594 |
-4,818 |
-904 |
-1,760 |
-9,077 |
-10,078 |
-10,613 |
-11,287 |
Evaluation/conversion difference |
|
|
|
-0 |
3 |
2 |
1 |
-21 |
202 |
||
Subscription rights to shares |
|
21 |
21 |
21 |
23 |
32 |
34 |
57 |
116 |
184 |
195 |
Total liabilities and net assets |
922 |
1,886 |
1,146 |
1,694 |
3,706 |
3,025 |
3,151 |
3,592 |
3,933 |
3,503 |
3,894 |
[Statements of cash flows] |
|||||||||||
Cash flow from operating activities |
-304 |
-729 |
-970 |
-607 |
-1,759 |
-438 |
-860 |
-1,325 |
-1,267 |
-1,169 |
-1,421 |
Loss before income taxes |
-373 |
-517 |
-790 |
-785 |
-1,222 |
-902 |
-854 |
-7,314 |
-999 |
-533 |
-656 |
Cash flow from investing activities |
-0 |
-1 |
-49 |
-121 |
-149 |
-50 |
-0 |
-137 |
-22 |
526 |
-28 |
Purchase of investment securities |
|
|
-49 |
-116 |
-149 |
|
|
-100 |
|
|
-50 |
Cash flow from financing activities |
907 |
1,454 |
9 |
946 |
3,471 |
|
978 |
1,221 |
718 |
369 |
1,356 |
Proceeds from issuance of common shares |
917 |
234 |
9 |
486 |
3,932 |
|
973 |
40 |
138 |
369 |
34 |
Net increase in cash and cash equiv. |
601 |
722 |
-1,010 |
217 |
1,562 |
-488 |
118 |
-240 |
-571 |
-273 |
-93 |
Cash and cash equiv. at beginning of period |
285 |
887 |
1,610 |
599 |
817 |
2,379 |
1,891 |
2,009 |
2,032 |
1,461 |
1,160 |
Cash and cash equiv. at end of period |
887 |
1,610 |
599 |
817 |
2,379 |
1,891 |
2,009 |
2,032 |
1,461 |
1,187 |
1,067 |
FCF |
-305 |
-732 |
-1,021 |
-729 |
-1,909 |
-488 |
-860 |
-1,462 |
-1,289 |
-643 |
-1,450 |
Note: Consolidated basis until FY2021; non-consolidated basis from FY2022.
Source: Omega Investment from company materials