2026-07-15
Home
Japanese

Omega Investment Co., Ltd.
Cosmo Bio (Company note – 2Q update)

| Share price (9/8) | ¥962 | Dividend Yield (23/12 CE) | 3.17 % |
| 52weeks high/low | ¥1,030/937 | ROE(TTM) | 5.73 % |
| Avg Vol (3 month) | 9,231 thou shrs | Operating margin (TTM) | 7.00 % |
| Market Cap | ¥5.8 bn | Beta (5Y Monthly) | 0.60 |
| Enterprise Value | ¥2.3 bn | Shares Outstanding | 6.048 mn shrs |
| PER (23/12 CE) | 12.45 X | Listed market | TSE Standard |
| PBR (22/12 act) | 0.66 X |
| Click here for the PDF version of this page |
| PDF Version |
Decrease in sales and profits, but within the 1H forecasts.
Expect progress in the second half of the year, in response to the yen depreciation by raising selling prices.
◇ Summary of 2Q results for FY12/2023: Largely in line with expectations.
Cosmo Bio (hereafter referred to as ‘the company’) reported sales of 4.82 billion yen (-5.6% YoY), operating profit of 450 million yen (-26.7%) and quarterly profit attributable to owner of parent of 360 million yen (-11.4%) in 2Q FY2023. Initial forecasts were 5.2 billion yen, 440 million yen and 330 million yen, respectively. Though sales undercut the forecast, profits exceeded the estimates.
As an import trading company, the company has been significantly affected by the yen’s depreciation since the middle of last year, and cost increases due to inflation have also weighed on profits. On the other hand, price increases on some products are more accepted, offsetting some cost increase factors.
The share price has fallen below 1,000 yen since early in the year. From a macroeconomic perspective, the yen is expected to remain weak for some time and customer purchases of reagents are sluggish, so the operating environment in the near term cannot be viewed optimistically. However, sales activities have returned to pre-pandemic levels following the downgrading of COVID-19 to category 5, and sales price lifts in response to rising procurement costs are gradually becoming more widespread. We would expect the share price to recover as earnings progress. With the shares trading below 1x book, we would like to see how the management will move going forward.
◇ Results for 2Q FY12/2023
The 2Q results for FY12/2023 show sales of 4,827 million yen (-5.6% YoY), operating profit of 458 million (-26.7% YoY) and quarterly profit attributable to owner of parent of 361 million yen (-11.4% YoY).
As per sales, the decrease is attributable to the YoY comparison to the high sales in the same period of the previous year and the sluggish growth of recent reagent purchases by universities/research institutions. Although research budgets for life sciences are increasing, the budget has been diverted to conference activities as research activities for COVID-19 increased. Moreover, a sharp rise in utility costs weighed on the volume of reagent purchases. Declining sales of contract services and consumables other than reagent sales were also a significant factor in the latest decline in sales.
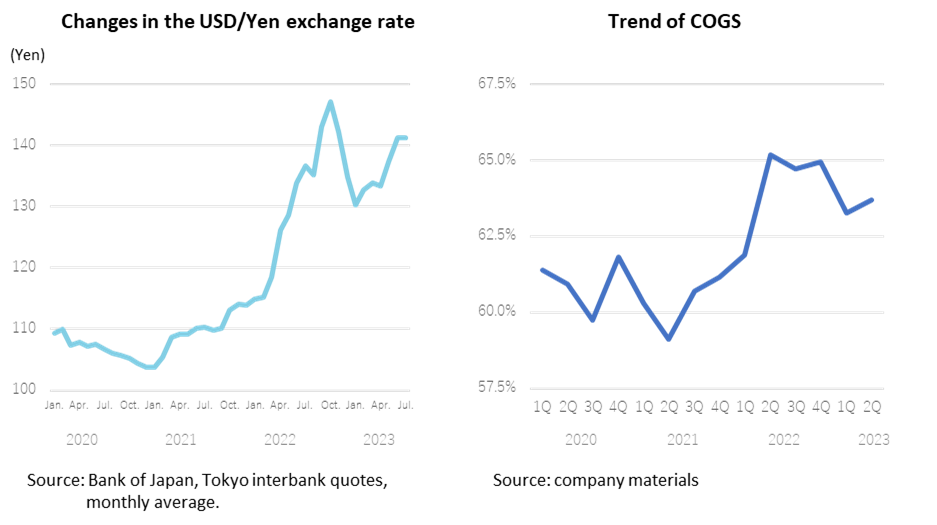
An analysis of the YoY change in 2Q operating profit shows that of the YoY decrease of 168 million yen, 177 million yen was due to foreign exchange effects, primarily due to the yen’s depreciation since the middle of last year. A look at the company’s purchases by currency shows that the US dollar accounts for just under 60% of purchases and the EUR for just under 10%, with only around 1/3 settled in Japanese yen, so exchange rates directly impact the company’s COGS ratio. The exchange rate in 2Q last year was 119 yen to the US dollar, a depreciation of 16 yen compared to 135 yen in 2Q this year. Although the company has mitigated the risk of foreign exchange fluctuations to some extent by forward exchange contracts, the impact is significant.
| JPY, mn, % | Net sales | YoY % |
Oper. profit |
YoY % |
Ord. profit |
YoY % |
Profit ATOP |
YoY % |
EPS (¥) |
DPS (¥) |
| 2019/12 | 7,590 | 4.5 | 405 | 23.5 | 470 | 16.5 | 237 | -8.6 | 40.14 | 14.00 |
| 2020/12 | 8,092 | 6.6 | 752 | 85.6 | 817 | 73.7 | 674 | 183.2 | 113.70 | 34.00 |
| 2021/12 | 9,231 | 14.1 | 1,048 | 39.4 | 1,099 | 34.5 | 737 | 9.4 | 126.94 | 36.00 |
| 2022/12 | 9,553 | 3.5 | 816 | -22.2 | 790 | -28.1 | 517 | -29.8 | 89.13 | 36.00 |
| 2023/12 (CE) | 9,800 | 2.6 | 600 | -26.5 | 660 | -16.5 | 450 | 13.0 | 77.41 | 30.00 |
| 2022/12 2Q | 5,111 | 5.7 | 626 | -12.6 | 620 | -17.5 | 407 | -16.9 | 70.28 | 16.00 |
| 2023/12 2Q | 4,827 | -5.6 | 458 | -26.7 | 552 | -11.0 | 361 | -11.4 | 62.04 | 14.00 |
Sales and operating profit (quarterly)
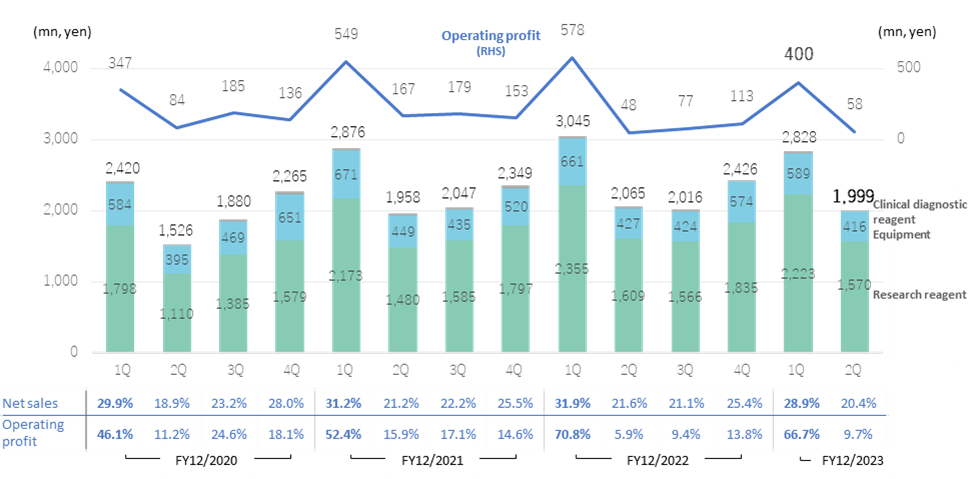
Note: Clinical diagnostics reagent sales are insignificant, and figures have not been shown. The table at the bottom shows the composition of the quarterly record to the full-year figures; The figures for FY12/2023 are a progress ratio to the full-year forecast.
Source: Omega Investment from company materials.
The profit forecast for the year’s first half was based on an exchange rate assumption of 140 yen, so the difference with the actual result (135 yen) was an upward swing in profit. To cope with the weak yen (i.e. worsening of the depreciation rate due to higher import costs), the company has been gradually raising prices on some products since last autumn (by several to 20% depending on the product). As a result, the gross profit margin has recovered moderately from around 35% in 2Q FY12/2022 to 36.6% in 2Q FY12/2023. In addition, SG&A expenses continued to be under control, with a YoY increase of only 4.2%.
As known, the company’s revenues tend to be higher in 1Q, reflecting the nature of customers’ budgeting. As of the end of 2Q, sales and operating profit were 49.3% and 76.3% of the full-year forecasts, respectively. In FY12/2022, as of 2Q, sales and operating profit were 53.5% and 76.7% of the full-year estimates, respectively. Operating profit is running on par with the previous year. Hopefully, sales should progress well in the second half of the year.
By product, sales were down in each following categories: research reagent, 3,793 million yen (-4.3%); equipment, 1,005 million yen (-7.6%); and clinical diagnostics reagent, 28 million yen (-50.3%). The main reasons for these declines are as mentioned above. Still, it also appears that the company could not conduct sufficient sales activities and develop enough customers for new products when COVID-19 spread. In research reagents, the YoY decline in sales of contract services had a significant impact. Sales of consumables included in Equipment were also sluggish.
In 2Q alone, sales were 1,999 million yen, down 3.1%, and operating profit was 58 million yen, up 20.8%. By product, sales were 1,570 million yen (-2.4%) for research reagents, 416 million yen (-2.6%) for equipment and 12 million yen (-58.6%) for clinical diagnostic reagents, all of which were down.
In the BS, current assets at the end of June 2023 increased by 434 million yen compared to the end of the previous year. Cash and deposits increased by 715 million yen, while trade receivables decreased. Investment securities increased by 125 million, and non-current assets increased by 104 million yen to 3,281 million yen, bringing total assets to 10,852 million yen (up 538 million yen). As for liabilities and equity, total liabilities increased to 1,763 million yen (up 68 million yen) due to an increase in long-term liabilities. At the end of June 2023, the equity ratio was 78.4%, an improvement of 0.3 percentage points YoY.
◇ Forecast for FY12/2023 : No change from initial forecasts
The company’s forecasts for FY12/2023 were 9.8 billion yen (+2.6%) for net sales, 0.6 billion yen (-26.5%) for operating profit, 0.66 billion yen (-16.5%) for ordinary profit and 0.45 billion yen (-13.0%) for net profit attributable to owners of parent company, and as of the end of 2Q there were no changes. The progress ratios were 49.3%, 76.3%, 83.6% and 80.2%, respectively, almost unchanged from previous year.
In the 2H of the year, sales and other activities have returned to pre-pandemic levels in line with the downgrading of COVID-19 to category 5. Activated sales are expected to contribute to earnings. In addition, the selling price changes implemented in response to rising procurement costs are gradually becoming more widespread, and the company should be able to achieve its full-year forecasts.
The company has not changed its dividend policy, which is 14 yen for the interim period (16 yen for the same period previous year) and 16 yen for the year-end period (20 yen previous year), for a total dividend of 30 yen (36 yen previous year). The dividend payout ratio this year is expected to be 38.8%. If earnings recover over the second half of the year, there may be scope for a dividend review.
◇ Share price outlook: Earnings recovery over the second half of the year is the key
The share price has fallen below 1,000 yen since early in the year. With the yen expected to continue to depreciate and a forecast of declining profits for the full year, it is difficult to anticipate the share price to rise soon. However, as mentioned above, if the earnings progress well in 2H, the share price should positively react. The shares trade below PBR of 1x, and we would like to see how the company will make a move.
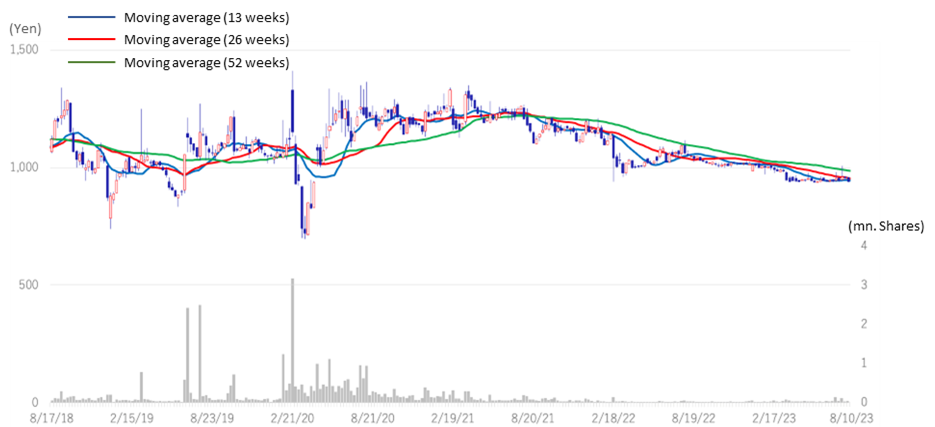
3386: 5-year stock price move
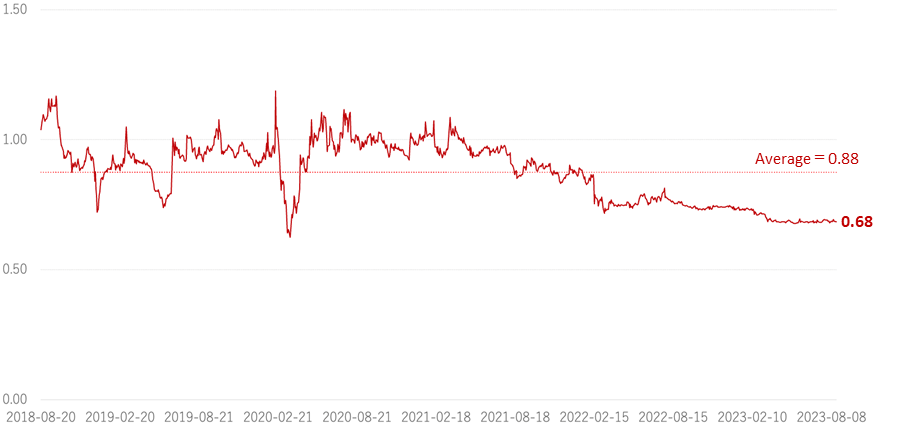
Historical PBR (LTM, last five years)
Financial data I (quarterly)
| 2020/12 | 2021/12 | 2022/12 | 2023/12 | |||||||||||
| 1Q | 2Q | 3Q | 4Q | 1Q | 2Q | 3Q | 4Q | 1Q | 2Q | 3Q | 4Q | 1Q | 2Q | |
| [Statements of income] | ||||||||||||||
| Net sales | 2,420 | 1,526 | 1,880 | 2,266 | 2,878 | 1,957 | 2,046 | 2,350 | 3,047 | 2,064 | 2,016 | 2,426 | 2,828 | 1,999 |
| Year-on-year basis | 12.7% | -7.3% | 4.4% | 13.6% | 18.9% | 28.2% | 8.8% | 3.7% | 5.9% | 5.5% | -1.5% | 3.2% | -7.2% | -3.1% |
| Research reagent | 1 | 1 | 0 | 1 | 103 | 0 | 0 | 0 | 2,355 | 1,609 | 1,566 | 1,835 | 2,223 | 1,570 |
| Equipment | 661 | 427 | 424 | 574 | 589 | 416 | ||||||||
| Clinical diagnostic reagent | 90 | 82 | 138 | 168 | 143 | 138 | 157 | 171 | 29 | 29 | 26 | 17 | 16 | 12 |
| Cost of sales | 1,486 | 930 | 1,123 | 1,401 | 1,736 | 1,157 | 1,242 | 1,437 | 1,886 | 1,345 | 1,305 | 1,576 | 1,789 | 1,273 |
| Gross profit | 934 | 595 | 757 | 866 | 1,142 | 800 | 803 | 913 | 1,160 | 719 | 712 | 849 | 1,039 | 726 |
| Gross profit margin | 38.6% | 39.0% | 40.3% | 38.2% | 39.7% | 40.9% | 39.2% | 38.9% | 38.1% | 34.8% | 35.3% | 35.0% | 36.7% | 36.3% |
| SG&A expenses | 586 | 512 | 572 | 729 | 593 | 632 | 625 | 759 | 581 | 672 | 635 | 736 | 638 | 668 |
| Operating profit | 347 | 84 | 185 | 136 | 549 | 167 | 179 | 153 | 578 | 48 | 77 | 113 | 400 | 58 |
| Year-on-year basis | 53.5% | 460.0% | 62.3% | 172.0% | 58.2% | 98.8% | -3.2% | 12.5% | 5.3% | -71.3% | -57.0% | -26.1% | -30.7% | 20.8% |
| Operating profit margin | 14.3% | 5.5% | 9.8% | 6.0% | 19.1% | 8.5% | 8.7% | 6.5% | 19.0% | 2.3% | 3.8% | 4.7% | 14.1% | 2.9% |
| Non-operating profit | 8 | 43 | 9 | 11 | 7 | 42 | 9 | 13 | 6 | 27 | 11 | 13 | 16 | 85 |
| Non-operating expenses | 0 | 0 | 0 | 6 | 22 | -8 | 2 | 4 | 20 | 19 | 18 | 26 | 0 | 0 |
| Ordinary Profit | 355 | 127 | 194 | 141 | 534 | 218 | 185 | 162 | 565 | 55 | 70 | 100 | 416 | 136 |
| Extraordinary profit | – | – | 0 | 0 | – | – | – | – | – | – | – | – | – | – |
| Extraordinary expenses | – | – | 0 | 0 | – | – | – | – | – | – | – | – | – | – |
| Income before income taxes | 355 | 318 | 194 | 141 | 534 | 218 | 185 | 162 | 565 | 55 | 70 | 100 | 416 | 136 |
| Total income taxes | 114 | 98 | 60 | 35 | 184 | 55 | 58 | 34 | 179 | 15 | 19 | 25 | 137 | 37 |
| Net profit | 232 | 218 | 125 | 99 | 333 | 157 | 125 | 122 | 366 | 41 | 47 | 63 | 264 | 97 |
| Year-on-year basis | 57.8% | 581.3% | 56.3% | -550.0% | 43.5% | -28.0% | 0.0% | 23.2% | 9.9% | -73.9% | -62.4% | -48.4% | -27.8% | 136.6% |
| Net profit ratio | 9.6% | 14.3% | 6.6% | 4.4% | 11.6% | 8.0% | 6.1% | 5.2% | 12.0% | 2.0% | 2.3% | 2.6% | 9.3% | 4.9% |
| [Balance Sheets] | ||||||||||||||
| Current assets | 6,315 | 6,300 | 6,383 | 6,756 | 6,975 | 6,797 | 6,983 | 7,310 | 7,754 | 7,409 | 7,089 | 7,136 | 7,558 | 7,570 |
| cash and deposits | 2,407 | 3,171 | 3,251 | 3,159 | 2,702 | 3,235 | 3,147 | 3,255 | 2,994 | 3,370 | 3,347 | 3,036 | 2,926 | 3,752 |
| Accounts receivable | 2,911 | 2,033 | 2,188 | 2,784 | 3,262 | 2,431 | 2,434 | 2,714 | 3,390 | 2,567 | 2,436 | 2,799 | 3,332 | 2,488 |
| Goods and products | 721 | 861 | 804 | 572 | 551 | 742 | 804 | 805 | 900 | 1,054 | 1,077 | 1,055 | 981 | 1,005 |
| Non-current assets | 2,980 | 3,003 | 3,039 | 2,883 | 2,957 | 2,838 | 2,789 | 2,761 | 2,801 | 2,905 | 3,009 | 3,176 | 3,136 | 3,281 |
| Property, plant and equipment | 689 | 673 | 649 | 636 | 624 | 606 | 593 | 599 | 591 | 586 | 583 | 577 | 578 | 566 |
| Investments and other assets | 2,101 | 2,157 | 2,224 | 2,081 | 2,168 | 2,037 | 1,998 | 1,979 | 2,038 | 2,149 | 2,269 | 2,428 | 2,391 | 2,550 |
| Total assets | 9,295 | 9,304 | 9,422 | 9,640 | 9,933 | 9,635 | 9,773 | 10,072 | 10,556 | 10,315 | 10,098 | 10,313 | 10,695 | 10,852 |
| Current liabilities | 1,158 | 976 | 1,057 | 1,226 | 1,327 | 1,015 | 915 | 1,093 | 1,450 | 1,131 | 927 | 1,038 | 1,203 | 1,037 |
| Short-term borrowings | 142 | 199 | 199 | 180 | 180 | 190 | 199 | 183 | 183 | 188 | 188 | 184 | 20 | |
| Non-current liabilities | 600 | 593 | 570 | 552 | 609 | 597 | 654 | 658 | 632 | 632 | 639 | 656 | 663 | 726 |
| Total liabilities | 1,758 | 1,569 | 1,628 | 1,779 | 1,937 | 1,613 | 1,570 | 1,752 | 2,083 | 1,763 | 1,566 | 1,695 | 1,866 | 1,763 |
| Total net assets | 7,537 | 7,734 | 7,794 | 7,861 | 7,996 | 8,022 | 8,203 | 8,319 | 8,473 | 8,552 | 8,531 | 8,617 | 8,828 | 9,088 |
| Shareholders’ equity | 7,052 | 7,247 | 7,299 | 7,358 | 7,479 | 7,499 | 7,678 | 7,787 | 7,924 | 8,004 | 7,979 | 8,052 | 8,250 | 7,789 |
| Share capital | 918 | 918 | 918 | 918 | 918 | 918 | 918 | 918 | 918 | 918 | 918 | 918 | 918 | 918 |
| Capital surplus | 1,251 | 1,251 | 1,251 | 1,251 | 1,251 | 1,252 | 1,258 | 1,258 | 1,258 | 1,260 | 1,260 | 1,260 | 1,260 | 1,261 |
| Retained earnings | 4,366 | 4,584 | 4,662 | 4,761 | 4,940 | 5,097 | 5,153 | 5,274 | 5,502 | 5,543 | 5,496 | 5,560 | 5,708 | 5,805 |
| Treasury shares | -67 | -67 | -67 | -67 | -207 | -251 | -239 | -239 | -239 | -216 | -216 | -216 | -216 | -194 |
| Accumulated other comprehensive income |
582 | 560 | 533 | 494 | 575 | 483 | 586 | 574 | 484 | 498 | 520 | 530 | 580 | 719 |
| Non-controlling interests | 485 | 487 | 495 | 503 | 517 | 523 | 525 | 532 | 549 | 548 | 552 | 565 | 578 | 579 |
| Total liabilities and net assets | 9,295 | 9,304 | 9,422 | 9,640 | 9,933 | 9,635 | 9,773 | 10,072 | 10,556 | 10,315 | 10,098 | 10,313 | 10,695 | 10,852 |
| Shareholders’ equity ratio | 75.9% | 77.9% | 77.5% | 76.3% | 75.3% | 77.8% | 78.6% | 77.3% | 75.1% | 77.6% | 79.0% | 78.1% | 77.1% | 78.4% |
| [Statements of cash flows] | ||||||||||||||
| Cash flow from operating activities | 735 | 803 | 600 | 648 | 480 | 284 | 848 | |||||||
| Cash flow from investing activities | 70 | 42 | -187 | -145 | -260 | -291 | -33 | |||||||
| Cash flow from financing activities | -49 | -97 | -343 | -420 | -142 | -236 | -119 | |||||||
| Net increase in cash and cash equiv. | 755 | 743 | 76 | 95 | 115 | -218 | 715 | |||||||
| Cash and cash equiv. at beginning of period |
2,416 | 2,416 | 3,159 | 3,159 | 3,255 | 3,255 | 3,036 | |||||||
| Cash and cash equiv. at end of period |
3,171 | 3,159 | 3,235 | 3,255 | 3,370 | 3,036 | 3,752 | |||||||
Note: For the cash flow statement, the figures for 2Q are the cumulative totals for 1Q-2Q. The figures for 4Q are the cumulative totals for 1Q-4Q. Therefore, the opening balances are also those of the previous 4Q.
Source: Omega Investment from company materials
Financial data II (Fiscal year)
| 2012/12 | 2013/12 | 2014/12 | 2015/12 | 2016/12 | 2017/12 | 2018/12 | 2019/12 | 2020/12 | 2021/12 | 2022/12 | |
| [Statements of income] | |||||||||||
| Net sales | 7,241 | 7,050 | 7,235 | 7,357 | 7,427 | 7,068 | 7,261 | 7,590 | 8,092 | 9,231 | 9,553 |
| Year-on-year | 0.7% | -2.6% | 2.6% | 1.7% | 1.0% | -4.8% | 2.7% | 4.5% | 6.6% | 14.1% | 3.5% |
| Cost of sales | 4,057 | 4,429 | 4,811 | 4,976 | 4,655 | 4,535 | 4,602 | 4,710 | 4,940 | 5,572 | 6,112 |
| Gross profit | 3,184 | 2,620 | 2,424 | 2,380 | 2,772 | 2,532 | 2,659 | 2,879 | 3,152 | 3,658 | 3,440 |
| SG&A expenses | 2,386 | 2,349 | 2,261 | 2,180 | 2,257 | 2,339 | 2,330 | 2,474 | 2,399 | 2,609 | 2,624 |
| Operating profit | 798 | 271 | 162 | 200 | 514 | 193 | 328 | 405 | 752 | 1,048 | 816 |
| Year-on-year | -10.4% | -66.0% | -40.2% | 23.5% | 157.0% | -62.5% | 69.9% | 23.5% | 85.7% | 39.4% | -22.1% |
| Operating profit margin | 11.0% | 3.8% | 2.2% | 2.7% | 6.9% | 2.7% | 4.5% | 5.3% | 9.3% | 11.4% | 8.5% |
| Non-operating profit | 46 | 177 | 128 | 175 | 21 | 208 | 89 | 72 | 71 | 71 | 57 |
| Non-operating expenses | 43 | 3 | 5 | 2 | 51 | 3 | 13 | 7 | 6 | 20 | 83 |
| Ordinary Profit | 801 | 444 | 285 | 373 | 483 | 397 | 403 | 470 | 817 | 1,099 | 790 |
| Extraordinary profit | 3 | 9 | 46 | 34 | 55 | 8 | 190 | ||||
| Extraordinary expenses | 30 | 2 | 1 | 0 | 82 | 5 | 81 | ||||
| Income before income taxes | 774 | 451 | 330 | 407 | 456 | 400 | 403 | 388 | 1,008 | 1,099 | 790 |
| Total income taxes | 336 | 137 | 131 | 158 | 180 | 148 | 126 | 142 | 307 | 331 | 238 |
| net profit attributable to owner of parent |
411 | 313 | 201 | 230 | 254 | 237 | 260 | 237 | 674 | 737 | 517 |
| Year-on-year | -10.3% | -23.8% | -35.8% | 14.4% | 10.4% | -6.7% | 9.7% | -8.8% | 184.4% | 9.3% | -29.9% |
| Net profit ratio | 5.7% | 4.4% | 2.8% | 3.1% | 3.4% | 3.4% | 3.6% | 3.1% | 8.3% | 8.0% | 5.4% |
| [Balance Sheets] | |||||||||||
| Current assets | 5,413 | 5,527 | 5,234 | 5,266 | 5,495 | 5,143 | 5,668 | 5,927 | 6,756 | 7,310 | 7,136 |
| Cash equivalents and short-term securities |
2,143 | 2,036 | 1,482 | 1,498 | 1,948 | 1,483 | 2,268 | 2,516 | 3,259 | 3,555 | 3,036 |
| Non-current assets | 1,541 | 2,750 | 2,927 | 2,523 | 2,438 | 2,982 | 2,832 | 2,962 | 2,883 | 2,761 | 3,176 |
| Property, plant and equipment | 178 | 185 | 213 | 227 | 319 | 690 | 636 | 695 | 636 | 599 | 577 |
| Investments and other assets | 1,201 | 2,456 | 2,613 | 2,071 | 1,842 | 2,041 | 1,943 | 2,068 | 2,081 | 1,979 | 2,428 |
| Total assets | 6,955 | 8,277 | 8,161 | 7,790 | 7,934 | 8,126 | 8,501 | 8,890 | 9,640 | 10,072 | 10,313 |
| Current liabilities | 916 | 818 | 1,130 | 1,017 | 916 | 799 | 945 | 987 | 1,226 | 1,093 | 1,038 |
| Short-term borrowings | 20 | 20 | 20 | 20 | 20 | 20 | 20 | 20 | 20 | 20 | 20 |
| Non-current liabilities | 317 | 660 | 497 | 394 | 436 | 488 | 502 | 581 | 552 | 658 | 656 |
| Total liabilities | 1,234 | 1,479 | 1,628 | 1,412 | 1,352 | 1,288 | 1,448 | 1,568 | 1,779 | 1,752 | 1,695 |
| Total net assets | 5,720 | 6,797 | 6,532 | 6,378 | 6,581 | 6,838 | 7,053 | 7,321 | 7,861 | 8,319 | 8,617 |
| Shareholders’ equity | 5,230 | 6,311 | 6,050 | 5,951 | 6,135 | 6,381 | 6,581 | 6,843 | 7,358 | 7,787 | 8,052 |
| Share capital | 918 | 918 | 918 | 918 | 918 | 918 | 918 | 918 | 918 | 918 | 918 |
| Capital surplus | 1,221 | 1,221 | 1,221 | 1,251 | 1,251 | 1,251 | 1,251 | 1,251 | 1,251 | 1,258 | 1,260 |
| Retained earnings | 3,119 | 3,314 | 3,397 | 3,521 | 3,680 | 3,812 | 4,026 | 4,181 | 4,761 | 5,274 | 5,560 |
| Treasury shares | -67 | -67 | -67 | -67 | -67 | -67 | -67 | -67 | -67 | -239 | -216 |
| Valuation and exchange differences | 37 | 924 | 579 | 327 | 352 | 466 | 451 | 558 | 494 | 574 | 530 |
| Total liabilities and net assets | 6,955 | 8,277 | 8,161 | 7,790 | 7,934 | 8,126 | 8,501 | 8,890 | 9,640 | 10,072 | 10,313 |
| (Equity ratio) | 75.2% | 76.2% | 74.1% | 76.4% | 77.3% | 78.5% | 77.4% | 77.0% | 76.3% | 77.3% | 78.1% |
| [Statements of cash flows] | |||||||||||
| Cash flow from operating activities | 347 | 126 | 297 | 129 | 573 | 89 | 908 | 549 | 803 | 648 | 284 |
| Cash flow from investing activities | -167 | -99 | -227 | -263 | 99 | -235 | -185 | -115 | 42 | -145 | -291 |
| Cash flow from financing activities | -126 | -126 | -122 | -151 | -107 | -109 | -85 | -85 | -97 | -420 | -236 |
| Net increase in cash and cash equiv. | 61 | -97 | -52 | -285 | 549 | -264 | 684 | 348 | 743 | 95 | -218 |
| Cash and cash equiv. at beginning of period |
1,471 | 1,532 | 1,435 | 1,383 | 1,098 | 1,648 | 1,383 | 2,068 | 2,416 | 3,159 | 3,255 |
| Cash and cash equiv. at end of period |
1,532 | 1,435 | 1,383 | 1,098 | 1,648 | 1,383 | 2,068 | 2,416 | 3,159 | 3,255 | 3,036 |
| FFF | 180 | 27 | 70 | -134 | 672 | -146 | 723 | 434 | 845 | 503 | -7 |
Source: Omega Investment from company materials